On the 7th anniversary of the disappearance of MH370, members of the MH370 Independent Group have released separate reports that analyze two wing parts that have been recovered from East Africa. The two parts represent the first and most recent pieces of MH370 that have been found. Both reports conclude that the flight likely ended in a high speed descent.
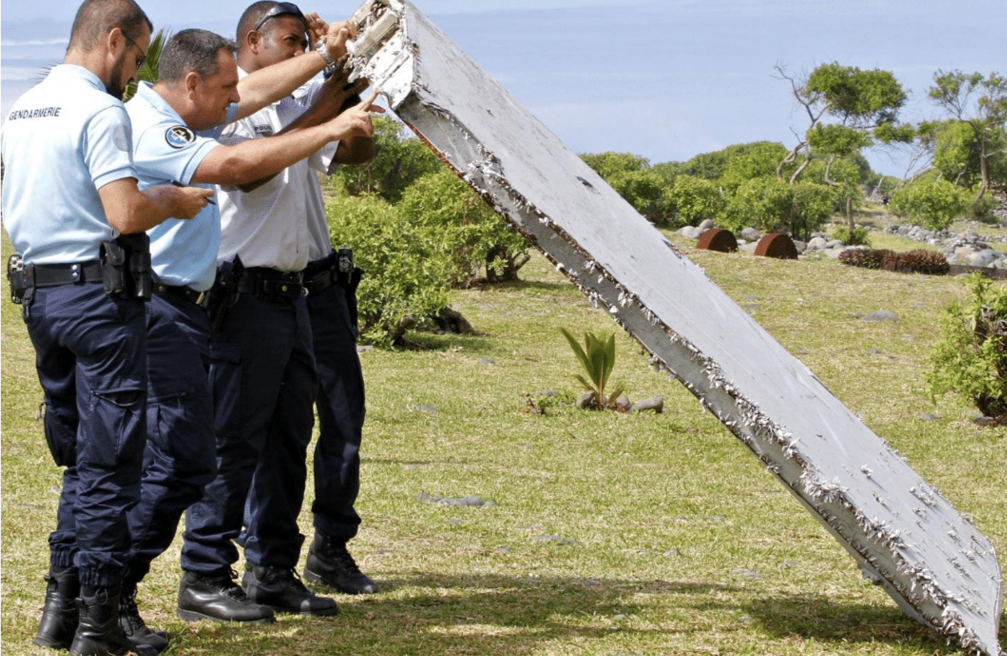
The first report, authored by Tom Kenyon, is the culmination of several years of work of structural analysis of the right flaperon that was recovered from Reunion Island in July 2015. After performing a Finite Element Analysis (FEA) on a numerical model of the flaperon and reviewing photographs of the damaged part, Tom believes that the damage on the part is not consistent with damage expected if the flaperon was attached to the wing as it impacted water. Rather, the damage to the two hinge attachments is consistent with high cycle fatigue from torsional flutter, which likely led to separation from the aircraft while still airborne. Based on Tom’s review of simulations of uncontrolled descents for the B777, he concludes the expected airspeeds are well beyond design limits that lead to flutter and structural failure.
Local police on Reunion Island examine flaperon in July 2015.
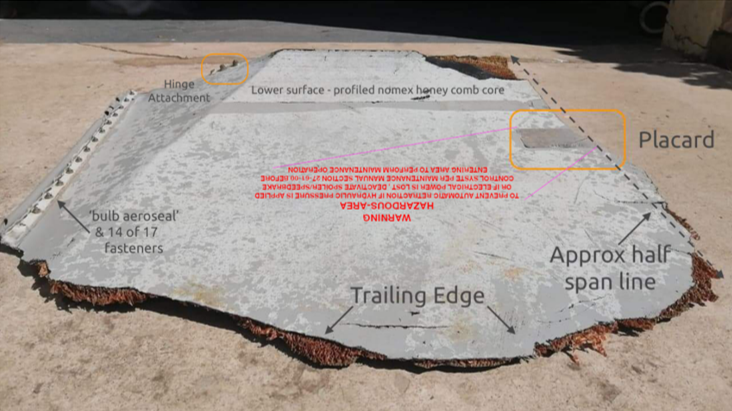
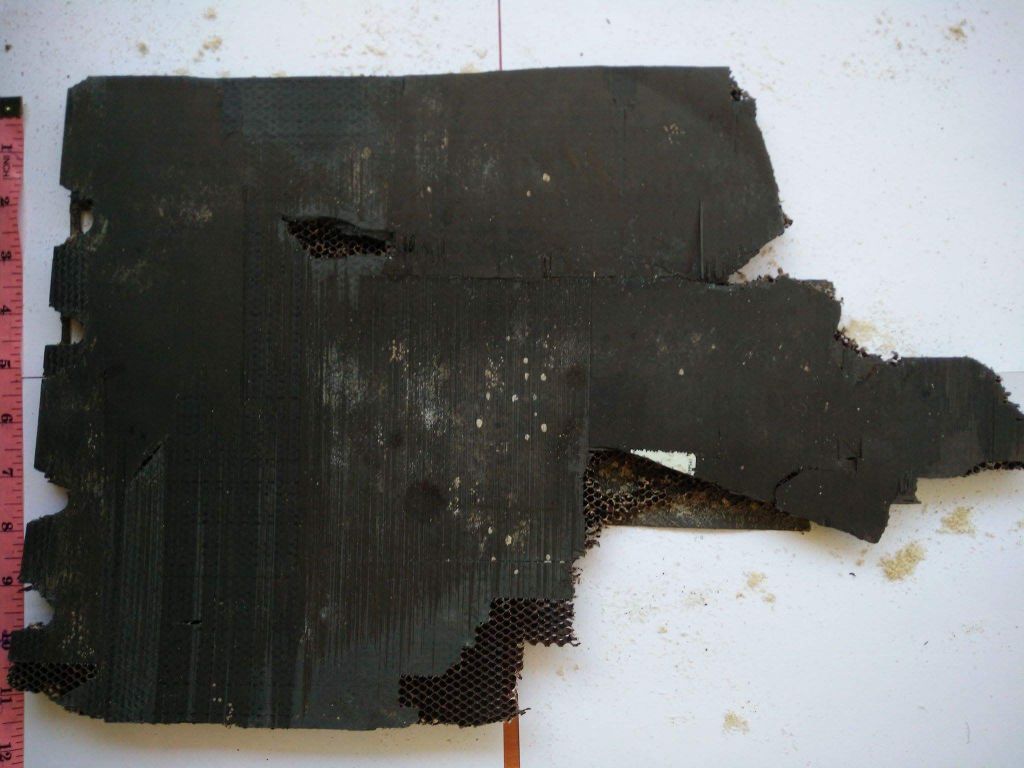
The second report, authored by Mike Exner and Don Thompson, analyzes a part that was recovered from Jeffreys Bay, South Africa, in August 2020. Based on an evaluation of features and markings, the authors positively identify the part as either spoiler #8 or spoiler #9 from the right wing from a Boeing 777, and by extension, almost certainly from MH370.
Spoiler with annotations for identified features.
The authors observe that the spoiler detached at structures that attach the spoiler to the rear spar of the right wing. The fracture along a chord line is consistent with bending of the spar along the span of the wing. At high airspeeds, wings dynamically flex due to flutter, and the dynamic aeroelastic loads that are induced will rapidly grow until the wing structurally fails.
A visualization of wing flutter can be seen in this video of a scaled model of a B747 in a wind tunnel.
The high speed descent theorized in both reports is consistent with the final BFO values recorded by the Inmarsat Ground Earth Station (GES) on March 8, 2014, at 00:19z. Those values suggest the plane was in a 0.7g downward acceleration. Without inputs from a skilled pilot, the aircraft would have impacted the ocean shortly after reaching this condition, which would mean the debris field on the seabed is relatively close to the 7th arc.
Today, the Indonesian transportation authority KNKT released a Preliminary Report on Swriwijaya Air flight SJ182, a Boeing 737-500 that crashed after departing Jakarta on Jan 9, 2021. From the report:
On 9 January 2021, a Boeing 737-500 aircraft, registration PK-CLC, on a scheduled domestic flight, took off from Soekarno-Hatta International Airport, Jakarta, to Supadio International Airport (WIOO), Pontianak, at 0736 UTC (1436 LT).
The flight was cleared by Air Traffic Control (ATC) to depart on a Standard Instrument Departure (SID) ABASA 2D to Flight Level (FL) 290. After taking off from Runway 25R, the autopilot was engaged at altitude of 1,980 feet. The pilots subsequently requested a heading change to 075° to enable them to deviate from weather. ATC responded with clearance for heading 075° and the flight began a turn to the right. ATC then instructed the flight to stop climbing at 11,000 feet due to conflicting departure traffic from Runway 25L.
About 10,600 feet, the aircraft heading started turning to the left. About 10,900 feet, the autopilot disengaged, and the aircraft turned to the left and started its descent. At 14:40:37 LT, the radar target of the aircraft disappeared on the ATC radar screen. Thereafter, ATC attempted to obtain information of SJY182 aircraft by calling several times, activating and calling on the emergency frequency, and asking other pilots that were flying nearby. All efforts were unsuccessful to get a response from the SJY182 pilot.
About 1455 LT, the Air Traffic Services (ATS) provider reported the occurrence to the Indonesian Search and Rescue Agency (Badan Nasional Pencarian dan Pertolongan/BNPP), and at 1542 LT, declared the uncertainty phase (INCERFA) of SJY182. The distress phase of SJY182 (DETRESFA) was subsequently declared at 1643 LT.
At the time of issuing this preliminary report, the memory unit of the Cockpit Voice Recorder (CVR) has not been recovered and the search is continuing.
The Komite Nasional Keselamatan Transportasi (KNKT) acknowledged that the safety actions taken by the Directorate General of Civil Aviation (DGCA) and Sriwijaya Air were relevant to improve safety, however there are safety issues remain to be considered. Therefore, the KNKT issued safety recommendations to address the safety issues identified in this report.
This investigation involved the participation of the National Transportation Safety Board (NTSB) of the United States of America as the State of Design and the State of Manufacture, and the Transport Safety Investigation Bureau (TSIB) of Singapore as States providing assistance. Both agencies have appointed their accredited representatives to assist in this investigation in accordance with the provisions in ICAO Annex 13.
The investigation is ongoing. Should further safety issues emerge during the course of the investigation, KNKT will bring the issues to the attention of the relevant parties and issue safety recommendation(s) as required.
Notably, there are findings related to the behavior of the autothrottle, as the thrust to the left engine was reduced during the climb:
After the aircraft climbed past 8,150 feet, the thrust lever position of the left engine started reducing, while the thrust lever position of the right engine remained. The FDR data also recorded the left engine (N1) was decreasing whereas the right engine N1 remained.
The SJY182 pilot requested to the Terminal East (TE) controller for a heading change to 075° to avoid weather conditions and was approved. The TE controller predicted the heading change would make the SJY182 conflicted with another aircraft that was departing from Runway 25L to the same destination. Therefore, the TE controller instructed the SJY182 pilot to stop climbing at 11,000 feet.
The FDR data recorded that when the aircraft’s altitude was about 10,600 feet the aircraft began turning to the left. The thrust lever position of the left engine continued decreasing while the thrust lever position of the right engine remained.
At 14:39:54 LT, the TE controller instructed SJY182 to climb to an altitude of 13,000 feet, and the instruction was read back by an SJY182 pilot at 14:39:59 LT. This was the last known recorded radio transmission by the flight.
The highest aircraft altitude recorded in the FDR was about 10,900 feet, thereafter the aircraft started its descent. The AP system then disengaged with a recorded heading of 016°, the pitch angle was 4.5° nose up, and the aircraft continued to roll to the left to more than 45°. The thrust lever position of the left engine continued decreasing while the right engine thrust lever remained.
About 5 seconds after the aircraft started its descent, the FDR data recorded the autothrottle (A/T) system disengaged and the pitch angle was more than 10° nose down.
At 14:40:48 LT, the radar target of the aircraft disappeared on the TE controller radar screen. Thereafter, the TE controller attempted to obtain information of SJY182 aircraft by calling the flight several times, activating the emergency frequency and calling SJY182 on that frequency. The TE controller also asked other pilots that were flying nearby to attempt contact with the flight. All efforts were unsuccessful to get any response from the SJY182 pilot.
The data from the FDR indicates the start of the turn to the left coincided with a reduction in thrust from the left engine, which would cause a yaw-induced bank to the left, although that was likely moderated by the autopilot. After the autopilot disengaged, the left thrust continued to decrease, the plane rolled left to a bank angle of 45°, and the plane rapidly descended. The pilots were not able to recover from this upset attitude.
Comment: The preliminary report does not discuss what pilot inputs occurred after the turn to the left began, neither while the autopilot was engaged nor after it disengaged. Correct right rudder input would have helped control the aircraft; incorrect left rudder input would have exacerbated the problem.
Independent researchers investigating the disappearance of MH370 today released a new technical report to guide the next search for the debris field on the floor of the Southern Indian Ocean (SIO). The report provides the scientific and mathematical foundation that was used to define the recommended search area that was disclosed last month. The authors of the report are Bobby Ulich, Richard Godfrey, Victor Iannello, and Andrew Banks.
The full report, including all appendices, is available for download. What follows is a brief summary of the important results.
The flight of MH370 was analyzed from takeoff to impact in the SIO using a comprehensive, fully integrated model. The model was developed using exhaustive data sets and technical documentation available from both public and confidential sources, and includes:
radar data collected by military and civilian installations in Malaysia
timing and frequency measurements collected by the Inmarsat satellite network
aircraft performance data for Boeing 777-200ERs
historical performance data for airframe 9M-MRO
navigation and speed modes for automated flight
drift analysis of debris that floated and was recovered in East Africa
aerial search results from March and April 2014
weather data along the flight path
A total of 2,300 possible flight paths were evaluated, and an overall probability metric was defined that incorporates the information from all the data sets. The highest probability flight path was identified as due south from waypoint BEDAX, which is about 185 km (100 NM) to the west of Banda Aceh, Sumatra, and an impact in the SIO near S34.2342° E93.7875°, which is 4380 km (2365 NM) from BEDAX.
The work included the development of an accurate fuel consumption model, and well as a statistical metric for the expected random noise inherent in the recorded satellite data. These improvements allowed the rejection of hypothetical flight paths that were previously believed to be possible.
Turnback Across Malaysia
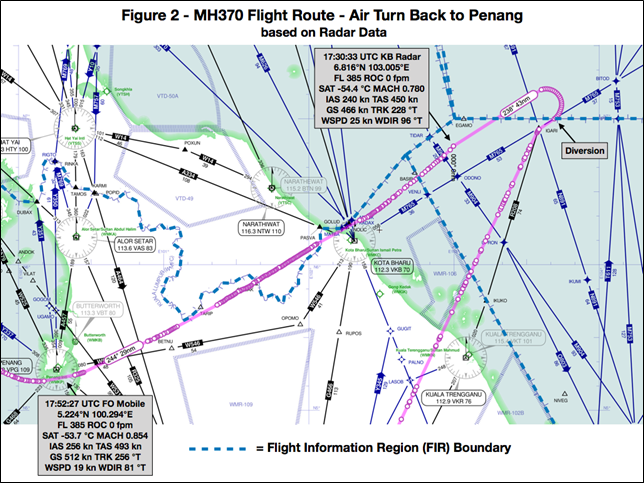
After takeoff, the climb was normal, and the aircraft leveled at a cruise altitude of FL350 (35,000 ft standard altitude), tracking towards waypoint IGARI in the South China Sea. After flying by waypoint IGARI, the transponder was disabled as the aircraft turned towards waypoint BITOD. On passing the FIR boundary between Malaysia and Vietnam, the aircraft began turning back towards the Malay peninsula, and flew towards Kota Bharu airport, as shown in the figure below.
Flight path over Malaysia after turnback at IGARI
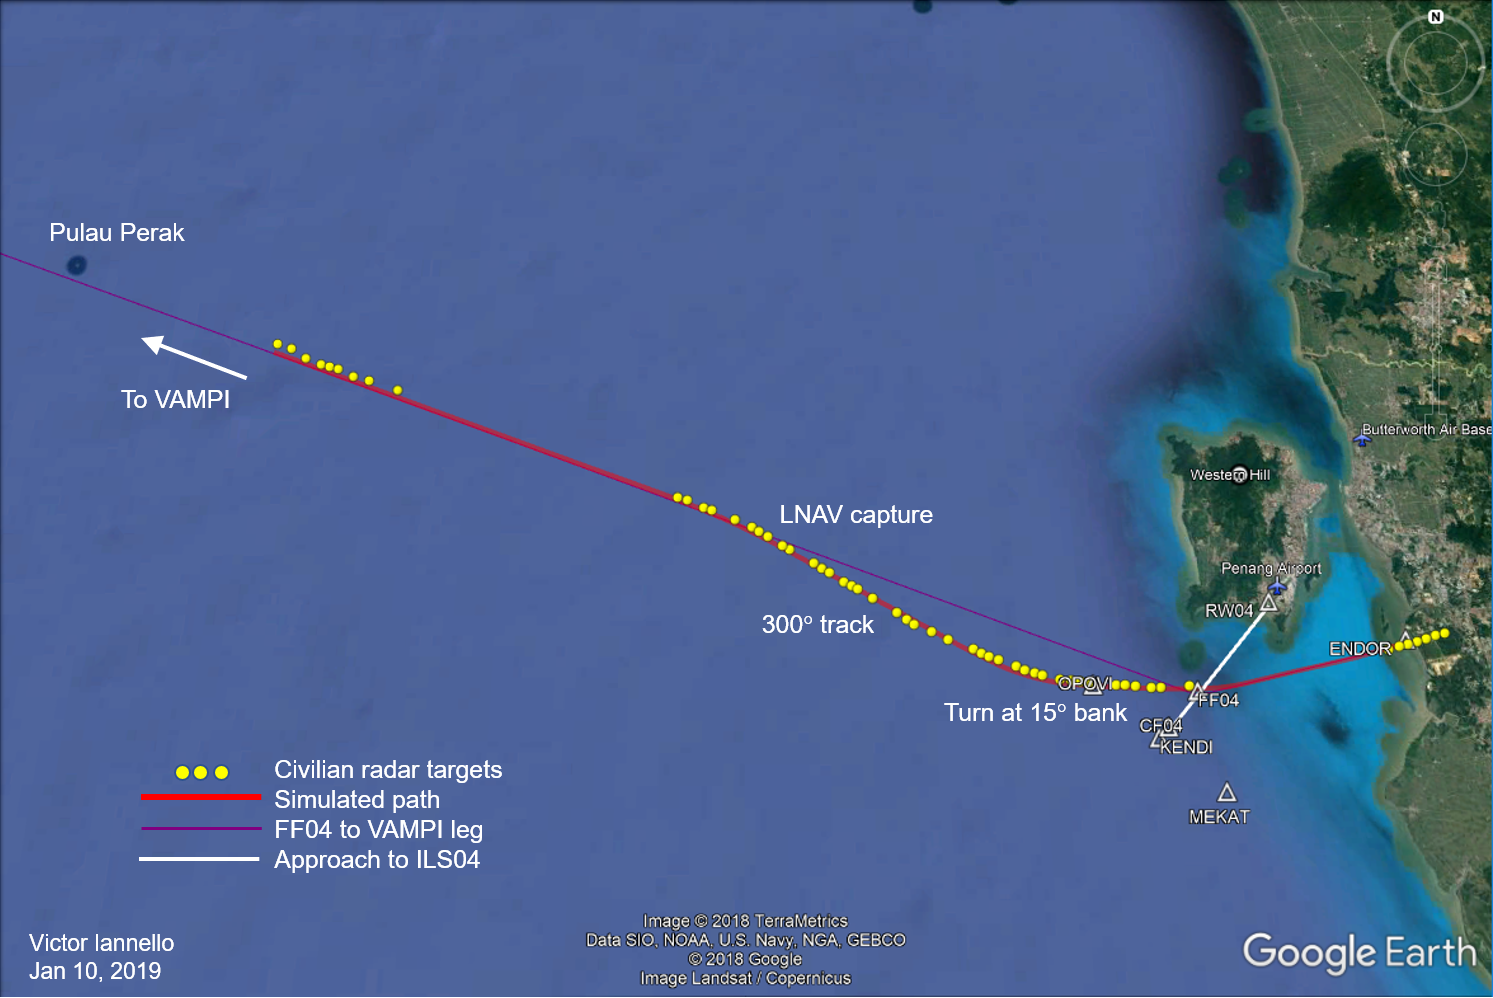
The civilian radar installation at Kota Bharu captured MH370 as it flew towards and then away from Kota Bharu. An analysis of this radar data shows that the aircraft climbed from FL350 to about FL385 (true altitude of 40,706 ft) and accelerated to near its maximum operating speed of Mach 0.87 as it passed to the north of Kota Bharu. It then flew across the Malay peninsula and towards Penang Island, where a civilian radar installation at Butterworth Airport captured the radar targets. As it passed to the south of Penang Island near Penang Airport, it slowed down to a speed closer to Mach 0.84, and turned to the northwest over the Malacca Strait.
Flight over the Malacca Strait and Around Sumatra
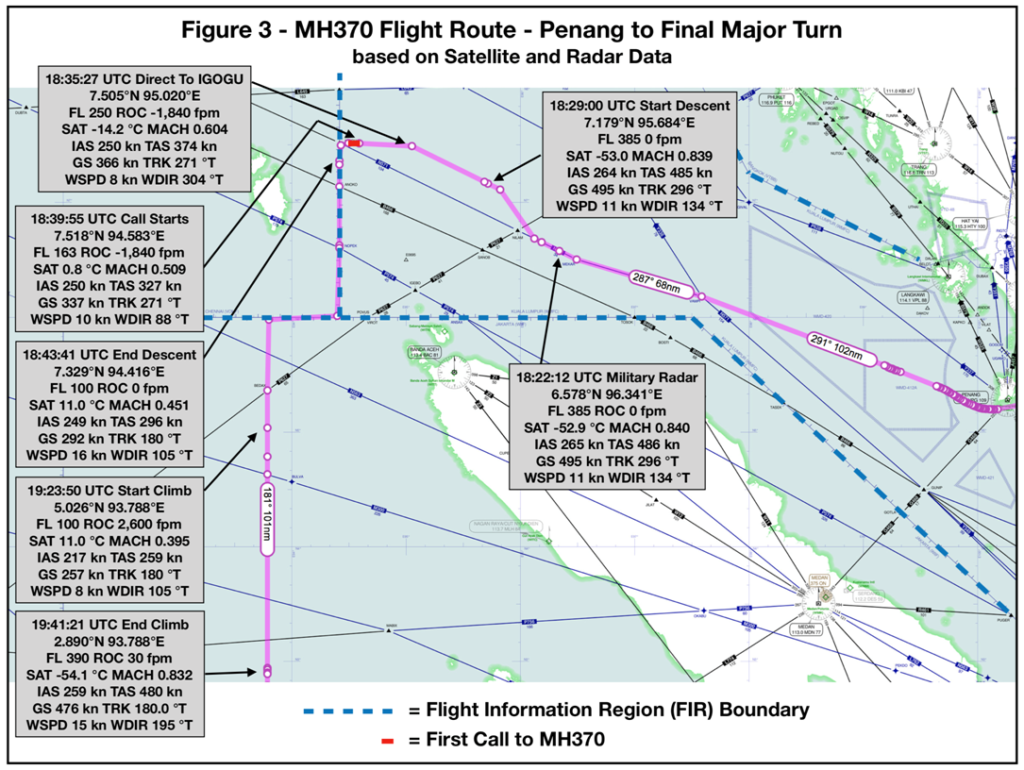
The flight over the Malacca Strait was captured by Malaysian military radar, as disclosed in a briefing to family members in Beijing in March 2014. After passing Penang Island, the aircraft proceeded on an exact course to waypoint VAMPI, and intercepted airway N571. The last radar target was captured at 18:22:12 about 10 NM after passing waypoint MEKAR on N571. The flight over the Malacca Strait, around Sumatra, and towards the South is shown in the figure below.
Flight path over the Malacca Strait and around Sumatra
In the report, it’s deduced that soon after the aircraft was beyond Malaysia radar coverage, MH370 began a “lateral offset” that would position the aircraft about 15 NM to the right of N571, possibly to ensure separation from other traffic. Once this offset was completed at around 18:29, a descent began, and when the altitude reached FL250 (well below the minimum altitude of FL275 for traffic on N571), the aircraft turned directly towards waypoint IGOGU on a westerly course.
On reaching IGOGU, it’s deduced that the aircraft continued its descent and turned due south, flying along the FIR boundary between Malaysia and India. It leveled at around FL100 (10,000 ft standard altitude), and continued south until reaching the FIR boundary of Indonesia. It then turned to the west, away from Indonesia, and flew along the FIR boundary.
It’s further deduced that the final course change was due south towards waypoint BEDAX. After passing BEDAX, a climb to FL390 began at around 19:24, ending at around 19:41. The aircraft continued on a due south course at LRC speed towards the South Pole until fuel exhaustion occurred in the SIO at around 00:17.
The authors observe that the trajectory last covered by Malaysian radar was to the northwest along N571. Only when beyond Malaysian radar coverage was a descent to a lower altitude initiated, which was followed by turns to the west and south. It’s hypothesized that the intention was to lead the searchers into believing the trajectory continued along N571 to the northwest, as the transit at low altitude would have been below the radar horizon of Indonesian and Thai radar installations. It is only because of the analysis of the satellite data first performed by Inmarsat that we know the flight path continued into the SIO. Very likely, the party responsible for the diversion was not aware that this data set was recorded and could be later used to deduce a path.
The entire flight path is summarized in the figure below.
The flight path from takeoff to impact in the SIO
Possible MH370 Sighting by Kate Tee
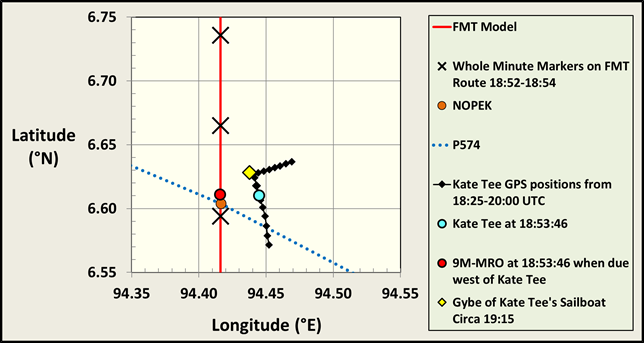
Kate Tee was on a sailboat on 7th March 2014 southeast of Great Nicobar Island and northwest of Sumatra. She reported seeing a large aircraft coming towards her from the north, flying at an unusually low altitude. At around the same time, she reported that the sailboat gybed accidentally. This gybe event and the track of the sailboat were recorded on the GPS system on board, and serves to define a position and an approximate timestamp for her sighting. In this time interval, the sailboat was close to waypoint NOPEK along the FIR boundary between Malaysia and India, which may help to explain her sighting.
The figure below depicts the path of MH370 at 18:55:57 and the GPS track from the sailing boat every five minutes from 18:25 to 19:25. The GPS track from the sailing boat and the deduced flight path of MH370 appear to align.
Possible MH370 sighting by sailor Kate Tee
Probability of Various Paths to the SIO
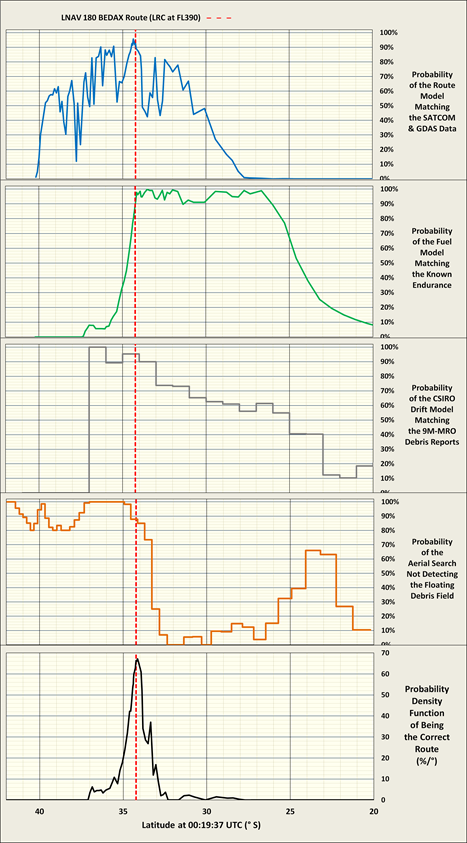
In order to rank the likelihood of various reconstructed paths to the SIO, the available data sets were compared to predictions from the mechanistic models, and the match between the measured data and the models were used to develop probabilities for each path. For each path, probabilities were calculated for four classes of measured data:
Measured satellite data compared with model predictions for navigation, weather, and data statistics
Observed fuel endurance with model predictions from fuel consumption models
Observed location and timing of recovered debris with predictions from drift models
Failure to find floating debris compared with the areas targeted by the aerial search
The overall (composite) probability for a path was calculated as the product of the of the probabilities of the four classes of data and then normalized to produce a probability density function (PDF) in which the cumulative probability across all latitudes is unity.
Each panel in the figure below shows the probabilities for each class of data, followed by the overall probability. If only considering the match to the measured satellite data presented in the first panel, the probability is highest for the path ending near 34.3°S latitude. However there are many other prominent peaks for paths ending along the 7th arc to the north and south of 34.3°S, so further discrimination is required using the other three data sets.
Probability of routes based on data sets
Peaks corresponding to end points to the south of 34.3°S are rejected because of low probabilities of matching the observed fuel endurance and the reports of the recovered debris in East Africa. On the other hand, end points to the north of 34.3°S are rejected because the impact would have produced a floating debris field that would have been detected by the aerial search with a high probability. What remains is a single prominent peak at 34.3°S, which represents a due south path from a position near waypoint BEDAX towards the South Pole.
Search Area Recommendation
The analysis presented above suggests that MH370’s flight path in its final hours followed E93.7875° longitude, corresponding to a great circle path between waypoint BEDAX and the South Pole. Using this result, the last estimated position (LEP) is S34.2342° E93.7875°. Although some of the subsea was previously searched in this vicinity, the terrain is challenging, and the debris field might have been not detected, or detected and misinterpreted. There is also the possibility that there was a controlled glide after fuel exhaustion, and an impact well beyond what was previously searched.
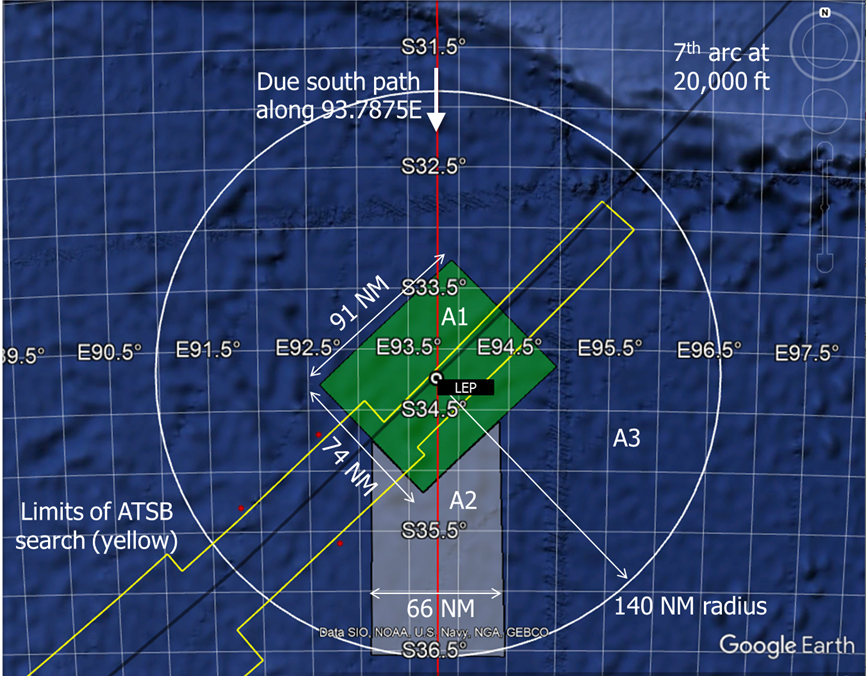
To define the search area near the LEP, three cases were considered, each with an associated search area. The highest priority search area, A1, of 6,719 NM2 (23,050 km2), assumes there were no pilot inputs after fuel exhaustion. The search area of next highest priority, A2, encompasses 6,300 NM2 (22,000 km2), and assumes there was a glide towards the south after fuel exhaustion. The lowest priority, A3, is the controlled glide in an arbitrary direction with an area of around 48,400 NM2 (166,000 km2). The three search areas are shown in the figure below.
Search area recommendation
Discussion
A new report is now available that suggests that MH370’s flight path in its final hours followed E93.7875° longitude, corresponding to a great circle path between waypoint BEDAX and the South Pole. The report concludes that an impact near S34.2342° E93.7875° is most likely.
The technical details are included in the report so the analytical results can be evaluated, reviewed, and replicated by other investigators.
Three end-of-flight scenarios were considered, and a recommended search area for each scenario was defined and prioritized. As parts of the recommended search areas were already searched by GO Phoenix and Ocean Infinity, we recommend a thorough review of the existing sonar data, recognizing that the quality of the data in that vicinity varied due to challenging terrain.
As there are no ongoing MH370 search activities, the authors of the report believe the new technical results provide credible evidence that justifies a new search.
Update on March 9, 2020 – Civilian Radar Data
A newer version of the civilian radar data is now available as an Excel file. This data set represents the raw data from the Kota Bharu and Butterworth radar heads before the data was processed and stored by the radar network. This data set was used for the calculations in the report. Also included in the Excel file is the methodology for converting the raw data to latitude and longitude.
Update on March 12, 2020
The best estimate of the point of impact (BE POI) has been renamed the last estimated position (LEP), which is a more accurate description. The location is unchanged.
Update on January 7, 2021 – Links for CSIRO Drift Results
Some contributors are performing their own drift studies using the results from the CSIRO calculations. The following links can be used to download the results as MATLAB data files. The calculations were performed for floating particles that are considered “generic” and for floating particles that are hydrodynamically and aerodynamically similar to the flaperon.
[This is the web version of a paper written by me, Bobby Ulich, Richard Godfrey, and Andrew Banks. The PDF version is available here.]
1 Introduction
Presently, there is no active search to find MH370’s debris field on the seabed of the Southern Indian Ocean (SIO). The last search was conducted by Ocean Infinity, who consulted with official and independent researchers, and subsequently scanned the seabed along the 7th arc as far north as S25° latitude. Since then, independent researchers have continued to analyze the available data to understand what areas of seabed are the most likely, and why previous search efforts have been unsuccessful. The objective is to define a manageable area for conducting a new search of the seabed.
In a previous post [1], we presented an overview of Bobby Ulich’s research [2], aimed at more precisely locating the point of impact (POI) using statistical criteria that requires that random variables (such as the reading errors of the satellite data) are not correlated, i.e., are truly random. A subsequent post [3] describes the work of Richard Godfrey et al. [4] to analytically evaluate a large number of candidate flight paths using these and other criteria. The results of that work suggest that the final hours of the flight were due south in the Indian Ocean along E93.7875° longitude, which matches a great circle between the waypoint BEDAX (about 100 NM west of Banda Aceh, Sumatra) and the South Pole. The POI was estimated to lie close to the 7th arc around S34.4° latitude.
Work continues to evaluate candidate paths using an accurate integrated model that includes satellite data, radar data, flight dynamics, automated navigation, meteorological conditions, fuel consumption, drift models, and aerial search results. That exhaustive work is nearing completion, and documentation of the methods and the results is ongoing. Like the previous work [4], the ongoing work suggests that the final trajectory of MH370 was most likely along a due south path along E93.7875° longitude.
In the interest of providing information in a timely manner, we have chosen to recommend a search area based on this most likely path. A comprehensive paper which expands upon the methods and results presented in previous work [2,4], and provides further justification for the selected path, will be available in the near future.
2 Last Estimated Position (LEP)
Using the results of the analysis presented above, the last estimated position (LEP) is based on a final trajectory of a constant longitude of E93.7875°, which is consistent with the aircraft traveling due south from waypoint BEDAX towards the South Pole. The LEP is based on a location exactly on the 7th arc, and the uncertainty associated with the LEP helps define the limits of the recommended search area.
When the SDU logs onto the Inmarsat network, the SDU begins the log-on sequence by first transmitting a log-on request, which is followed some seconds later by transmitting a log-on acknowledge. For MH370, those were the final two transmissions, transmitted at 00:19:29 (BTO = 23,000 μs) and 00:19:37 (BTO = 49,660 μs), respectively. From past work [6,7], we also know that the BTO values for the log-on request and log-on acknowledge are “anomalous” in that the raw values are outliers that require a correction. Fortunately, the required corrections are repeatable, and can be determined by analyzing prior flights.
Using the Inmarsat transaction logs for MH371 and MH370 [8], the BTO log-on statistics from March 7, 2014, 00:51:00, to March 8, 2014, 16:00:00, were analyzed to determine what offsets might be applied to log-on requests and log-on acknowledges. There were 29 cases in which there was an R-channel burst just after the initial (R600) log-on request and subsequent (R1200) log-on acknowledge. Of those 29 cases, the number of packets in the burst was 3 for 20 bursts, 2 for 6 bursts, and 1 for 3 bursts. The average of each burst was used as the reference for the log-in request and log-on acknowledge. In 4 of the 29 cases, the correction for the log-on request was near zero, i.e., the BTO values were not anomalous, so only 25 cases were included for log-on request statistics.
For the log-on requests, the mean offset from the R-channel burst is 4,578 μs with a standard deviation of 94 μs. The maximum offset was 4,800 μs (+222 μs from the mean) and the minimum was 4,380 μs (-198 μs from the mean).
For the log-on acknowledge, we considered a correction of the form (a + N × W), where a is a constant, N is an integer, and W represents the delay per slot. We found that the standard deviation of the correction error (using the average of the R1200 burst as the reference) to be minimized for W = 7812.0 μs. That’s very close to the 7812.5 μs value suggested by the 128 Hz internal clock of the SDU. By forcing W=7812.5 μs, the mean error to the correction is 23 μs, and the standard deviation is 30 μs. The observed standard deviation is very close to the 29 μs that DSTG recommends to use for “normal” R1200 values [7]. The consistency of the standard deviation of the corrected anomalous values with the standard deviation of the values not requiring a correction is reassuring. The total correction to the BTO for log-on acknowledges is therefore (23 + N × 7812.5) μs.
Using these log-on corrections produces corrected BTO values at 00:19 equal to:
We combine these values to determine the BE value of BTO by using the inverse of the variance as weighting, yielding a BE value of BTO = 18,390 μs (σ = 29 μs). Using this BE value of BTO with the longitude of E93.7875° and an assumed geometric altitude of 20,000 ft results in a position of S34.2342° E93.7875° at 00:19:29, which we assign as the LEP.
3 Terrain Near the LEP
Figure 1 shows the subsea terrain in the vicinity of the LEP using data provided by Geosciences Australia [5]. Some of this area has already been searched by GO Phoenix (managed by the ATSB) using a towfish, and by Ocean Infinity (OI) using Seabed Constructor and its team of AUVs. However, as can be seen in Figure 1, some of the previously searched area has challenging terrain with steep slopes, and the debris field may have been either not detected due to terrain avoidance or shadows, or detected but not properly interpreted by reviewers. In particular, there is a steep slope that lies about 20 NM due south of the LEP that was not scanned by the towfish and appears to have been only partially scanned by the AUVs.
Figure 1. Terrain in the vicinity of the LEP
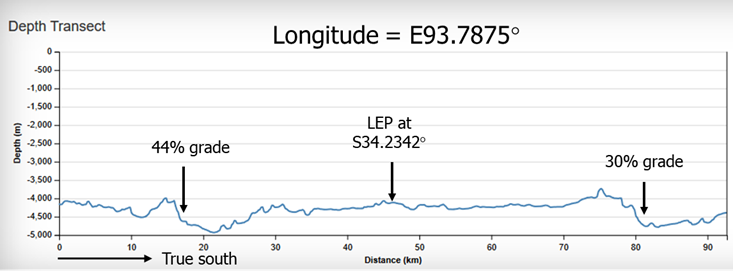
Figure 2 shows the ocean depth along a line of constant longitude in the vicinity of the LEP. The previously identified steep slope to the south of the LEP has a grade of about 30%. To the north, another slope has a grade of 44%. This slope was beyond the limits of the search boundaries of GO Phoenix, but was scanned by Seabed Constructor’s AUVs.
Figure 2. Ocean depth at constant longitude and +/- 46 km (+/- 25 NM) from the LEP
4 No Pilot Inputs after Fuel Exhaustion
In order to define the search area limits, we first consider no pilot inputs after fuel exhaustion. For this case, the search area limits are defined by the uncertainty of the LEP and the uncertainty of the uncontrolled flight path before impacting the ocean.
4.1 Uncertainty Due to BTO Noise
The uncertainty in the BTO produces a corresponding uncertainty in the position of the 7th arc. The calculated sensitivity of the arc position to the BTO is 0.104 NM/µs, i.e., a 1-µs increase in BTO pushes the 7th arc outward (southeast) by 0.104 NM. The 1-σ uncertainty of the arc position due to BTO noise is therefore 0.104 NM/µs × 29 µs = 3.0 NM.
4.2 Uncertainty Due to Altitude at 00:19:29
The LEP is based on an assumed altitude of 20,000 ft that is reached at 00:19:29, i.e., 1.5 to 2 minutes after fuel exhaustion. As the BTO represents the range between the aircraft and the satellite, the position of the 7th arc as projected on the surface of the earth depends on the altitude. As the aircraft would be between 0 and 40,000 ft at this time, we assign this altitude range as the 2-σ limits. The calculated sensitivity of the BTO to altitude is 12.8 µs/10,000 ft. The 1-σ uncertainty of the arc position due to altitude uncertainty is therefore 0.104 NM/µs × 12.8 µs = 1.33 NM.
4.3 Uncertainty of Turn Between Fuel Exhaustion and 00:19:29
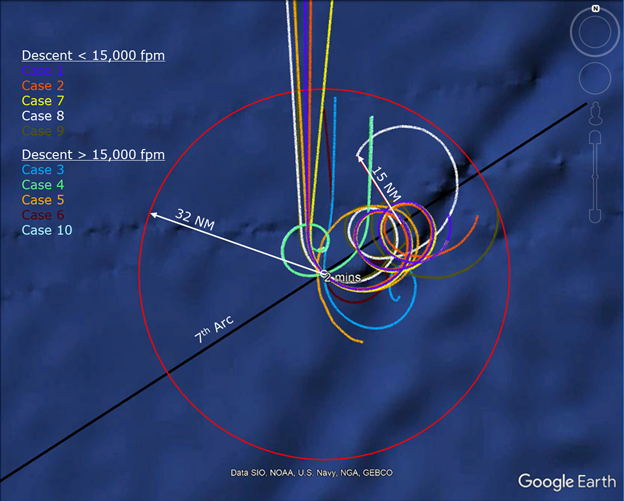
Boeing conducted 10 simulations to determine the behavior of MH370 after fuel exhaustion with no pilot inputs [9] using a high-fidelity simulator for the 777-200ER aircraft. The trajectories for these simulations are shown in Figure 3. For each simulation, the autopilot was automatically disengaged after fuel exhaustion, and the aircraft turned slightly either to the right or to the left depending on a number of factors, including the electrical configuration, the initial conditions of the flight parameters, and the meteorological conditions. Within the 2-minute interval between fuel exhaustion and the log-on request at 00:19:29, the slight turn shifted the location that the aircraft crossed the 7th arc relative to where it would have crossed the 7th arc if the autopilot had remained engaged and the course was maintained. For the 10 cases, the lateral shift along the arc varied between 1.1 and 8.8 NM. As we don’t know how well the 10 cases represented the actual conditions, we conservatively assign a 1-σ uncertainty of 8.8 NM along the 7th arc due to the slight turn between fuel exhaustion and crossing the 7th arc.
4.4 Uncertainty of Trajectory Between 00:19:29 and the POI
In all 10 of the Boeing simulations, the aircraft banked after the autopilot was disengaged following fuel exhaustion. The magnitude and direction of the bank that develops is the net effect of a many factors, including thrust asymmetry, rudder inputs from the Thrust Asymmetry Compensation (TAC), rudder trim input, lateral weight imbalance, aerodynamic asymmetry, and turbulence, any of which increases the bank angle. On the other hand, the tendency to bank is opposed by the dihedral effect of the wings and the low center-of-mass. For all the simulations, the POI was within 32 NM from the 7th arc crossing at 00:19:29, as shown in Figure 3.
Figure 3. Calculated end-of-flight trajectories from the Boeing simulations [9]
In some of those simulations, the bank was shallow, and phugoids lasting many minutes developed. In only 5 of the simulations did the rate of descent exceed 15,000 fpm while also experiencing a downward acceleration exceeding 0.67 g, which are the values of descent rate and downward acceleration derived from the two final values of the BFO. For these cases, the POI occurred between 4.7 and 7.9 NM from the point where the descent rate first exceeded 15,000 fpm. Other simulations of a banked descent after fuel exhaustion [10] suggest that an uncontrolled Boeing 777 would travel an additional distance of about 5 NM after a downward acceleration of 0.67 g and a rate of descent of 15,000 fpm simultaneously occur.
None of the Boeing simulations predict that the aircraft was in a steep descent as the 7th arc was crossed, so there is an unexplained discrepancy between the Boeing simulations and the descent rates derived from the final BFO values. In light of this discrepancy, we choose to not limit the distance traveled after crossing the 7th arc by only considering the distance traveled after the steep descent. Instead, we assign a 2-σ value of 32 NM for the distance traveled after crossing the 7th arc, based on the farthest distance that was observed in all 10 simulations, irrespective of the magnitude and timing of the descent rates.
4.5 Uncertainty Due to Navigation Error
There are two autopilot modes that could result in a trajectory that nominally follows a great circle between BEDAX and the South Pole. After passing BEDAX, if the autopilot remained in LNAV and the active waypoint was the South Pole (entered as 99SP, S90EXXXXX, or S90WXXXXX), the aircraft would fly along the longitude E93.7875° within the accuracy of the GPS-derived navigation. In this case, the expected navigational error would be much smaller than other sources of error, and can be safely ignored.
The other possibility is that after passing BEDAX, the autopilot was configured to fly along a constant true track (CTT) of 180°. Selecting this mode would require manually changing the heading reference switch from NORM to TRUE, as directions on maps, procedures, and in ATC communications are normally referenced to magnetic north, except in polar regions.
Unlike LNAV mode in which the cross-track error of the target path is continuously calculated and minimized, errors in track (which may be positive or negative) in CTT mode produce error in the due south path that may accumulate without correction. We assume here that that course is nominally 180° True, with a 1-σ uncertainty of 0.1 deg (0.001745 rad). As the distance between BEDAX and the 7th arc along the line of constant longitude is around 2365 NM, the cross-track error has a mean value of zero and a 1-s uncertainty of 4.1 NM. However, since the path crosses the 7th arc at an angle of 46 deg, the 1-σ uncertainty in position along the 7th arc is increased to 5.9 NM.
4.6 Search Area Based on No Pilot Inputs
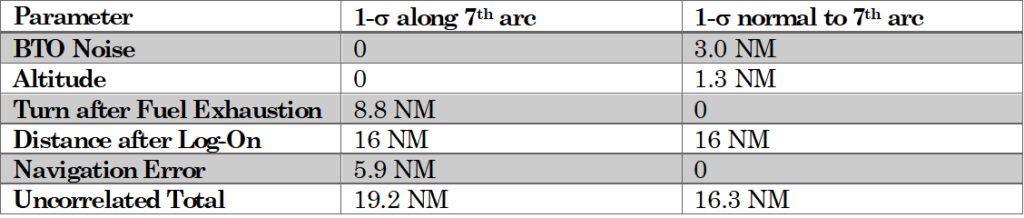
Assuming there were no pilot inputs after 19:41, the uncertainties in the POI are summarized in Table 1. The 1-σ uncertainty along the 7th arc is 19.2 NM, and 16.3 NM normal to the 7th arc.
Table 1. Summary of POI Uncertainties Assuming No Pilot Inputs
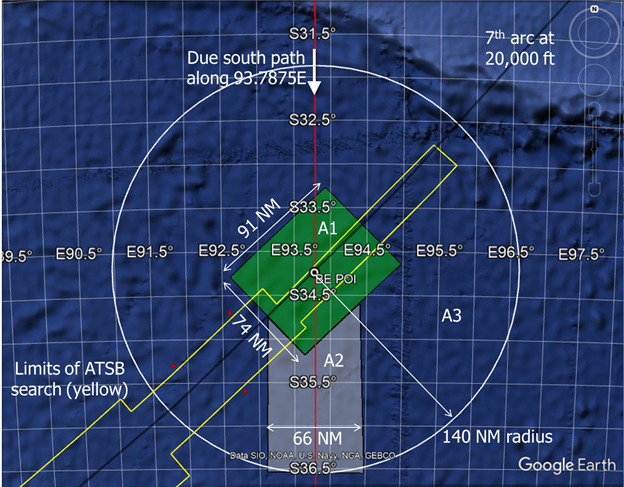
To achieve a confidence level of 98% requires searching an area defined by ±2.3-σ limits, with the LEP at its center. Based on this, the recommended area is 91 NM × 74 NM, and the total area is 6,719 NM2, or 23,050 km2. This area is depicted as A1 in Figure 4.
Figure 4. Search recommendation, showing areas A1, A2, and A3
5 Controlled Glide Due South
We next consider the case in which there was a controlled glide after fuel exhaustion, which would extend the search area beyond the search area based on no pilot inputs. For a Boeing 777 gliding at an optimum speed, a glide ratio of about 20:1 can be achieved. This corresponds to a descent angle of 2.86°, and a continuous reduction in altitude of 1000 ft for every 3.29 NM traversed. Assuming an initial altitude of 42,400 ft (based on a standard altitude of 40,000 ft), the impact could be as far as 140 NM from the point of fuel exhaustion (ignoring the headwind at some altitudes, which would reduce the ground distance of the glide). If the glide started at a lower altitude, or if non-optimum airspeed was flown, the glide distance would be less. The uncertainty associated with the glide distance is much larger than other uncertainties, so we assume that with a glide, the POI might have been as far as 140 NM from the LEP, and use that as the southern limit.
The width of the search area as defined by a controlled glide
is more difficult to estimate. If an experienced pilot wished to continue the
flight path on a due-south course, that could be accomplished quite precisely.
For example, if the autopilot mode was CTT before the fuel exhaustion, then a
constant (true) track of 180 deg could be maintained using the indicated track
shown in the navigation display. On the other hand, if the autopilot mode was
LNAV before fuel exhaustion, then the cross-track error could be minimized by
following the “magenta” line defined by the BEDAX-South Pole leg. In either
case, the search area width could be limited to less than 10 NM to either side
of the projected flight path.
Because we cannot be sure that there was an attempt to
precisely follow a due south path, we assign a generous width to this part of
the search area, centered on the due south path. A width of +/- 33 NM results
in an additional search area of 6,300 NM2 (22,000 km2), and
produces an area in similar size to A1. It is depicted as A2 in Figure 4.
6 Controlled Glide in an Arbitrary Direction
If there was a controlled glide that did not continue along the path flown prior to fuel exhaustion, it is nearly impossible to predict the direction. For instance, a path to the west would shield the pilot’s eyes from the rising sun to the east. A path to the northeast would extend the glide due to the tailwind. A path to the west would create more distance to the Australian shoreline. A path towards the northwest would be towards Mecca. Any of these directions is less likely than a continuation of the due south path, but it becomes nearly impossible to prioritize among these or other directions. Instead, we define area A3 as the circle with a radius of 140 NM, excluding the areas already included in A1 and A2. The area is roughly 48,400 NM2 (166,000 km2), and is depicted as A3 in Figure 4.
7 Conclusions
Recent analyses suggest that MH370’s flight path in its final hours followed E93.7875° longitude, corresponding to a great circle path between waypoint BEDAX and the South Pole. Using this result, the last estimated position (LEP) is S34.2342° E93.7875°. Although some of the subsea was previously searched in this vicinity, the terrain is challenging, and the debris field might have been not detected, or detected and misinterpreted. There is also the possibility that there was a controlled glide after fuel exhaustion, and an impact well beyond what was previously searched.
To define the search area near the LEP, three cases were considered, each with an associated search area. The highest priority search area of 6,719 NM2 (23,050 km2) assumes there were no pilot inputs after fuel exhaustion. The search area of next highest priority encompasses 6,300 NM2 (22,000 km2), and assumes there was a glide towards the south after fuel exhaustion. The lowest priority is the controlled glide in an arbitrary direction with an area of around 48,400 NM2 (166,000 km2).
[6] Ashton, Shuster-Bruce, College, Dickinson, “The Search
for MH370”, The Journal of Navigation, Vol 68 (1), January 2015.
[7] Davey, Gordon, Holland, Rutten, Williams, “Bayesian
Methods in the Search for MH370”, Defense, Science, and Technology Group,
Australia, November 30, 2015.
The best estimate of the point of impact (BE POI) has been renamed the last estimated position (LEP), which is a more accurate description. The location is unchanged.
This is the second in a series of articles that is dedicated to defining a new area for the underwater search of MH370. In the previous article, we presented Bobby Ulich’s overview of a new statistical criteria that supplements the criteria that many investigators have used in the past for evaluating candidate flight paths. In the present article, we present an overview of an exhaustive study principally undertaken by Richard Godfrey, with contributions by Bobby Ulich and me, to examine flight paths with the assumption that after 19:41, the flight was automated and with no pilot inputs. The results indicate that a flight crossing the 7th arc near 34.4S latitude merits a deeper investigation, which will be the subject of the next (third) paper.
What follows are excerpts from “Blowin’ in the Wind”, by Richard Godfrey et al. For more details, please consult the full paper.
Introduction
Following on from Richard Godfrey’s earlier paper entitled “How to play Russian Roulette and Win” published on 13th February 2019, which covered the first part of the flight and diversion of MH370 into the Straits of Malacca, Richard was contacted by Bobby Ulich, who asked the question “where do we go from here?” Richard Godfrey, Bobby Ulich and Victor Iannello came up with the idea to scan the Southern Indian Ocean (SIO) for possible flight paths of MH370 using a degree of precision that we believe has not been previously applied, and to use certain statistical checks on the presence or absence of correlations in the data. Each of us had independently developed a MH370 flight model using the Boeing 777-200ER aircraft performance data, Rolls Royce Trent 892 fuel range and endurance data, Inmarsat satellite data and the GDAS weather data. The goal was to find all possible MH370 flight routes that fit the data within appropriate tolerances. Additionally, the data would be checked using a set of correlations.
Method
Our assumptions about the automated flight after 19:41 are that there are 7 parameters that determine a possible MH370 flight path:
Start Time
Start Latitude
Start Longitude
Flight Level
Lateral Navigation Method
Initial Bearing
Speed Control Mode
If you draw an arbitrary line of latitude between the area of the last known point and the SIO, MH370 must have crossed this line at a certain time, longitude, flight level and initial bearing using a particular lateral navigation method and speed control mode.
Having fixed the start latitude, the start time and start longitude can be varied for any given flight level, lateral navigation mode, initial bearing and speed control mode, and the fit to the aircraft performance data, satellite data and weather data ascertained. The flight model used in the wide area scan was developed by Richard Godfrey. First the altitude and air pressure at the selected flight level is determined. The GDAS weather data provides the actual surface air pressure and surface air temperature for a given position and time by interpolation. The air pressure for a given flight level is calculated based on the ISA standard surface pressure of 1013.25 hPa and standard surface temperature of 15.0°C. The geometric altitude for a given flight level is then approximated using the actual surface pressure and actual surface temperature. The altitude is used in the satellite data calculations, assuming the flight level is maintained between 19:41:03 UTC and 00:11:00 UTC. Similarly, the GDAS weather data is interpolated for the exact latitude, longitude and time to find the Outside Air Temperature (OAT) and wind at the given flight level.
The scan method for each Lateral Navigation Method (LNAV, CTT, CTH, CMT and CMH) and for each Speed Control Mode (Constant Mach and Long Range Cruise) requires stepping through each possible Initial Bearing (initially from 155°T to 195°T) in steps of 1°T. In Constant Mach (CM) the value was set initially at 0.85 and decremented in steps of 0.01 Mach.
[Note: LNAV = Lateral navigation (following waypoints connected by geodesics); CTT = Constant true track; CTH = Constant true heading; CMT = Constant magnetic track; CMH = Constant magnetic heading]
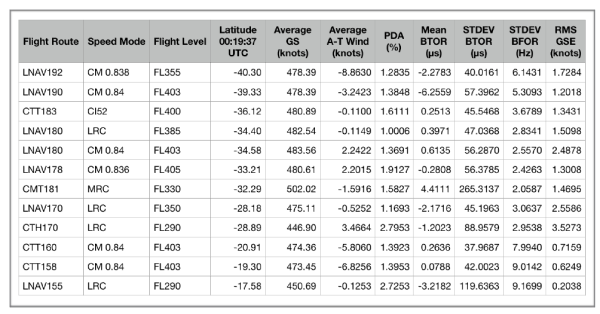
Once the Initial Bearing and (if relevant) the Mach has been set, the Start Time or Start Latitude is adjusted to minimise the RMS BTO Residual (BTOR) across the 5 satellite handshake points between 19:41:03 UTC and 00:11:00 UTC. The BTOR is the difference between the predicted BTO and the observed BTO. Then the Start Longitude is varied to minimise the RMS BTOR. Finally the Flight Level is adjusted in steps of 1 (standard altitude steps of 100 feet) to minimise the RMS BTOR. A full report is then produced for each scan. (The definition of GSE is found later in the paper, and the significance of the correlation coefficients is based on the work of Bobby Ulich and will be presented in a future paper.)
A number of MH370 candidate flight paths have been found over the years by various analysts resulting in Regions of Interest (ROIs) that have either already been searched or have been proposed for a further search. The table below lists some of the ROIs. The table includes some new ROIs which have been found as a result of the current systematic search. Some of the ROIs can be readily dismissed as the standard deviation BTO residual (<47 μs), standard deviation BFO residual (<4.3 Hz) or the calculated PDA (<1.5%) is too high.
Possible MH370 flight paths resulting in a candidate Region of Interest (ROI)
Systematic initial bearings from 155°T to 195°T in steps of 1°T were analysed, plus some exotic cases in steps of 0.1°T. All navigation methods were covered: LNAV, CTT, CTH, CMT and CMH, all speed modes: Constant Mach 0.80 to 0.85, LRC 0.7047 to 0.8408, MRC, ECON CI52 and all flight levels: from FL290 to FL430. The fuel endurance was allowed to vary around 00:17:30 UTC and the resulting PDA was noted. The PDA was allowed to vary from the nominal 1.5% and the possibility that the bleed air was shut off for part or all of the time was considered.
In total 1,372 flight paths have been analysed, of which 828 flight paths since the start of this systematic study on 17th February 2019. Start latitudes from 16.0°N to 4.3°S have been covered and the start longitudes were unconstrained. Start times from 18:41:00 UTC to 19:32:00 UTC, but the final major turn had to be completed before the 2nd Arc at 19:41:03 UTC was reached.
Discussion
A more detailed analysis reveals 3 candidate ROIs for further investigation: ROI 1 – LNAV180 CM 0.84 FL403, ROI 2 – LNAV 170 LRC FL350 and ROI3 – CTH170 LRC FL290.
From a pilot’s point of view, a LNAV path on a bearing of 180°T would require setting a final waypoint as the South Pole. This flight path passes close to waypoint BEDAX. The overall fuel endurance and range fits and for a Main Engine Fuel Exhaustion (MEFE) at 00:17:30 UTC, a PDA of 1.37% is calculated (the nominal PDA is 1.5%). The RMS GSE is 2.49, which fits the expected range between 1.0 and 3.0 knots. This flight path ends at 00:19:37 UTC at around 34.5°S near the 7th Arc. This area was originally searched by Go Phoenix but all possible sightings were reexamined and discounted. The search area was widened in later search by Ocean Infinity, but again nothing was found.
An LNAV path on an initial bearing of 170°T starts close to Car Nicobar Airport (VOCX) and passes close to Cocos Island before ending at 00:19:37 UTC at around 28.9°S near the 7th Arc. The overall fuel endurance and range fits and for a MEFE at 00:17:30 UTC, with a calculated PDA of 1.17%. Notably, the Mean BFOR for this flight path is low at -6.87 Hz and is out of the expected range. The area around 28.9°S was searched by Ocean Infinity, but nothing was found.
The CTH path on an initial bearing of 170°T is unlikely as the fuel endurance and range does not fit well. The RMS BTOR is high at 79.6 μs and individual BTOR values are out of normal range. It is also unlikely that a pilot would switch to a True Heading mode. Normal operation is Magnetic Track and this mode is only used for short flight paths, such as during an approach or deviating to avoid bad weather. Switching from Magnetic to True compass mode is only normally done in the region of the north or south poles.
Candidate ROIs for further investigation. (Click on image to enlarge.)
Conclusion
All possible MH370 end points of flight routes in any navigation mode and any speed mode have already been searched, within at least ± 25 NM of the 7th Arc (partially ± 40 NM). This means that MH370 has either been missed in a previous search or recovered from a steep descent of around 15,000 fpm and glided out to an end point outside the previously searched area.
There is only one Region of Interest, where we recommended a further analysis and search at around 34.4 °S near the 7th Arc, following a flight route from close to waypoint BEDAX using the LNAV lateral navigation mode with an ultimate waypoint of the South Pole on a track of 180°T due south, in Long Range Cruise speed mode and at a flight level between FL390 and FL403.
This Region of Interest will be analysed in more depth in the next paper in this series.
The community of independent researchers is divided about where a new underwater search should be conducted. In this light, Bobby Ulich, PhD, has been quietly developing new statistical criteria that supplement the criteria that many of us have used in the past. The objective of this research is to define a new search area that is of manageable size and has a reasonable chance of success. Bobby has been working closely with Richard Godfrey to identify candidate paths, and with me to a lesser extent. At this point, the most promising candidate is a path of constant longitude, i.e., following a constant track of due south, aligned with waypoint BEDAX, and crossing the 7th arc near 34.3S latitude. This path, which was identified as a candidate path some years ago, could have been easily programmed into the flight computers with the waypoints BEDAX and the South Pole (e.g., by entering the waypoint S90E000). Work continues to evaluate this and other paths.
The note below from Bobby gives an overview of the new methodology, and is provided here to elicit comments from contributors of the blog.
Note from Bobby Ulich, PhD
There are two pieces of available MH370 information that have not yet been fully utilized in predicting the southern route and the most likely impact latitude near the 7th Arc. Neither one was included in the DSTG Bayesian analysis.
The first item is the inclusion of a detailed and accurate fuel flow model. All DSTG analyses effectively ignored fuel consumption as a route discriminator by assuming “infinite fuel”. I and several others subsequently developed fuel flow models and compared them with Boeing tables, prior 9M-MRO flights, and the MH370 flight plan in order to validate the predictions. My model fuel flows are consistent with these comparisons, nearly always within +/- 1 %. As I understand it, Boeing did some range and endurance calculations and found that it was possible, at some combination of altitude and speed, for 9M-MRO to have reached a wide stretch of the 7th Arc, totally excluding only the region beyond circa 39S. However, the DSTG analyses did not factor in fuel consumption for each route they examined, so it is unknown whether or not that route was actually flyable with the available fuel. This is an important consideration, especially considering the fact that over a large portion of the SIO region of interest, the high-altitude air temperatures on the night in question varied by as much as 12 C with respect to ISA over an altitude range of only about 5,000 feet. Thus, small altitude changes had major effects on TAS and on fuel flow.
In my route fitter, one can either predict the main engines fuel exhaustion (MEFE) time using the known average cruise PDA for the engines, or hold the MEFE time at 00:17:30 (per ATSB) by adjusting the assumed PDA. I generally do the latter because that gives the correct weight as a function of time, which affects the commanded airspeed. It is also important to allow for the possibility that bleed air was turned off after diversion, reducing fuel flow by several percent. So, in fact the effective PDA which would give the correct endurance is potentially a range of values between 1.5% (the known value with bleed air on) and about -0.8% (the equivalent of bleed air off for the entire flight after diversion). Best-fit PDAs higher than +1.5% and lower than -0.8% are increasingly less likely.
Inmarsat and DSTG have provided some analyses of the BTO and BFO reading errors based on prior flights. Generally speaking, up to now, the statistics associated with those reading errors are the mean and the standard deviation. In many cases the RMS statistic has also been used as a convenience when performing route model fits to the satellite data, but the fundamental statistics are the mean and standard deviation of the BTO/BFO reading errors. In the case of the BFOs, we cannot know that the mean reading error (effectively the BFO bias term) did not change as a result of the in-flight power cycle ending circa 18:24. Therefore, we really only have three of these four statistics available for route fitting – the BTO residual mean, the BTO residual standard deviation, and the BFO residual standard deviation.
Regarding the standard deviation of the BFO reading errors, there has been much discussion in the past regarding the seemingly inconsistent criteria used by Inmarsat and by DSTG. I have been modeling the BFO reading errors comprising (1) random electronic noise, (2) non-ergodic and non-stationary OCXO drift, (3) trigonometric quantization errors in the AES Doppler compensation code that give the appearance of being quasi-random for readings widely spaced in time, and (4) vertical speed errors of roughly 40 fpm or higher from the nominal vertical speed profile (caused primarily by turbulence). I have developed a simple statistical model for the BFO reading noise, and this model gives results which are consistent with both sets of criteria. This new BFO reading noise model is what I use in my current route fitter.
The second item of previously unused information is also significant in discriminating against incorrect routes. That item is the fact that the BTO and BFO reading errors are uncorrelated with themselves and with each other, and, in effect, with most route-fitting parameters (with possibly one exception). Note that it is the reading errors which are uncorrelated, not the actual expected values for BTO/BFO. The degree of correlation of pairs of parameters is quantified using the Pearson correlation coefficient, and these values may be used as additional statistical metrics of the goodness of fit for the True Route. The one exception that could have occurred is for the BFO reading errors, which could change linearly with time due to OCXO drift. So, we must use that one correlation case (BFO residuals with respect to time) cautiously, knowing that it is possible such a drift might have occurred, although we do not see obvious cases of large linear drifts in previous flights. It seems possible that a very cold cycling of the OCXO might produce a shift in the bias frequency, but it is not apparent that such a cycling would be more likely to produce greater linear drift of the bias frequency well after warm-up. Small drifts of several Hz during a single flight are seen on prior flights, and it would not be surprising if they occurred in MH370 after 19:41.
We can substantially increase the number of statistical metrics that must be satisfied by a fit using the True Route by adding numerous correlation coefficients to the previously used means and standard deviations of the BTO and BFO residuals. Using more metrics (~10-12 total) provides greater selectivity in route fitting and better discrimination against incorrect routes.
A requirement for effectively utilizing these additional correlation metrics is the development of a method which allows us to obtain best-fit BTO/BFO residuals which behave statistically the same as the BTO/BFO reading errors. Those two parameters, the best-fit residuals and the reading errors, are generally not the same quantity. They are the same only when the model used to predict the aircraft location in 4-D (with 7 assumed route parameters) is perfect. No 4-D aircraft prediction model is perfect, especially in light of the expected errors in the GDAS temperature and wind data (which must be interpolated in 4-D for calculations along the route). At best, there will be small (a few NM) systematic errors in the model predicted position at the handshake times. The along-track and cross-track components of the position errors are systematic and must be allowed for in order to compare the expected BTO/BFO reading errors with the best-fit BTO/BFO residuals. If this is not done, then accurate correspondence with statistical metrics is impossible. In other words, just getting a fit consistent with the expected mean and standard deviation is not very discriminating because it ignores the even larger number of statistical metrics which the True Route must also satisfy. The question is, how can we remove the systematic errors in the handshake location predictions of the flight model (using GDAS data) so that the best-fit residuals are essentially just the reading errors?
I have found that this is indeed possible if the systematic prediction errors are small. Basically, the procedure is to fit lat/lon positions at the handshake times. I use only the five handshake points from 19:41-00:11. These data can be well-fitted with a single set of seven route parameters with no maneuvers, and this eliminates the need to make any assumptions about the FMT except that it occurred prior to 19:41. The MH370 data recorded by Inmarsat between 19:41 and 00:11 UTC on 7-8 March 2014 is entirely consistent with a path during that period, while southbound and heading into the Southern Indian Ocean, without major maneuvers such as turns or holds or major speed changes. With the assumption of a preset route during this period using the auto-pilot, solutions may be found consistent with the BTO and BFO data, comprising 5 sets of BTOs and BFOs at 5 known handshake times. The 23:14 phone call BFOs are not used because there is no
independent determination of that channel’s frequency bias (offset).
Once I have the five fitted locations, I compare them to the model-predicted locations to generate a set of five along-track position errors and five cross-track position errors. Then I find the ground speed errors for each route leg that produce the along-track position errors. I also find the lateral navigation errors that would produce the cross-track position errors. Note that the cross-track position errors do not occur for LNAV (great circle) routes, but only for constant track and constant heading routes. The ground speed errors are caused by airspeed errors and by GDAS along-track wind errors. The airspeed errors are small (probably 1 kt or less) and are caused primarily by errors in the GDAS temperature data. The along-track wind error is probably at least several kts at any given location and time. However, we only need the average wind error for each ~1-hour long leg along the route, and these leg average errors will generally be smaller. I estimate that the overall along-track ground speed error using my model is about 1-2 kts. That means that we must constrain the fit so that the difference between the model-predicted location and the best-fit location (in the along-track direction) is equivalent to a maximum ground speed error less than about 1-2 kts. I also expect the ground speed errors to vary smoothly with time and location. So, I put constraints on the GSEs in terms of peak value and smoothness during the route fitting process.
For the constant track and constant heading navigation modes, the cross-track position errors are caused by a combination of cross-track GDAS wind errors and FMC lateral navigation bearing errors. The lateral navigation errors are largely undocumented publicly, but I expect them to be a small fraction of a degree for the constant track modes. The lateral navigation errors in the constant heading modes are caused primarily by errors in the predicted cross-track winds, and they will be larger than the lateral navigation errors in the constant track modes. In LNAV there are no cross-track position errors.
One benefit of this route fitting method is that it requires a very good, but not a perfect model. It must predict the locations, based on the 7 route parameters and the GDAS 4-D wind and temperature data, with an accuracy of about 5-10 NM. This is a significantly larger region than the location uncertainty (in one dimension) due to BTO reading noise. Still, one can estimate the true locations with the full precision of the satellite data following the route fitting method described above, using the statistical metrics to separate the truly random portion of the residuals from the systematic, non-random model/GDAS errors. When the synthesized locations are the True Route, the best-fit residuals will behave statistically identically with the BTO/BFO reading errors.
It is also possible to compute a single figure of merit for a given fit based on the 10-12 metrics described above. I use Fisher’s chi-squared combination calculation that finds a single percentile value that is most consistent with the percentile values for each of the independent statistics being combined. The percentile values represent the percentage of random trials which are no better than this fit result, assuming the null hypothesis. In the MH370 case the null hypothesis is the same for each statistic – that the fitted route is the True Route. The alternative hypothesis is that the route is not True for at least one of the statistics. The expected value of all individual and combined percentiles is 50%; that is, half of the random trials will fit better, and half will fit worse. We can use no other assumption than the route is True, because we have no idea what the values of the metrics should be when the route is not True. We only know their expected values (and their standard deviations) for the case when the route is True. Thus, we expect the True Route will have an expected Fisher combined percentile value of 50% (with a standard deviation of 29%). Non-True (i.e., incorrect) routes will have Fisher percentile values significantly less than 50%. This is how incorrect routes are discriminated. The route fitter objective function maximizes the Fisher percentile, so each trial is trying to match the expected values of the statistics for the True Route.
Two related activities have been carried out to validate the percentile calculations. First, a simulated processor was coded which generated random BTO and BFO reading errors. Then all the individual statistics and their percentile values were computed. Finally, the combined Fisher percentile was computed. Using 100,000 trials, the actual percentile values were found to be within 1% of their nominal values for all the individual and combined statistics. In order to achieve this result, the statistics were segregated into four classes, each with is own Z statistic and probability density function. The second validation experiment involved injecting random BTO and BFO reading errors into the route fitter program itself and verifying the correct combined percentiles were obtained.
It will be appreciated that this statistical fitting method, with a dozen or so metrics and with synthesized handshake locations, involves considerable computational time, so it is not ideal for identifying Regions of Interest (ROI). The previous generation of route fitters using just BTO/BFO metrics is much more efficient for evaluating the very large number of combinations of route parameters in order to identify all ROI, which may then be refined and evaluated using the statistical fitting method for assessment and comparison.
So far, after a lengthy systematic search, we have identified quite a few ROI, and these are being evaluated with the new statistical method. I have already demonstrated that one route in particular (LNAV at 180 degrees true bearing through BEDAX at LRC and at FL390, ending near 34.3S) is fully consistent with the True Route using the statistical method. At the present time, numerous other ROI are being evaluated and compared. Preliminary results to date show them to be inferior fits, but this work is not yet completed.
The goal of this work was to develop a means to better discriminate among routes by using additional metrics, including PDA and numerous correlation coefficients, and to compensate for systematic errors in model-predicted locations so that the best-fit residuals may be directly compared with the known BTO/BFO reading errors. Our initial results are promising. It may actually be possible to demonstrate that there is only one route solution which is fully consistent with the satellite data. More complete and detailed information will be provided once our assessments are finished.
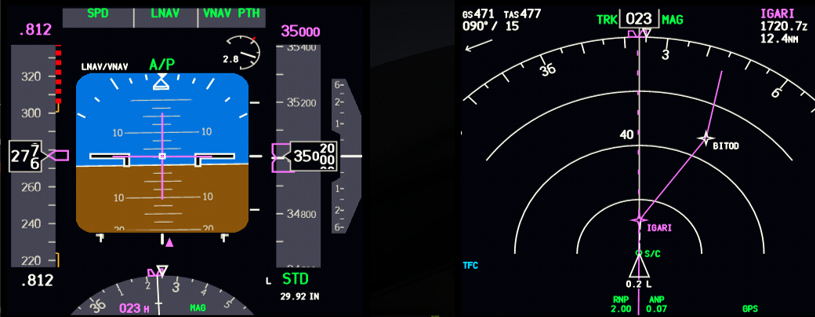
More precise tracking data has recently become available that gives new insights about how MH370 was flown just before the transponder was disabled near the waypoint IGARI. The data was broadcast by the aircraft and received by a Malaysian ATC receiver at Terengganu. It is similar to the data that has been previously available from the aircraft tracking site FlightRadar24, except that the spacing between data points is shorter, and the data are the raw values that were actually broadcast by the aircraft. As a result, more details about the flight can be extracted.
The new tracking data was transmitted by the aircraft’s Automatic Dependent Surveillance – Broadcast (ADS-B) system, which broadcasts the GPS-derived position and altitude, as well as other parameters, as often as about every one-half of a second. Because of the inherent accuracy of GPS, the ADS-B position is more accurate than the traditional radar systems, which derive the position from the timing and angular direction of received signals from the aircraft using a rotating antenna.
A file containing the ADS-B data for MH370 is available here.
Path Near IGARI
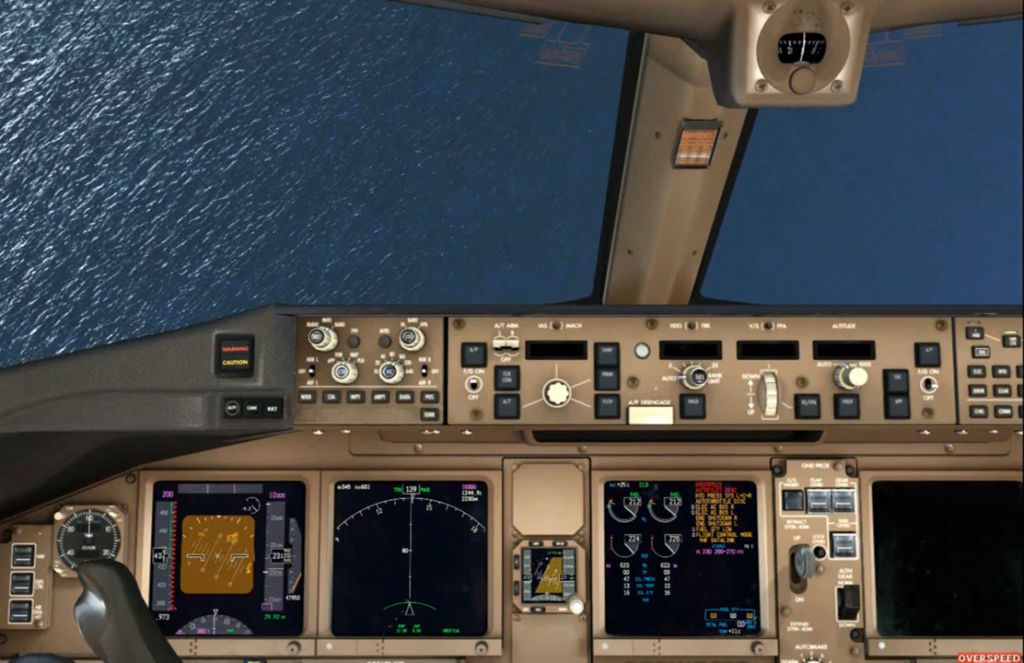
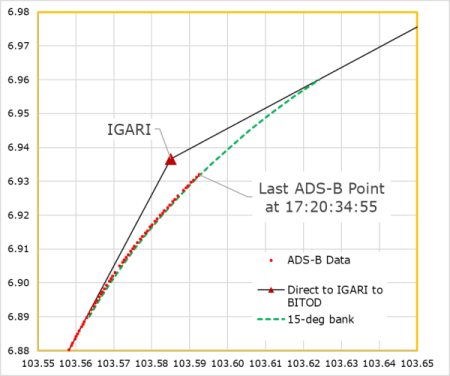
The figure below shows that the aircraft was on a track to pass over waypoint IGARI. However, before reaching IGARI, the aircraft began to turn towards waypoint BITOD. The radius of the turn indicates that the bank angle was around 15°. The start of the turn before reaching the waypoint and the bank angle are both consistent with the aircraft following an automated route in “LNAV” mode in which the flight computers were programmed to fly “direct” to IGARI and then to BITOD. (IGARI is a compulsory “flyby” waypoint.) This suggests that at the time the transponder was disabled after 17:20:34.55, the autopilot was still engaged and the aircraft was flying in accordance with the flight plan. (The Safety Investigation Report states that the Mode S symbol dropped off the radar display at 17:20:36, which is close in timing to the last ADS-B point.) This is evidence that the deviation from the flight plan occurred after the transponder was disabled.
Comparison with Military Radar Data
The radar data that we have after the transponder was disabled consists of “primary surveillance radar” (PSR) data from civilian and military sources. Although the civilian radar data sets from the Kota Bharu and Butterworth radar sites have become available through unofficial channels, the range of the civilian primary radar sites is much less than the military primary radar sites, so that after the transponder was disabled near IGARI, only military radar captured the turnback to Malaysia. (The range of the Kota Bharu ATC radar is nominally 60 NM. IGARI is about 90 NM from Kota Bharu, and therefore not visible to the Kota Bharu ATC radar.)
Unfortunately, after many requests, the raw military data of MH370 has never been released by the Malaysian authorities. What we do have are low resolution images from official reports that depict the path of the aircraft. We also have filtered speed and track data that has been digitized from graphical data presented in a report from Australian authorities. Neither of these data sets provides the level of resolution and accuracy that would allow us to independently study the details of the path after passing IGARI, including the details of the turnback.
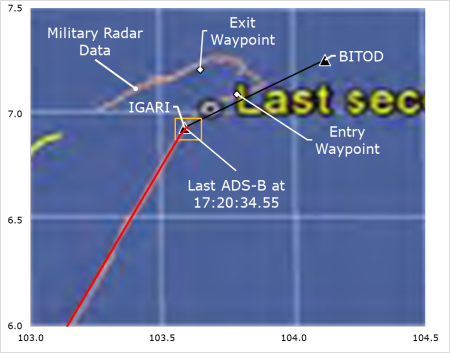
The figure below shows the military radar data (fuzzy yellow line) that was officially released in a low-resolution image, and enlarged here to show the path near IGARI. In the image, the bulls-eye was labeled “Last secondary radar data 1722”. For reference, the waypoints IGARI and BITOD were added to the image, as well as the ADS-B data (red) and the IGARI-BITOD route leg (black). The box (orange) around IGARI represents the much smaller area shown in the previous image.
There are some obvious discrepancies between the military data shown above and the ADS-B data shown in the previous figure. For one, the military data shows the turn towards BITOD starting after passing over IGARI. This “flyover” of IGARI is not consistent with how an aircraft following an automated path during the cruise part of the flight would turn between waypoints. If this path was actually flown, it would suggest that the navigational mode was not LNAV near IGARI.
The location of the last ATC radar point (the bulls-eye) is also different in this image from what the ADS-B data suggests. The ADS-B data shows that the transponder was disabled when MH370 was abeam IGARI. However, the image above shows the last ATC radar point occurring after the turn towards BITOD was completed. This could be because what is shown was extrapolated from the final transponder reply in what is referred to as “coasting”.
The military data also shows an impossibly sharp turn to the left occurred. Despite numerous requests, Malaysian officials have never provided an explanation for the false depiction of this turn.
These discrepancies indicate that the military data near the turnback should be used with caution. It’s possible that the radar installation that captured the turnback was Western Hill on Penang Island, and the turnback was near the maximum range of the radar site. (IGARI is about 220 NM from Western Hill.) If so, the inaccuracies might be from limitations of the military radar coverage this area. As such, the path depicted in the image may have been extrapolated from missing or inaccurate data, and should be assigned an appropriate level of uncertainty.
Finally, shown in the figure are the “entry and exit waypoints” of the turn that were supplied by the military and used by Malaysian safety investigators to study how the aircraft was flown after IGARI. As described in the Safety Investigation Report, simulations performed by the Malaysian investigative team matched the timing and position of the entry and exit waypoints of the turn only when the aircraft was manually flown with a steep bank angle of around 35°. However, considering the suspected inaccuracies in the military data, the conclusion that the turnback was manually flown should be re-visited. For instance, if the turn was begun prior to the entry waypoint, it would be possible to reach the exit waypoint at the proper time with a bank angle of 25°, which is a selectable bank angle when either of the autopilot modes “Heading Select” or “Track Select” is chosen.
Timing of Events Near IGARI
According to the Safety Investigation Report, the final radio transmission from MH370 occurred at 17:19:30. The following list shows the timing of this event along with the timing of the last three ADS-B points:
17:19:30 Last radio transmission (“Good night Malaysian Three Seven Zero”) 17:20:33.61 Last ADS-B point with altitude reported 17:20:34.15 First ADS-B point with no altitude reported 17:20:34.55 Last ADS-B point, no altitude reported
In a Boeing 777, the transponder may be disabled in the cockpit with a mode selector switch located on the pedestal between the left and right seats. The selector switch for the transponder, shown below with the label (1), would be set to standby (STBY):
During the time that the transponder was operating with altitudes reported, it was either in the switch position designated “TA/RA” for full functionality, or “TA ONLY” to suppress Resolution Alerts, or “ALT ON” to suppress both Traffic and Resolution Advisories. (TAs and RAs are part of the aircraft’s traffic collision avoidance system.) In order to select STBY from one of these three positions, it’s required to pass the intermediary position labeled “ALT OFF”. In this position, the transponder is replying to interrogations and is transmitting ADS-B data. However, there is no altitude data included in the replies and broadcasts.
Looking
at the final ADS-B messages, we see that the altitude is missing for the last
two messages, spanning a time of less than one-half of a second. This could
mean that the intermediate switch position ALT OFF was captured as the selector
switch was rotated to the standby position.
The time interval between the last radio transmission from the crew and the first message with no altitude reporting is 64 seconds. If the diversion from the flight path was caused by a third party forcing their way into the cockpit and taking control, those events would have to have occurred in 64 seconds or less. It is very unlikely that this could have been achieved by a third party in such a short amount of time.
Summary
New tracking data that has only recently become available gives us new insights as to how MH370 was flown before it disappeared from ATC radar:
At the time the transponder was disabled near IGARI, the ADS-B data shows a path that is consistent with normal automated flight in LNAV mode following a programmed route from IGARI to BITOD.
Discrepancies near IGARI between the ADS-B data and the military radar data suggest that the radar data has inaccuracies possibly because of the range limits of the radar installation on Western Hill on Penang Island.
The Malaysian investigators’ conclusion that the turnback after IGARI was manually flown should be re-visited in light of the demonstrated limited accuracy of the military radar data near IGARI.
The final ADS-B points may have captured an intermediate switch position as the transponder’s selector switch was rotated towards the standby position.
After the last radio transmission from MH370, the maximum time available to disable the transponder and divert the aircraft was 64 seconds. That leaves an impractically small amount of time for a third party to enter the cockpit and take control.
We now have better ADS-B data for understanding how MH370 was flown up to the point that the transponder was disabled at 17:20:35. This complements the primary radar data from Kota Bharu that starts at 17:30:33. However, we are still missing the military radar data that would cover the 10-minute gap between these two data sets. That gap includes the left turn at the start of the diversion that put MH370 on a course back over Malaysia.
It is important for Malaysia to release this closely-held military radar data so that other investigators that are working to solve this mystery can perform independent analyses of how the aircraft was flown during the turn back to Malaysia. Whatever strategic reasons there might have originally been for withholding the military data are no longer relevant more than 5 years after the disappearance.
Fellow IG members Mike Exner and Don Thompson have provided valuable comments to this article.
Narendran (Naren) KS, who lost his wife Chandrika on MH370, on Twitter says: Yes, give us the truth. Not too many people we know are convinced that 459 pages of the 2018 report is the sum total of all that is known regarding the disappearance of MH370. The following note accompanies his Tweet.
Friends,
My family and friends in India send you their greetings.
Unlike previous years, I have been ambivalent about making this trip. I have searched hard to understand this. It is almost 5 years since I saw off my wife, Chandrika, and the last we heard from Malaysia Airlines flight MH370, the flight she boarded en route to Mongolia.
It has been a long haul dealing with loss and rebuilding a life, a task that remains incomplete. What became clear is that lately the cloud of sorrow and despair, the listlessness with life in general, and the restlessness with the MH370 search and investigation has become less intense.
What remains is the solidarity with the MH families, their loss and struggles to cope, to envision a future and reconstruct their lives. This only grows as each nuance in a shared language of loss, grief and reconstruction becomes more widely shared and understood.
5 years is a long time.
Among the MH families, the old have grown older. Some whose will to live was broken by irreconcilable loss believe they have nothing left to live for.
Among the young, some have by now moved on to pursue studies, take up jobs, moved home, find partners, have babies, … Somethings to cheer about and remind ourselves that winter is not the only season, each day isn’t always drab, and the sky isn’t only grey.
However, many among us continue to struggle while applying ourselves to the chores of daily existence. For all of us, knowing what happened to MH370 remains the key to unlock a part of our lives, our energies.
Our prayers have remained unchanged: Find the plane. Find the passengers. Give us answers to ‘what’, ‘why’, ‘how’ and if it comes to it, ‘who’.
Give us the truth.
Yes, give us the truth. Not too many people we know are convinced that 459 pages of the 2018 report is the sum total of all that is known regarding the disappearance of MH370. Those who know more but have chosen silence, if indeed there are some, will eventually die a thousand deaths each day, for guilt is a latecomer but an unforgiving squatter. It is the order of things and not what we would wish for them.
In this search for the truth, there isn’t a Malaysian truth, an Australian truth, a British truth or an American one. Or (even) an Indian and a Chinese one. There were 239 passengers from 14 countries. An international mix of nationalities. A Boeing 777, an American company’s product. The incident is believed to have occurred in the Indian Ocean, in international waters. The investigation is governed by the conventions written in by the International Civil Aviation Organization. Experts from across the world when consulted or otherwise, have weighed in with their analysis and recommendations regarding the search. It is an event that concerns, every airline, every passenger and perhaps almost every family across the world exposed to civil aviation.
To suggest as some do that it should be left to Malaysians to script the story and the end game does not cut ice. If anything, the fact that it was a Malaysian airline’s flight under Malaysian air traffic control and Malaysia’s leadership of the investigation places an unshakable burden of responsibility to the world at large….to persist, to mobilize the funds necessary, and to hunt for the credible evidence for further search that it never tires of reminding us as being a requirement. It also has responsibility to test the claims of those who proclaim new knowledge, new evidence and fresh coordinates, and offer a public, transparent well-argued refutation if indeed that is what will end misguided or false narratives.
The best tribute we can offer to those we have lost is through demonstrating the will to find credible answers, fix the issues and assure the world that more lives will not lost in future to similar incidents.
A new Malaysia under this new Government has been the source of new fledgling hope.
To those who have fallen silent travelling on MH370, we remain respectful and eternally indebted for the time they shared with us. To those who have offered silent support, those who have lent their voice and those who have sent their prayers, we remain grateful. We draw strength from your little acts of kindness, words of solidarity, and your quest for the truth – whichever corner of the earth you seek it from.
Questions have a way of persisting and even outliving you and me till satisfactorily answered. I go back to pick up the threads of my life in Chennai secure and with faith that one day we will know.
MH370 Path around Penang Island. (Click on image to enlarge.)
Introduction
The civilian radar data for MH370 that became publicly available in April 2018 provides insights as to how MH370 was flown after the transponder was disabled around 17:20:31 UTC. After flying by waypoint IGARI and turning back, the aircraft passed to the north of Kota Bharu Airport, crossed the Malaysian peninsula in a southwest direction, passed to the south of Penang Island, turned to the northwest, and flew over the Malacca Strait. Here, we look more closely at the flight path as it flew towards, around, and away from Penang.
In order better understand the sequence of inputs to the flight control system, we created a simulation using the PMDG 777 model in Microsoft Flight Simulator. In particular, we studied whether the aircraft might have been flown with the pilot providing inputs to the autopilot, and what those inputs might have been.
Although we can calculate the groundspeed from the radar data, the altitude of this portion of the flight is not known. In the simulation, the flight segment near Penang was flown with the assumption of a level flight at FL340 and at Mach 0.84, and with representative meteorological data. These assumptions are consistent with the observed groundspeeds of around 510 knots. Within a reasonable range, the assumptions about altitude, Mach number, and atmospheric conditions do not materially change our observations and conclusions for this portion of the flight.
Simulation
A flight simulation with the autopilot engaged was created in the following manner:
In the Flight Management Computer (FMC), Penang Airport (WMKP) was set as the destination, and the procedure for an arrival to the ILS04 Runway via the BIDM1A standard terminal arrival route (STAR) was selected. The waypoints for this complete route would be BIDMO- PUKAR-ENDOR-MEKAT-KENDI-CF04-FF04-RW04. The final three waypoints are the final approach course fix, the final approach fix, and the runway threshold, in that order, for an ILS approach to Runway 04.
Of these waypoints, all are deleted from the route except ENDOR and FF04. VAMPI is added after FF04.
The aircraft approaches ENDOR with the autopilot engaged and LNAV selected. After passing ENDOR, the aircraft automatically turns towards FF04.
About 2 NM before FF04, TRK SEL is chosen and the pilot turns the selection knob to steer towards OPOVI using the map in the navigational display (ND) as a guide. The aircraft passes FF04 about 0.4 NM to the right. (If the autopilot had remained in LNAV, the aircraft would not have flown exactly over FF04, as the aircraft would have “cut the corner” as it turned towards VAMPI.)
After passing near OPOVI, TRK SEL of 300° is dialed with a maximum bank angle of 15°. This initiates a turn to the right at 15°. When the track of 300° is approached, the aircraft automatically rolls out of the turn and maintains this track.
Once established on a track of 300°, LNAV mode is selected as the next mode.
At this track angle, the aircraft path converges towards the route leg defined by the waypoints FF04-VAMPI. At about 30 NM from FF04, as the aircraft approaches this leg, the autopilot mode automatically changes from TRK SEL to LNAV, and the route leg is captured.
The plane proceeds in LNAV mode past Pulau Perak and towards VAMPI on the path defined by FF04-VAMPI.
The next figure shows how the waypoints and route legs would appear in the navigation display (ND) in the cockpit after the aircraft had just passed ENDOR and with the route configured as ENDOR-FF04-VAMPI. The route (magenta line) shows the path the aircraft would have followed if the autopilot remained in LNAV mode as the aircraft rounded Penang Island. By comparing the preceding figure with the one below, it is clear that the autopilot changed to a different mode before FF04 and changed back to LNAV mode when the path converged on the LNAV route about 30 NM from FF04.
Navigational display after passing waypoint ENDOR.
Observations
There are some interesting observations about this path:
The agreement between the simulated flight path and the civilian radar data is very good, including the intercept and capture of the route leg to the northwest and towards VAMPI. This suggests that this portion of the flight path was flown in autopilot, although it is nearly impossible to prove that the aircraft was not manually flown.
The final civilian radar targets fall close to the path defined by FF04-VAMPI. This suggests that VAMPI was selected as a waypoint before reaching FF04, which further implies that there was an intention to fly northwest over the Malacca Strait and to intercept VAMPI even when the aircraft was near Penang. (The distance between FF04 and VAMPI is 166 NM.)
While in the vicinity of Penang Island, the high measured speed, the implied high altitude, and the selection of VAMPI as a waypoint suggest that there was no true intention to land at Penang Airport.
The selection of VAMPI as a waypoint while in the vicinity of Penang is consistent with the unverified military radar data that was shown to the MH370 family members at the Lido Hotel in Beijing on March 21, 2014. That radar data shows an aircraft that intercepted airway N571 at VAMPI.
Although there was no true intention to land at Penang Airport, the flight path may have been chosen to deceive radar operators into believing there was an intention to land.
Possible Deception to Land at Penang
In the figure below, the flight path from MH370 is plotted together with two recent Air Hong Kong flights (both LD561) for the route Ho Chi Minh City to Penang. These flight paths are representative of arrivals to Penang from the northeast. The LD561 paths do not follow the BIDM1A approach route and bear little resemblance to MH370’s path. Likely, the flight crews received vectors from Butterworth Approach to intercept and establish the final approach on the localizer for Runway 04. One of the flights was established at the final approach course fix (CF04) and the other was established only 3 NM from threshold. In the both cases, the intercept with the final approach course required a turn less than 90°. On the other hand, if MH370 had intercepted the localizer, it would have required a turn of about 135°, which would have been a very sharp turn.
MH370 Path shown with two Air Hong Kong arrivals. (Click on image to enlarge.)
Airline pilot Juanda Ismail noticed that MH370’s crossing of the ILS approach occurs at a similar location and similar intercept angle to what would be flown in the course reversal procedure for ILS04. The procedure is shown in the figure below, and consists of an outbound leg to 7 NM from the threshold of the runway at a track of 222°, a 45° right turn to a track of 267°, a straight leg, a 180° left turn to a track of 87°, a straight leg, followed by a 45° left turn to intercept the inbound approach course on a track of 42°. In the figure above, this same course reversal procedure is represented by the black curve with the arrow.
Approach for ILS (DME LOC) for RW04. (Adapted from Jeppesen.)
In the course reversal procedure, the straight leg at 267° is similar to part of the path that MH370 flew. However, in comparing MH370’s path to the course reversal procedure, it is missing the outbound leg, the 180° turn, and the final intercept. As the altitude for capturing to the glide slope is 2500 ft at FF04 (shown as D7.8 IPG in the figure), clearly there was no intention on the part of the pilot to actually perform the procedure and to land. However, it is possible that by flying an element of the course reversal procedure, there was a deliberate attempt to deceive radar operators into believing that MH370 had an intention to land.
With waypoints ENDOR-FF04-VAMPI selected as the route, there is a question as to why the pilot chose to not remain in LNAV mode when approaching FF04, as this would have turned the aircraft and put it on a direct northwest path to VAMPI without the need for pilot intervention. One explanation is that once a turn to the northwest towards VAMPI occurred, it would be clear to the air traffic controllers at Butterworth that there was no intention to land. Entering TRK SEL mode and steering the plane towards OPOVI before tracking back towards the FF04-VAMPI leg delayed that discovery and also positioned the aircraft to initiate the turn further from Butterworth.
It is also noteworthy that once a northwest track was established, the aircraft was tracking to pass through the restricted area designated WMD-412A. This would be expected to draw the attention of the military air traffic controllers at Butterworth. The relationship between the military and civilian ATC is described in this section from the Factual Information released in March 2015:
Provision of approach control service (within lateral limits of Butterworth Control Zone: 5,500 ft. altitude – FL245. (elsewhere 2,500 ft. altitude – FL245). Air traffic to/from the civilian Penang International Airport (PIA) is provided by military ATCOs who have been licensed by the ATI Division develops and establishes the ANS safety standards and performs safety oversight and to ensure the provision of services to civil traffic. The rationale for such an arrangement is based on the military activities at Butterworth Military Airport (BMA) which is in close proximity to PIA, and other military activities carried out over the high seas in danger areas WMD 412A and WMD 413A (permanently established). Furthermore, the final approach segments of both the PIA and the BMA intersect. No major incident has been recorded with the present arrangement/delegation of authority.
Conclusions
MH370’s flight path near Penang can be replicated with the autopilot engaged.
The flight path near Penang is consistent with a navigation system that is fully operational.
It is likely that waypoint VAMPI was entered in flight computers before crossing the approach path to runway ILS04, some 166 NM away.
The flight path near Penang is consistent with the image of the military radar data in the Malacca Strait that was never officially released.
It is very unlikely that there was an intention to land at Penang Airport.
It is possible that the elements of the flight path near Penang were chosen to deceive radar operators into believing that the aircraft had an intention to land.
Acknowledgement
I gratefully acknowledge the helpful comments and suggestions offered by fellow IG members Don Thompson, Richard Godfrey, and Mike Exner.
Blaine Gibson holds new MH370 debris, accompanied by a fisherman who found the part in Madagascar
Today Blaine Gibson and other MH370 family members delivered to Malaysian authorities five new pieces of debris that are believed to be from the missing aircraft. The parts were found as a result of a campaign led by Blaine and the families to make the residents of Madagascar more aware of debris from MH370 that has drifted across the Indian Ocean and continues to land on the shores of East Africa.
Blaine has provided photographs and descriptions of the five parts, which are made available here in a zipped file. More recent high-resolution photographs are available here. The most recently discovered part (Part 5), pictured above, was found by a local fisherman this past August.
One piece of debris (Part 3) was identified by MH370 Independent Group (IG) member Don Thompson as a shattered piece of the interior floorboard of a Boeing 777. The part’s location in the B777 and the nature of the damage is consistent with a high speed impact, and therefore has probative value.
Fragment of floorboard of MH370
Identification of the Floorboard Piece
IG members Don Thompson and Mike Exner assisted Blaine in identifying the floorboard piece, and Don documented his findings in a report. An important clue was the piece contained a portion of a placard with the identifying characters WPPS61. Don was able to determine that the full placard number is BAC27WPPS61. This type of placard is affixed to high strength panels of material specification BMS4-20, which is used as flooring material in passenger compartments of commercial aircraft, including the Boeing 777-200ER. Amazingly, Don was able to find a similar placard affixed to the floorboard of wreckage from MH17, which was also a Boeing 777-200ER. This leaves little doubt that the piece recovered from Madagascar is from MH370.
Portion of floorboard placard showing characters WPPS61
Discussion
The new debris gives us additional insight about where and how the aircraft impacted the sea. In light of the past efforts to find the aircraft, there are three main possibilities that remain:
The aircraft impacted the ocean relatively close to the 7th arc, but at a latitude further north than the area previously searched.
The aircraft impacted the ocean at a latitude previously searched, but farther from the 7th arc than previously assumed.
The aircraft debris field was in the subsea area previously scanned by sonar, but was either missed or misidentified.
Sources close to the previous search effort believe (3) is very unlikely, as there was a thorough review of the sonar data by multiple parties with high levels of experience, and because any “points of interest” were scanned multiple times to ensure the resolution was adequate to make a determination with a high level of confidence.
When considering the satellite data, the final two BFO values at 00:19 UTC are consistent with an aircraft at an increasingly high rate of descent. The new debris and some of the previously recovered debris also suggest that the aircraft impacted the ocean at high speed. That means that (2) is possible only if the aircraft first was in a rapid descent (producing the final BFO values), and then the pilot skillfully recovered from the rapid descent and glided some distance away from the 7th arc beyond the width of the subsea search, and then later the aircraft again descended at high speed and impacted the sea (producing the shattered debris). This sequence of dive-glide-dive is considered by many to be a very unlikely sequence of events, although it cannot be completed dismissed.
What is left is possibility (1). This suggests future subsea search efforts should proceed along the 7th arc, starting where the last search ended near 25S latitude, and continuing farther north. (In a previous blog post, I showed that an automated flight ending along the 7th arc at 22S latitude is possible.)
The part recovered in Madagascar in August 2018 was the latest in a series of finds that began with the discovery of the flaperon on Reunion Island in July 2015. Because of the wide range of discovery times, and because there is an undefinable delay between when a part arrives on a beach and when it is discovered, it is difficult to use the timing and location of debris discoveries to precisely pinpoint where to search for MH370.
Finally, the new debris finds illustrate the critical role of independent investigators in the search for MH370, and one investigator in particular. The local communications campaign to educate residents of Madagascar about debris washing ashore was spearheaded by Blaine Gibson with the help of some of the MH370 families. Blaine has also done a commendable job of developing a local network to help recover the debris after discovery. We have to wonder if additional debris is sitting on the shores of other countries like Tanzania, Kenya, and Somalia, where there were no similar campaigns to alert and organize the residents.