Introduction
Boeing recently conducted end-of-flight simulations for MH370 with the assumption that there was no pilot input. The results were released in November 2016 by the ATSB as part of a report entitled MH370 – Search and Debris Examination Update. Boeing observed that in simulations where the aircraft experienced a descent rate consistent with the values and timing of the last two BFO data points, the aircraft impacted the water within 15 NM of the 7th arc. However, the details and the likelihood of the configuration that caused the high rates of descent were not discussed.
In order to better understand the conditions leading to the descent rates suggested by the final BFO values, and to estimate the distance MH370 might have traveled after crossing the 7th arc, simulations were conducted using the PMDG 777-200LR model add-on to Microsoft Flight Simulator X (FSX). After making adjustments for differences between the PMDG 777 model and MH370, the flight characteristics were recorded under various conditions.
Modeling the End-of-Flight Using FSX
9M-MRO was a B777-200ER and the PMDG 777 model is a B777-200LR. The main differences are:
- Weight: The 777-200ER has a maximum take-off weight (MTOW) of 297.6 MT, while the 777-200LR has a MTOW of 347.5 MT, so the 777-200LR is in general a heavier aircraft. In the simulations, the zero-fuel weight (ZFW) was set to 174.4 MT to be consistent with MH370.
- Engines: 9M-MRO’s version of the 777-200ER has Trent 892-17s with 41,768 kgf (90,000 lbf) of thrust, while the PMDG 777-200LR has GE90-110B1s with 50,285 kgf (110,760 lbf) of thrust. Since only the results from the simulation after fuel exhaustion are used, the difference in engine thrust is not important.
- Wings: The 777-200LR version has a wing area about 2% greater area than the 777-200ER due to raked wingtips, which decrease the wing loading and reduce drag in cruise. The small difference in aerodynamic performance from the raked wingtips would produce little if any difference in the end-of-flight scenarios considered here, and are ignored.
In order to get realistic results from the FSX simulation, it is also important to recognize and compensate for other inaccuracies of the PMDG 777 model. In particular, it was found that the behavior of many systems when components have failed is not correct. Nonetheless, the basic aerodynamic model of the PMDG 777, when not at envelope limits such as stall conditions and transonic speeds, should be sufficiently accurate to model the flight characteristics of the B777. (Even a Level D simulator is not guaranteed to be accurate outside of the aircraft’s certified flight envelope.) The details of the flight dynamics model as incorporated into FSX are described by Yves Guillaume.
To model the flight behavior after fuel exhaustion, the simulation was conducted with the following initial conditions and programmed events:
- Initial conditions are stable flight at 220 KIAS and FL350, which is representative of flying with one engine inoperative and decelerating from the dual engine cruise speed, but still holding altitude.
- At t = 0, following events occur:
- The fuel level is set to zero. In addition to shutting down the engines, this prevents the APU from starting.
- The two fuel cut-off switches are set to OFF. Although it may not seem necessary to set the fuel level to zero AND employ the cut-off switches, in the PMDG model, the windmilling action of the engine shafts continues to supply electrical and hydraulic power if the cut-off switches are not employed.
- The primary flight computers (PFC) are programmed to degrade to “secondary” control law. Although the loss of power to the left and right transfer busses removes heat to the pitot sensors, which should automatically degrade the control law from “normal” to “secondary”, in the PMDG 777 model, the control law remains in normal mode without programming this failure. In normal mode, yaw compensation and envelope protection would be available, while they are not available in secondary law.
Implications of the BFO Values on Flight Dynamics
The last two values of BFO were 182 Hz at 00:19:29 and -2 Hz at 00:19:37. Assuming a BFO bias of 150 Hz and a nominal position at (30S, 98E), a groundspeed of 385 kn, and a track of 172°T, the corresponding descent rates are 4,000 fpm and 14,400 fpm. This represents an increase of 10,400 fpm over 8 seconds. After conducting studies of the various flight conditions that might cause these descent rates, the following observations are offered:
- If the aircraft has perfect lateral trim, i.e., the ailerons and rudder are positioned to perfectly remove any lateral (side-to-side) asymmetry of the aircraft about its longitudinal axis, the aircraft will fly relatively straight with no pilot input. The aircraft will also develop a phugoid flight pattern consisting of a damped-sinusoid vertical speed component superimposed on the quasi-steady vertical speed component. The quasi-steady vertical speed would correspond to a descent angle of about 3°, and a glide distance of greater than 110 NM is possible. However, the amplitude of the phugoid would be smaller and the period of the phugoid would be longer than the descent rates suggested by the BFO values. The case of a straight flight with a phugoid descent is therefore not studied here as it does not match the BFO values.
- If the aircraft is flying straight with little or no bank, the descent rates can match or exceed the descent rates suggested by the BFO values if the pilot commands a single nose-down input. The aircraft would correspondingly impact the ocean close to the 7th arc. It is also possible that the steep descent could be arrested with a subsequent nose-up input, and the aircraft could be piloted to glide some distance (> 100 NM) from the 7th arc before the aircraft impacts the ocean. Other than noting that with pilot input, the impact point could vary greatly in distance and direction from the crossing point of the 7th arc and still match the BFO values, this scenario is not considered here.
- If the aircraft has lateral (side-to-side) asymmetry about the longitudinal axis that is not removed by the appropriate positioning of the ailerons and/or rudder, the plane will enter a bank with a roll rate determined by the magnitude of the lateral asymmetry. As the bank angle increases, the descent rate also increases. With sufficient lateral asymmetry, the descent rates can match or exceed the descent rates suggested by the BFO values. This case is the case studied here.
Simulation of Banked Descent and No Pilot Input
After fuel exhaustion, the control wheel was turned about 4.5 units to the left in order to match the BFO values by introducing lateral asymmetry. (With the “no-pilot” assumption, the position of the control wheel in MH370 likely stayed in the neutral position. In the simulation, the control wheel was turned to reproduce lateral asymmetry resulting from other sources.) The control wheel input induced a roll rate of about 3.6 deg/s. As the bank angle increased, the descent rate correspondingly increased. In the simulation, the increase of descent rate from 4,000 fpm to 14,400 fpm required about 9 s, while the measured BFO corresponding to these descent rates are spaced at about 8 s. The lateral asymmetry caused by the rotation of the control wheel is therefore judged to be about equal to the lateral asymmetry of MH370 after fuel exhaustion.
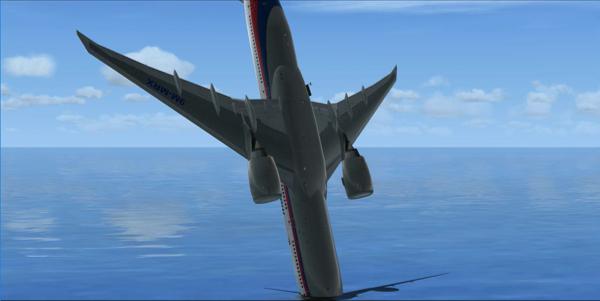
A video showing the view from the cockpit during the simulated descent is included below. The aircraft rolls past 180° and impacts the water at a pitch angle that is almost vertical. During the descent, the speed reaches about Mach 1.1, and the descent rate approaches 60,000 fpm (593 kn). Although these speeds are outside of the performance envelopes that can be accurately modeled by the PMDG 777 model, it demonstrates that the BFO measurements are consistent with a very high speed impact.
Another video below is an outside view of the aircraft during the descent, showing how the increasing bank leads to increasing pitch down. At about 14 s, the deployment of the ram air turbine (RAT) can be seen and heard.
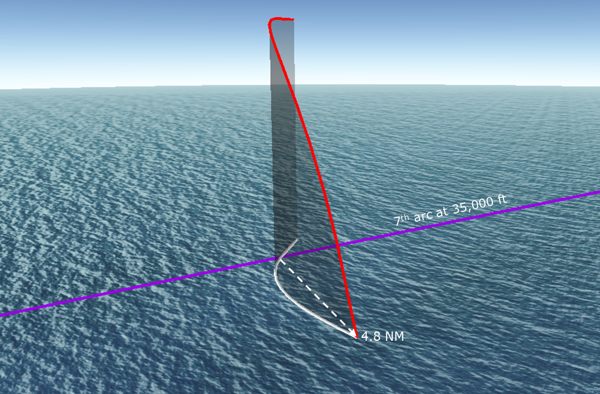
The figure below shows the trajectory of the aircraft. The position is adjusted so that the path crosses the 7th arc when the descent rate is about 4,000 fpm. There is only about 50 s between the time the descent rate reaches 4,000 fpm and the time of impact, and the impact is about 4.8 NM from the crossing of the 7th arc.

No wind is included in the simulation. However, considering that the aircraft impacts the water in about a minute and the winds were to the east, the effect of wind on the distance from the 7th arc should be small.
Possible Causes of the Lateral Asymmetry
The lateral asymmetry that induces the roll and the banked descent can be caused by a number of factors, including:
- Geometrical asymmetries (“bend”) that would cause yaw and bank when the control surfaces are in their neutral position. Normally, this would be compensated by a pilot by adjusting rudder and aileron trim. However, the amount of trim might not exactly balance the asymmetry so there would be residual out-of-trim.
- Asymmetric position of control surfaces caused by differences in hydraulic pressure that is supplied to the control surfaces on either side of the aircraft after fuel exhaustion.
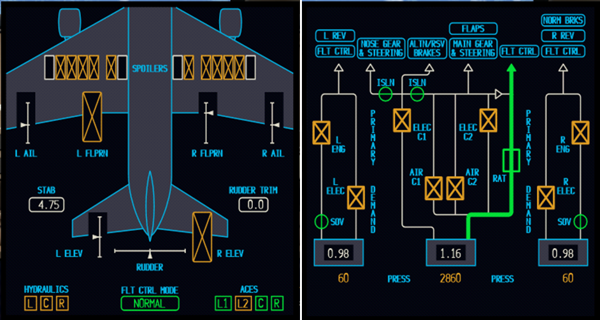
After fuel exhaustion and without the APU operating, the main source of hydraulic pressure is from the RAT, which supplies pressure to the “center” hydraulic system. As can be seen below in the synoptic displays for the flight control surfaces and the hydraulic system, when the RAT is deployed, only the right flaperon has hydraulic pressure, and the left flaperon is “bypassed”, so that the flaperon moves freely. If the position of the right flaperon is positioned slightly down compared to the left flaperon, the result would be a roll to the left.

In fact, we have an indication that this would occur. In the Aircraft Maintenance Manual (AMM) for the B777, in the section on the Ram Air Turbine System, there is this note that was found by Don Thompson:
Training Information Point
When the RAT is extended and hydraulics off, the airplane rolls left. Two to three units of right control wheel rotation are necessary to hold the wings level.
In the simulation, 4.5 units of rotation were added to simulate the banked descent. Based on the note in the AMM, it appears that this level of wheel rotation causes asymmetric flaperon positions that are similar to what would be expected when the hydraulic pressure is supplied by the RAT.
The RAT would be deployed within seconds of the second engine flameout. However, the log-on request at 00:19:29 is believed to occur about two minutes after the second engine flameout. (One minute is required to start the APU and one minute is required for the SATCOM to request a log-on after power-up.) Therefore, there is a two-minute delay between deployment of the RAT and the roll. In fact, the pressure to the left and right hydraulic systems might decay over some period of time, as determined by the consumption of hydraulic fluid by various systems as well as the limited flow that is available as the engines windmill and the engine-driven pumps operate at reduced capacity. These factors might contribute to the two-minute delay before the aircraft entered into the banked descent.
Conclusions
The BFO values at 00:19:29 and 00:19:37 suggest that MH370 was descending at an increasingly high rate. With the assumption that there were no pilot inputs, the descent rates suggest the aircraft was in a roll as it was descending. According to Boeing documentation, when the hydraulic pressure is supplied by the ram air turbine (RAT), the aircraft banks to the left, which may have been the cause of the rolling during the descent. Using the PMDG 777 model add-on to FSX, simulations were performed for a banked descent that matched the descent rates suggested by the BFO values. In the simulation, the aircraft impacts the water at speeds around Mach 1 and with nearly vertical nose-down pitch. The distance of the impact point from the crossing of the 7th arc is less than 5 NM.


