Archive for October, 2017

Possible MH370 Paths Along Great Circles

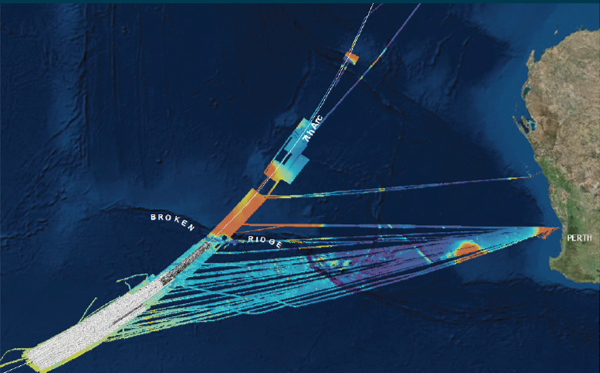
Figure 1. Great circle paths that match the satellite data after 19:41. (Click on image to enlarge.)

Introduction

In the last post, I presented how the simulation data found on the home computer of Captain Zaharie Shah suggests that the recovered data were from a single flight session on Feb 2, 2014, in which the aircraft takes off from Kuala Lumpur International Airport (KLIA), flies northwest over the Malacca Strait, flies past the Andaman and Nicobar Islands, turns to the south, and exhausts its fuel in the Southern Indian Ocean. The simulated flight could have represented a diversion of flight MH150 from KLIA to Jeddah, Saudi Arabia, which the captain commanded two days later on Feb 4, 2014.

The alignment of data set 10N (the northernmost), 45S1 (just after fuel exhaustion in the SIO), and Pegasus Field (NZPG) at McMurdo Station, Antarctica, suggests that the simulation user might have selected autopilot and used LNAV mode. If LNAV mode is selected, the aircraft follows a great circle path between the starting and ending waypoints of the active leg. This raises the possibility that McMurdo was used as a final waypoint for navigation with the expectation that fuel would be exhausted in the SIO, well before reaching Antarctica.

In this article, I reconstruct flight paths with the assumption that MH370 was flown in automated flight in a similar way as in the simulation session. In particular, I reconstructed flight paths using the following two criteria:

  1. After 19:41, MH370 was flown in under autopilot, and was following a great circle path in LNAV mode and speed was controlled using the autothrottle.
  2. In addition to (1), after 19:41, MH370 was following a great circle path that leads to an airport in Antarctica.

What this article does not consider is how drift analyses based on the location and timing of recovered debris from MH370 affects the impact probabilities along the 7th arc. A review of the available drift analyses needs to be considered along with any path reconstruction studies before a new search area can be recommended with any level of confidence.

Flight Paths Along Great Circles after 19:41

Figure 1 shows the path (green) of MH370 as captured by Malaysian civil and military radar. After the last radar capture at 18:22, all we have to help us reconstruct possible paths are the Burst Timing Offsets (BTOs) and Burst Frequency Offsets (BFOs) from communication between the aircraft, Inmarsat’s F1 satellite above the Indian Ocean, and Inmarsat’s Ground Earth Station (GES) at Perth. The BTO values indicate how far the aircraft was from the satellite, and therefore possible locations that satisfy the BTO values form an arc when plotted. Shown in Figure 1 are the arcs at 19:41 (the 2nd arc) and 00:19 (the 7th arc). While the BTO values are indicative of position, the BFO values are indicative of the speed (horizontal and vertical) and track of the aircraft. The BFO nvalues tell us, for instance, that MH370 was traveling south after 19:41, and also tell us the aircraft was in an increasingly steep descent at 00:19.

The radar path ends as MH370 was traveling northwest in the Malacca Strait. Yet we know from the satellite data that the flight ended in the SIO, and the satellite data after 19:41 shows a progression of values consistent with automated flight. The details of how MH370 might have been flown between 18:22 and 19:41 is still the subject of much debate, and it is possible that multiple maneuvers occurred in this time period. (I’ll be presenting some thoughts on this in the next article, benefiting from some new insights.) For now, we start our analysis at 19:41 and don’t consider the time period between 18:22 and 19:41, but also recognize that some of the paths presented below may be eliminated by constraints imposed when the time period 18:22 – 19:41 is considered.

The reconstructed paths starting at 19:41 and ending at 00:19 are shown in white in Figure 1 for paths at a constant pressure altitude of 35,000 ft. Wind and temperature data from GDAS were used to relate Mach number to ground speed. Each path corresponds to a specific track angle at 19:41. (The track angle will in general vary along each path as would be expected along a great circle.) Initial track angles between 162°T and 192°T were considered, and these paths cross the 7th arc over a range of latitudes between 22S and 40S. For each initial track angle, the position at 19:41 was found that minimized the RMS error for the BTO at the times 19:41, 20:41, 21:41, 22:41, and 00:11. (The position at 19:41 was not constrained to fall exactly on the 2nd arc.) The corresponding RMS error for the BFO values at times 19:41, 20:41, 21:41, 22:41, 23:14, and 00:11 was also recorded.

For automated control of speed, two autothrottle modes were considered for the time period between 19:41 and 00:11: constant Mach number, and Long Range Cruise (LRC), in which the Mach number decreases as fuel is burned and the weight decreases. For the time period between 19:41 and 00:11, a speed is chosen so that the aircraft exactly crosses the 7th arc at 00:19 .

The LRC speed schedule also serves as a proxy for ECON speed, for which the speed also varies with aircraft weight. ECON offers better cost efficiency than LRC because the relative value of time and fuel can be adjusted through a Cost Index (CI) parameter, and because the Mach number is adjusted for wind. However, I chose to not consider ECON speed here because the speed profile would be similar to LRC (depending on the CI), and the exact methodology is not generally available to the public for calculating Mach number as a function of weight, altitude, Cost Index, and wind. (Bobby Ulich has just published a model that makes excellent progress in this regard.)  If ECON speed had been considered, it is possible that the BTO values for the same of the paths would have marginally improved.

Figure 2 shows the BTO and BFO errors across a range of latitudes for crossing the 7th arc. Some observations are:

Figure 2. Match to satellite data after 19:41 for great circle paths. (Click on image to enlarge.)

  • For latitudes south of 34S, the LRC speed is too slow, and constant Mach number results in a better BTO fit.
  • For latitudes north of 34S, the speed reduction offered by LRC speed results in a better BTO fit than for constant Mach number.
  • For the paths at constant Mach number, the Mach number varies between 0.801 for a crossing at 22S, to 0.842 for a crossing at 40S.
  • Constraining the BTO error to less than 32 μs eliminates paths crossing the 7th arc north of around 26.6S.
  • Constraining the BFO error to less than 7 Hz eliminates paths crossing the 7th arc south of 39S latitude and north of 28S latitude.
  • The minimum BTO error for LRC speed occurs for a crossing of the 7th arc around 33S latitude
  • The minimum BFO error occurs for a crossing of the 7th arc of around 35S latitude.

Flight Paths Leading to Waypoints Past 7th Arc

From among the family of reconstructed paths that follow great circles between 19:41 and 00:19, we consider three paths that align with three airports in Antarctica: South Pole (NZSP), Pegasus Field-McMurdo (NZPG), and Wilkins Runway (YWKS). In August 2014, I first considered a path towards the South Pole that might have occurred after a possible landing at Banda Aceh airport (WITT). Although I have long abandoned the possibility of a landing, the scenario of a holding pattern near Banda Aceh followed by a cruise on a due south course remains an interesting possibility. More recently, the path towards NZPG was  investigated in a paper I co-authored with Richard Godfrey, and subsequently Richard proposed the YWKS destination in a separate paper.

The three paths to airports in Antarctica are shown in Figure 1 as black lines that extend past the 7th arc. The coordinates as the paths cross the 7th arc are also shown.

Added Nov 10, 2017: Additionally, a fourth path is shown which aligns with 45S, 104E, which are the coordinates from the final data set found on the captain’s home computer. This case is included to represent the scenario where MH370 was flown towards the location where fuel exhaustion was simulated on the captain’s home computer.

The match of the four paths to the satellite data is shown in Figure 2. Of the four, the path to NZSP crosses the 7th arc closest to the latitude where the BFO and LRC BTO errors are at their minimum values. (Lower BTO errors occur for constant Mach paths crossing at more southern latitudes. However, any path requiring Mach numbers faster than LRC is unlikely to have enough fuel.)

More on the Path Towards the South Pole

The flight towards the South Pole is interesting because there are several ways that the autopilot might be used to create this flight. In LNAV mode, a pilot could enter a custom waypoint with a latitude of 90S and any longitude. Or, he could enter the built-in waypoint for the South Pole, which is SPOLE. Or, if it’s available in his waypoint database, he could enter the waypoint for the runway serving the South Pole, which is NZSP. Any of these methods would cause the aircraft to follow a path that closely follows a great circle to the South Pole. Also, if a pilot wanted to reach as far south as possible, a path towards the South Pole using LNAV would be an obvious selection.

Another procedure would be to use TRK SEL mode, with a value of 180° and the NORM/TRUE switch set to TRUE. Although this would produce similar results as the method using LNAV, it is possible that the aircraft could at times deviate from the required track, and the path could deviate from a great circle. For instance, a wind gust or turbulence could momentarily cause the track to deviate. Although the autopilot would correct for the deviation and bring the track back to the target value of 180°T, the error in path that accumulated during the track deviation would not be corrected. By contrast, in LNAV mode, deviations from the great circle path are continuously corrected so path errors don’t accumulate.

There is also close alignment between this path towards the South Pole and waypoint BEDAX. I’ll discuss this more in a future article.

Figure 3 shows an exploded view of the search area, showing the boundary of what was previously searched (yellow), and where CSIRO proposes to search next (green). The new search area extends about 25 NM to the northeast of the 7th arc at 35,000 ft (blue), and about 27.5 NM to the southwest. The three impact sites proposed by CSIRO are also shown, ordered by their priority. In this part of the arc, the width of the searched area is about 19 NM to either side of the 7th arc. The highest priority impact site is 23 NM to the southeast of the 7th arc, and falls within the proposed search area, which extends between 19 NM and 27.5 NM from the 7th arc.

Figure 3. Exploded view of search area proposed by CSIRO. (Click on image to enlarge.)

The path that extends to NZSP (white) is also shown in Figure 3, which runs along 93.7E longitude. At the point of crossing the arc, the width searched was only about 6.5 NM to the northwest and 15.6 NM to the southeast. The fact that this part of the arc was only narrowly searched presents an interesting opportunity to search in the future.


In the future articles, I’ll present more thoughts on how the MH370 aircraft might have been flown between 18:22 and 19:41, and the implications for possible impact sites along the 7th arc.

Update on November 10, 2017

Here is a CSV file with data for the great circle paths, including the position and track at 19:41, position at 00:19, and speed mode. Included are the data for four paths that align with waypoints past the 7th arc. The four waypoints are the South Pole (NZSP), Wilkins Runway (YWKS), Pegasus Field-McMurdo (NZPG), and the fuel exhaustion position from the simulator data (45S, 104E).

Update on November 11, 2017

In Figure 4 below, I have plotted the paths to the four waypoints (NZSP, YWKS, NZPG, 45S) on the same plot that was generated by CSIRO to show the cumulative probability of detection of low-windage debris by the surface search for various impact points along the arc. The calculated probabilities include the drift that might have occurred between the time and location of the impact and the time and location of the search. It can be seen that there are impact points along the 7th arc and north of 33S where the probability of detection is significantly less than 100%, especially if the impact was to the northwest of the arc.

Figure 4. Efficiency of surface search shown with selected great circle paths. (Adapted from CSIRO.) (Click on image to enlarge.)

Update on November 14, 2017

IG Member Brian Anderson has reminded us that “There are a number of RNZAF photos of interesting flotsam (debris), in areas that may now be much more significant. Unfortunately none was ever recovered.” Two of the more interesting photographs are found below. The first photo (Figure 5) is an unknown object that could be part of an aircraft. The second photo (Figure 6) is a field of floating debris.

Figure 5. Aerial photograph (5849) of unknown object on March 29, 2014, at 28.8866S, 96.0844E. (Click on image to enlarge.)

Figure 6. Aerial photograph (5832) of debris field on March 29, 2014, at 28.3927S, 97.7750E. (Click on image to enlarge.)

Both photographs were taken on March 29, 2014, at coordinates not far from where the great circle path to 45S,104E crosses the 7th arc near latitude 28.3S.

In order to determine if these objects are consistent with the expected drift of debris from an impact near 28.3S on March 8, 2014, I used the CSIRO-generated drift results for an impact on the arc near 28S latitude, where the drift model was seeded with objects within an approximate +/- 0.5 deg square area. The drift model results are shown in Figure 7 for the calculated position of debris on March 29, 2014.

Figure 7. Drift results from CSIRO for an impact along the 7th arc near 28S latitude. (Click on image to enlarge.)

The results are shown for low windage debris (red) and high windage debris (green), and should be representative of a range of objects produced by the impact. Both the unknown object and the debris field are found in the general vicinity of where the model predicts objects would drift for the modeled impact location. This makes the possible impact site of 28.3S even more interesting.

Posted in Aviation | 1,239 Comments »

Simulator Data from Computer of MH370 Captain: Part 1

Simulator path (red) and recent MH150 flights (colored circles). (Click on image to enlarge.)

Introduction

Within weeks after MH370’s disappearance on March 8, 2014, news stories revealed that Captain Zaharie Shah deleted data from his home flight simulator in the weeks prior to the disappearance, and FBI investigators at Quantico, Virginia, were assisting in recovering the data. Months later, new reports surfaced stating that the captain had used his home simulator to practice flights to the Southern Indian Ocean, and then deleted those flights from his home computer. Despite these reports, there was no official confirmation from Malaysia that suspicious data was found on the captain’s home computer.

We now know that the recovered data sets from the captain’s computer were included in a report compiled by the Royal Malaysian Police (RMP). The report was eventually obtained by several French media organizations, and large portions of the report were later made public.

On August 14, 2016, the MH370 Independent Group (IG) released a preliminary assessment of the simulator data contained in the RMP report. The data sets were created by Microsoft Flight Simulator (MSFS) software, and are in the form of fragments of “flight files”, which a user may create during a simulation session to record the state of the session for future reference or to resume the session at a future time. The particular flight files of interest were among hundreds of others found on the computer on several drives; however, the files of interest were deleted and recovered by investigators from a “volume shadow” on a single drive that was found disconnected from the computer. The grouping of the files in the volume shadow makes the set unique among the all flight files that were found.

The recovered flight files include flight and navigation parameters that are “snapshots in time”, and are associated with six unique coordinates. If these coordinates were all from a single simulation, it suggests that a user simulated a flight of a B777-200LR aircraft with a departure from Kuala Lumpur International Airport (KLIA), a climb and cruise over the Malacca Strait and then the Andaman Sea, followed by a turn to the south, and a termination from fuel exhaustion in the Southern Indian Ocean (SIO) near 45S 104E. The IG found  that if a great circle path that connects the final points is extended past the final point, the great circle would cross McMurdo Station, Antarctica. (McMurdo is the largest and most populated research station in Antarctica.) This raises the possibility that McMurdo was used as a final waypoint for navigation with the expectation that fuel would be exhausted in the SIO, well before reaching Antarctica.

The simulator data was found on what the Malaysian investigators refer to as drive MK25, where Microsoft Flight Simulator (MSFS) 2004, also known as FS9, was installed. (The main drive of the computer is referred to as MK26, where Microsoft Flight Simulator X, also known as FSX, was installed.)

The fragments of the flight files were found in a volume shadow dated February 3, 2014. A volume shadow is periodically created by the Windows operating system so that files can be restored to a particular date. This means that the file fragments found in the volume shadow were created on or before February 3, and then over-written on or after February 3.

Of the eight total flight file fragments that were recovered, three were for an aircraft on the ground at Kuala Lumpur International Airport (KLIA), and five were for an aircraft flying. Based on fuel levels and other indicators, the data sets in which the aircraft is flying can be related to one of the data sets for the aircraft at KLIA, i.e., six data sets appeared to be related to a single flight. The remaining two data sets at KLIA show fuel levels that are not consistent with the other data sets. These fuel levels may reflect intermediate values before the final takeoff fuel levels were selected.

There has been much discussion as to whether the six data sets are from a single simulation session, and whether the simulator was functioning normally when the data sets were saved. On November 29, 2016, I co-authored a paper with MSFS expert Yves Guillaume that investigated these and other aspects. To replicate the software used by the captain, Yves and I independently installed FS9 with the B777-LR model upgrade from Phoenix Simulation Software (PSS). After substantial testing, we discovered that:

  • The data points in the Andaman Sea share some of the same unique values as the data points in the SIO, suggesting the flight files came from the same simulated flight.
  • The parameters related to fuel and flight dynamics show that the position of the aircraft was manually changed along the flight path.
  • The data files were manually created and saved after certain parameters were manually changed.
  • The simulator appears to have been fully functional, and the rates of climb and other flight parameters after fuel exhaustion can be explained and repeated.

After this paper was published, I created a simulation that was initialized using the recovered values from the data set just after fuel exhaustion. I was able to show that it was possible to manually fly the plane for about 27 seconds and achieve the position, altitude, heading, pitch, and bank that were close to the values contained in the subsequent, final data set. This was further confirmation that the captain’s simulator was properly functioning when the data sets were created. Here’s a video of this short flight.

With the recent release of the ATSB’s report on the operational search, we have learned more about the simulator data found on the captain’s computer. Now three years and seven months after the disappearance, for the first time, the existence of the simulator data has been officially acknowledged in a public document. Although the ATSB does not speculate about whether the captain was responsible for the diversion, the report does reveal that in April 2014, the ATSB considered the simulator data as relevant evidence in defining the search area.

Date and Duration of the Simulator Session

From the ATSB’s report, we learned that on April 19, 2014, the Australian Federal Police provided the ATSB with the recovered simulator data. The report states that The simulator data was a partial reconstruction of a flight simulator session from 2 February 2014. Based on the February 3 date of the volume shadow, we already knew that the simulation was created on or before February 3. However, I was curious to know how the ATSB determined that the exact date of the simulation session was February 2 since the information about date and time was not included in the file fragments that were provided in the RMP report.

After some email exchanges with the ATSB, I was surprised to learn that the ATSB has additional data values from the recovered flight files that were omitted from the data sets that were provided in the RMP report. In particular, there is a section of the flight files in which the date and time of the simulation session are stored. These data values tie the date of the simulation to February 2, 2014. Also, the time values show that the chronological order of the data sets matches a flight departing KLIA, flying over the Malacca Strait, continuing past the Andaman Islands, turning to the south, and exhausting fuel in the SIO, in the same order that the progressively depleting fuel levels suggest. The time values also indicate that the flight session lasted for about one hour. This confirms that the position and fuel levels were modified during the simulation, just as Yves Guillaume and I had concluded in our paper.

The newly released information regarding the date and duration of the simulator session means that it is almost certain that the recovered data sets were from a single flight session.

However, as the signed date of this part of the RMP report is May 15, 2014, it remains a mystery as to why the Malaysians omitted important data values that were already available to the ATSB on April 19, 2014.

Simulated Flight Path

Using our previous notation, we refer to the identification of each data set by its latitude, i.e., as 2N, 3N, 5N, 10N, 45S1, and 45S2. The position of the first four coordinates are shown above in the figure, where the position for data set 2N is Runway 32R at KLIA.

After takeoff, the next coordinate is 3N, which is in the Malacca Strait on airway R467 between waypoints AGOSA and GUNIP. The altitude for 3N is 23,247 ft.

The next is coordinate 5N, which is between GUNIP and TASEK near airway B466. The exact position suggests the aircraft has already left airway B466; the track, which can be calculated from the components of the velocity presented in the 5N data set, is 317 deg, which is exactly towards waypoint VAMPI on N571. (The value for the heading is 315 deg, which differs slightly from the track due to wind.) The altitude at coordinate 5N is 32,246 ft.

The final point for the northwest portion of the path is coordinate 10N, at an altitude of 40,003 ft, and to the west of the Andaman and Nicobar Islands. The plane is at a heading of 256 deg, and is banked at 20 deg and turning left towards the south. The coordinates for 10N place it near airway N877 between waypoints LAGOG and DOTEN. The position suggests that the aircraft left the airway about 30 NM before DOTEN.

The final two coordinates, 45S1 and 45S2, are in the SIO near 45S, 104E, and are separated by a distance of about 2.5 NM. Despite the short distance, the altitudes at 45S1 and 45S2 are 37,561 ft and 4,000 ft, respectively. The data set for 45S2 shows unmistakable evidence that the altitude was manually changed from 37,654 ft to 4,000 ft just before the data set was saved, which is consistent with the large change in altitude over a short distance.

The track of 5N towards VAMPI on N571, and the proximity of 10N to airway N877, together suggest that in the simulation session, after taking off and flying to GUNIP, the aircraft joined N571 and followed the waypoints VAMPI, MEKAR, NILAM, IGOGU, LAGOG, and DOTEN. The great circle alignment of 10N, 45S1, and Pegasus Field (NZPG) at McMurdo Station, Antarctica, means the session might have simulated a great circle path towards McMurdo Station until fuel exhaustion was reached in the SIO. (Aircraft that are flying in LNAV mode follow great circle paths between waypoints.)

Similarities to Flight MH150

We know that the recovered simulator coordinates describe a flight departing KLIA that is not consistent with a flight to Beijing: the initial path of the simulation is to the northwest, flying over the Malacca Strait, and the initial path to Beijing is to the northeast, and flies above the South China Sea. I searched for whether there might be a scheduled flight that better matched the simulation coordinates 2N, 3N, 5N, and 10N. In particular, I searched for scheduled flights that had a departure that followed a route from KLIA to GUNIP, and then to either TASEK or VAMPI, and would require a fuel loading similar to the 68,424 kg that is inferred from data set 2N.

After considering the list of Malaysia Air’s departing flights from Kuala Lumpur, I discovered that MH150, from Kuala Lumpur to Jeddah, Saudi Arabia, met the fuel and path criteria. Next, I checked whether the captain had flown any MH150 flights in that time period. I was surprised to learn that he commanded MH150 on February 4, 2014, which appeared to be very close to the date that the simulation session was created. In November 2016, I privately communicated my findings to other independent investigators, although I thought it was still too speculative and controversial to present in a public forum. Months later, on April 30, 2017, I noted in a blog comment:

The flight might have been a simulation of a flight from KLIA to Jeddah with a diversion, as the fuel loading and SID are consistent with that. Also, Zaharie Shah was scheduled to captain MH150 to Jeddah on Feb 4, 2014. The Shadow Copy Set containing the deleted flight file fragments was dated Feb 3, 2014.

Now that we know that the exact date of the simulation session was February 2, 2014, the link between the simulation session and MH150 is less speculative. The authors of the recent ATSB report had similar thoughts:

On the day the simulation was conducted the PIC was on a rostered day of leave. The following day the PIC was rostered to fly from Kuala Lumpur to Denpasar, Bali and return the same day. On 4 February 2014 the PIC was rostered to fly from Kuala Lumpur to Jeddah, Saudi Arabia. The first three data points recovered from the simulator were consistent with the route from Kuala Lumpur to Jeddah. In the weeks between the Jeddah flight and the accident flight the PIC was rostered to fly return flights from Kuala Lumpur to Denpasar, Beijing, Melbourne and then Denpasar again.

I was curious to see just how close the path suggested by the simulator coordinates resembled previous paths taken by MH150. For the comparison, I used the ADS-B data available from FlightRadar24 for eight consecutive flights between Aug 17, 2017 and Sep 21, 2017. (The available data for all the flights end around waypoint LAGOG, probably due to the range limitations of the receivers in the vicinity.)  The MH150 flight paths are plotted above in the figure.

For seven of the eight flights, the aircraft departed KLIA and flew over waypoint GUNIP. For the seven flights that flew over GUNIP, six followed airway N571 towards VAMPI and continued to follow N571 towards LAGOG. One of the six that reached GUNIP, one flew towards TASEK on airway B466, but rejoined N571 near IGOGU. (Some of the flights show deviations from airways, which are probably weather related.). The similarity between typical routes taken by MH150 and the simulator data is evident.

We can only speculate as to why, just two days before he commanded MH150 from Kuala Lumpur to Jeddah, and five weeks before the disappearance of MH370, the captain used his home computer to simulate a flight of MH150 that was diverted to the SIO.

In Part 2, we further investigate the simulator data and how it may give us clues about MH370.

Updates on October 13 and 15, 2017. In the figure, the dates in the legend were corrected so that all refer to year 2017. Also, the label on the airway between LAGOG and DOTEN was corrected to be N877, and the label of the airway between GUNIP and TASEK was corrected to be B466. Thank you to Twitter handle @BKKDiet and blog contributors @Mick Gilbert  and @TBill for finding these errors.

Posted in Aviation | 554 Comments »

ATSB Releases Final Report on MH370

The Australian Transport Safety Bureau (ATSB) has released a report entitled “The Operational Search for MH370”. It is a long document (440 pages) that is meant to provide final documentation of all of the ATSB’s activities related to this incident. There are no new conclusions, although we can gain some new insights:

  • MH370 flew over or near IFR waypoints a cluster of waypoints near Kota Bharu called ABTOK, KADAX, and GOLUD and later PUKAR as it flew towards Penang. This implies that MH370 was following waypoints after the transponder stopped operating after the turn back.
  • The registration of the first officer’s cell phone on a tower on Penang Island is officially acknowledged for the first time. A footnote citation says, “This information was obtained by the Royal Malaysian Police and reported to the Ministry of Transport Malaysia. Though a formal report was not available to the ATSB, information relevant to the search was shared.” Of course, this begs the question as to why the ATSB only learned of this information after the RMP report was leaked.
  • The two sources of the primary surveillance radar (PSR) data revealed to be the civilian radar at Kota Bharu and the military radar on Penang Island on Western Hill. The military radar captures are described as “not continuous” with no further explanation.
  • After passing Penang Island, the report says the “Radar data shows the aircraft then headed to the northwest, eventually aligning with published air route N571 from IFR waypoint VAMPI. The validity of this section of the radar data was verified using the track of a commercial flight that followed N571 about 33 NM behind MH370.” This implies the radar captures shown to the NOK in Beijing on March 21, 2014, at the Lido Hotel, are valid. The performance of the military radar was verified by comparing the civil radar data to the military data as another commercial aircraft, likely to be EK343, trailed 33 NM behind MH370.
  • The data recovered from the captain’s home flight simulator is discussed for the first time in an official report. An overview of the data is presented, suggesting a flight from Kuala Lumpur up the Strait of Malacca, and then towards the Southern Indian Ocean (SIO), ending in fuel exhaustion. The flight path recovered from the simulator did not match the MH370 flight paths that were reconstructed from the Inmarsat satellite data.
  • The ATSB pegs the date of the simulator session as February 2, 2014. We know that the deleted file fragments were found in a Shadow Volume with the date February 3, 2014, so likely the session was created on or shortly before that date. It is not explained how the ATSB can be sure the session was created on exactly February 2, 2014, but this would be significant.
  • There is mention that the last data point in the SIO suggested there was a user input of an altitude of 4,000 ft. (The evidence that the simulator’s user manually changed the altitude and other parameters during the flight was first presented in a paper by me and Yves Guillaume.)
  • There is acknowledgement that the simulator data shows a beginning sequence that is similar to the flight the captain flew from Kuala Lumpur to Jeddah, Saudi Arabia, on February 4, 2014. (The significance of the similarities in path and timing between the simulator data and the captain’s flight MH150 to Jeddah was first discussed on this blog.)
  • Although the ATSB does not speculate that the captain was responsible for the diversion, and although the simulator data was not deemed useful for reconstructing possible flight paths of MH370, based on the presentation of this data in the report, it is clear that the ATSB considers the simulator data to be significant evidence.
  • Based on examination of the debris and a detailed study of the final BFO data, the ATSB believes that MH370’s flight ended in a steep, uncontrolled descent. This will serve to limit the distance from the 7th arc for future searches.
  • Although there was an attempt by the official investigators to discern information about the crash site from an investigation of the marine ecology attached to the recovered debris, all results were inconclusive.
  • No new drift analyses are presented. The ATSB reaffirms its belief that the most likely crash site is 35.6S, 92.8E, based on the drift analyses by CSIRO.

So, although there are no new conclusions in this report, there are some interesting new pieces of information. It is also important to note that Malaysia chose to omit key pieces of evidence from the Factual Information (FI) released in March 2015 that are presented in the new ATSB report. These pieces of evidence include details about the radar data, information regarding the simulator data found on the captain’s home computer, and the data related to the registration of the first officer’s cell phone as the aircraft flew near Penang. Although these omissions have been discussed in detail on this blog, perhaps with the release of the ATSB report, more will question why Malaysia chose to not disclose, and even deny the existence of, important evidence.

On a final note, the ATSB chose to acknowledge the contributions of some of the independent investigators, including many that comment here. The ATSB was kind enough to give a special recognition to Blaine Gibson:

The ATSB acknowledges the extensive contributions that many individuals and groups have made during the underwater search for MH370. Many contributors have provided credible, alternate and independent approaches and analysis of the limited data available. In particular, the ‘MH370 Independent Group’ comprised of scientists, researchers and individuals who have cooperated across continents to advance the search for MH370. The ATSB is grateful for their work collectively and individually including Duncan Steel, Mike Exner, Victor Iannello, Don Thompson, and Richard Godfrey. The ATSB also acknowledges the extensive and detailed contributions provided by Simon Hardy, Bobby Ulich and Robin Stevens.

The search for MH370 was significantly advanced after the first debris from the aircraft was found on La Reunion Island in July 2015. The subsequent efforts of Blaine Gibson in searching for and locating MH370 debris on east African coastlines did much to raise public awareness of the importance of the MH370 debris which led to many more items of debris being handed in. Mr Gibson met and communicated with ATSB during his 2015-2016 search expeditions and he is acknowledged for his outstanding efforts in communicating his debris finds to Malaysia, ATSB, the next of kin and the wider world.

Posted in Aviation | 462 Comments »