Archive for the ‘Aviation’ Category

MH370 Safety Report Raises Many Questions


As expected, the Safety Investigation Report on MH370 offered no explanation on the cause of the disappearance. “The answer can only be conclusive if the wreckage is found,” Kok Soo Chon, head of the MH370 safety investigation team, told reporters. However, Malaysian investigators did surmise the plane was intentionally diverted, likely due to unlawful interference by a third party. The Malaysia investigators also believe the disappearance could not have been a deliberate act by the pilots based on their background, training, and mental health.

As all the passengers and crew were cleared,  who was this third party that diverted the plane? How can Malaysian investigators ignore that the captain had the best opportunity and capability to divert the plane? How does the compressed timeline of the diversion fit any other possibility if the diversion was intentional? It is understandable that the Safety Report did not apportion blame to the captain. However, it is not understandable that the report deflected blame to an unnamed third party.

The report, including the appendices, is 1,423 pages, and it will take some number of days for independent investigators to thoroughly pore over the entire contents and provide thoughtful comments and analysis. However, based on an initial review, there are some technical questions and inconsistencies that are apparent:

Radar data

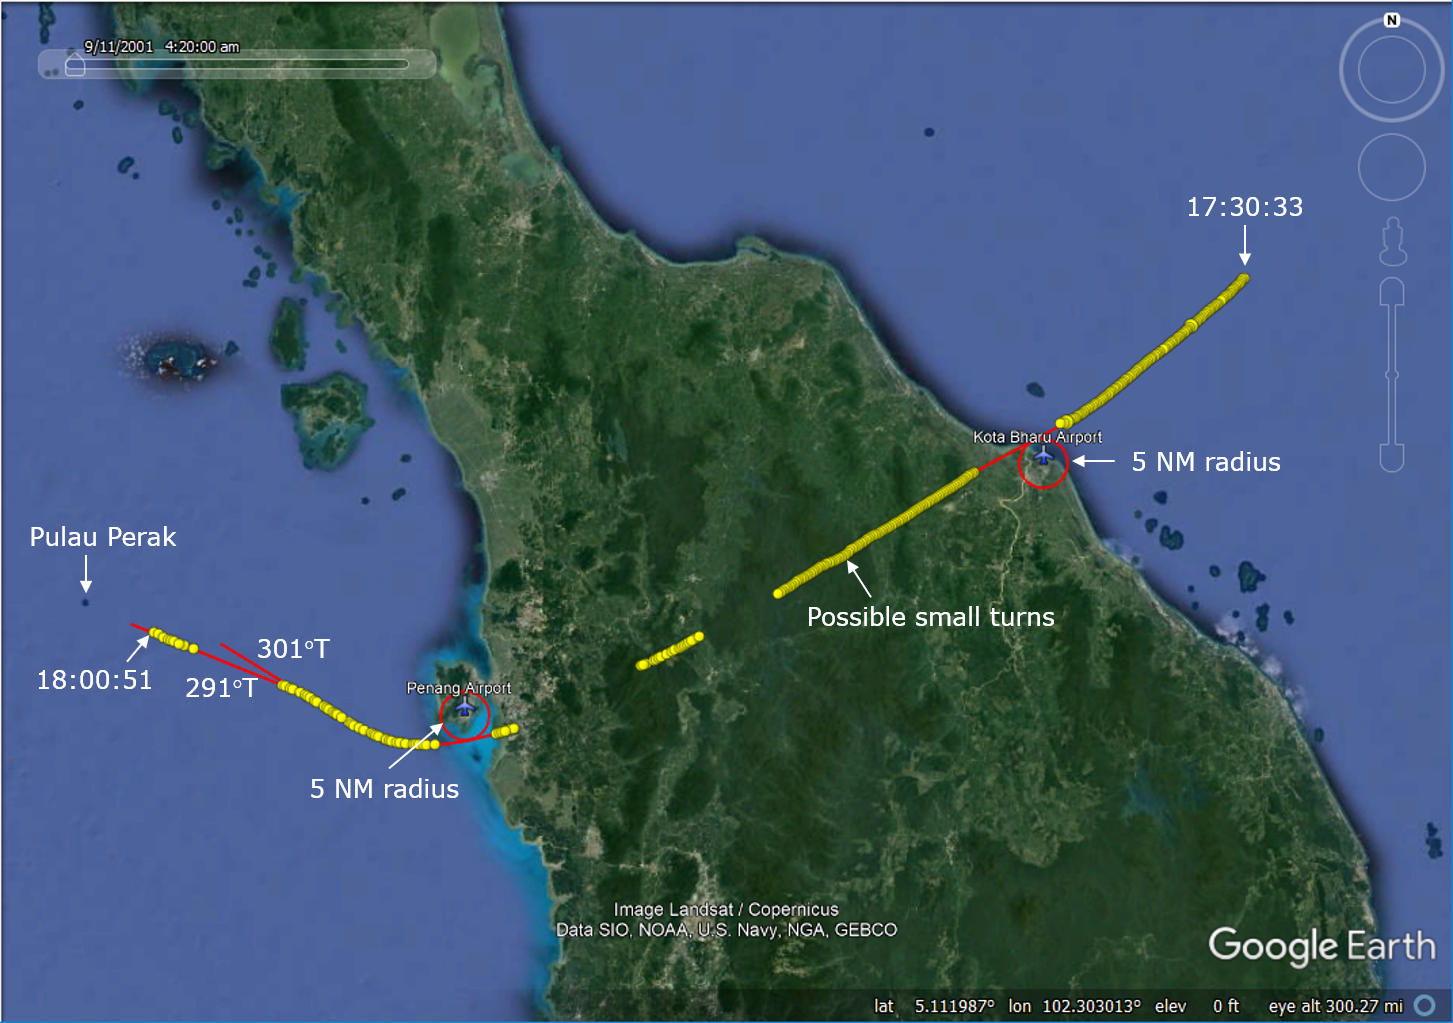
The report provides more details about the radar data, but Malaysia fails to provide the raw military data that would allow an independent review. (The civilian radar data was previously made available through an unsanctioned release, and published in a previous blog post.) The military radar includes speed and altitude data, in addition to latitude and longitude at each capture. However,  some of the variations in speed and altitude are beyond the capabilities of the plane. For instance, the measured speed and altitude at 18:01:59 UTC are 589 knots and 58,200 ft. One minute later, the speed and altitude are  recorded as 492 knots and 4,800 ft. The investigative team was warned that the altitude and speed extracted from the data are subjected to inherent error. The only useful information obtained from the Military radar was the latitude and longitude position of the aircraft as this data is reasonably accurate. How the military radar data can be so far out of calibration is unexplained.

After all this time, we still can’t be sure what radar data is available as MH370 passed over the Malacca Strait. According to the main body of this report, the radar target disappeared at 18:01:59 near Pulau Perak, and re-appeared at 18:15:25 along airway N571 between waypoints VAMPI and MEKAR, disappearing at 18:22:12 about 10 NM past MEKAR. However, in an Appendix 1.6E, Boeing reports that after 18:01:59, there was only one capture at 18:22:12. It appears that the radar data provided to Boeing is consistent with the data provided to the ATSB, but Malaysia claims there were additional captures along airway N571 between 18:15:25 and 18:22:12.

We also can’t be sure when the unidentified radar targets captured over the Malay peninsula were first recognized as MH370. According the Safety Report, On the day of the disappearance of MH370, the Military radar system recognised the ‘blip’ that appeared west after the left turn over IGARI was that of MH370. Even with the loss of SSR data, the Military long range air defence radar with Primary Surveillance Radar (PSR) capabilities affirmed that it was MH370 based on its track behaviour, characteristics and constant/continuous track pattern/trend. Therefore, the Military did not pursue to intercept the aircraft since it was ‘friendly’ and did not pose any threat to national airspace security, integrity and sovereignty. In light of the claim that the military was fully aware of the path of MH370, it is not explained why the initial Search and Rescue operations were coordinated in the South China Sea to the east of Malaysia, and proceeded for some number of days before they were moved west of Malaysia to the Indian Ocean.

Pilot Simulator Data

Citing the Royal Malaysian Police (RMP) report from May 2014, the Safety Report says It was also discovered that there were seven ‘manually programmed’ waypoint4 coordinates … that when connected together, will create a flight path from KLIA to an area south of the Indian Ocean through the Andaman Sea. These coordinates were stored in the Volume Shadow Information (VSI) file dated 03 February 2014. The function of this file was to save information when a computer is left idle for more than 15 minutes. Hence, the RMP Forensic Report could not determine if the waypoints came from one or more files.

What is not mentioned is that certain values that were common to the data sets indicate that these files were likely from the same simulation. This was first documented in a technical paper I co-authored with Yves Guillaume, and summarized in a previous blog post. Also included in the previous blog post were statements from the ATSB indicating that the chronological order of the data sets matches a flight departing KLIA, flying over the Malacca Strait, continuing past the Andaman Islands, turning to the south, and exhausting fuel in the SIO, in the same order that the progressively depleting fuel levels suggest. The time values also indicate that the flight session lasted for about one hour, suggesting the position of the aircraft in the simulation was manually advanced and the fuel levels manually depleted.

There are other strange facts surrounding the simulator data. For instance, Malaysia does not explain why only fragments of the data files were recovered, as the reconstruction of the entire contents of the data files should have been possible using the data in the Shadow Volume. The missing portions of the data files include important information that would be stored in the flight management computers (FMCs), including flight plans. Also, the time stamp data that was included in the data files that were made available to the ATSB by the Australian Federal Police was not included in the RMP report.

The RMP conclusion that there were no unusual activities other than game-related flight simulations is odd considering the extraordinary coincidence that a simulated flight including a departure from KLIA and ending in fuel exhaustion in the SIO was recovered after the disappearance.

Investigation of the Flaperon

After the flaperon was recovered from Reunion Island, which is sovereign territory of France, French scientists performed tests to determine the flaperon’s provenance, to analyze the attached marine biology, to determine its buoyancy and other hydrodynamic characteristics, and to investigate the damage to determine how the flaperon separated from the aircraft. To the French team, it appeared that the flaperon impacted the water while still attached to the aeroplane and that at the time of the impact it was deflected. The implication is that water forces from an attempted ditching caused the flaperon to separate rather than in-flight during a high speed descent. The French were careful to advise that this is only an hypothesis because of the limited data made available to them by Boeing, and because of the complicated dynamics of the impact mechanics.

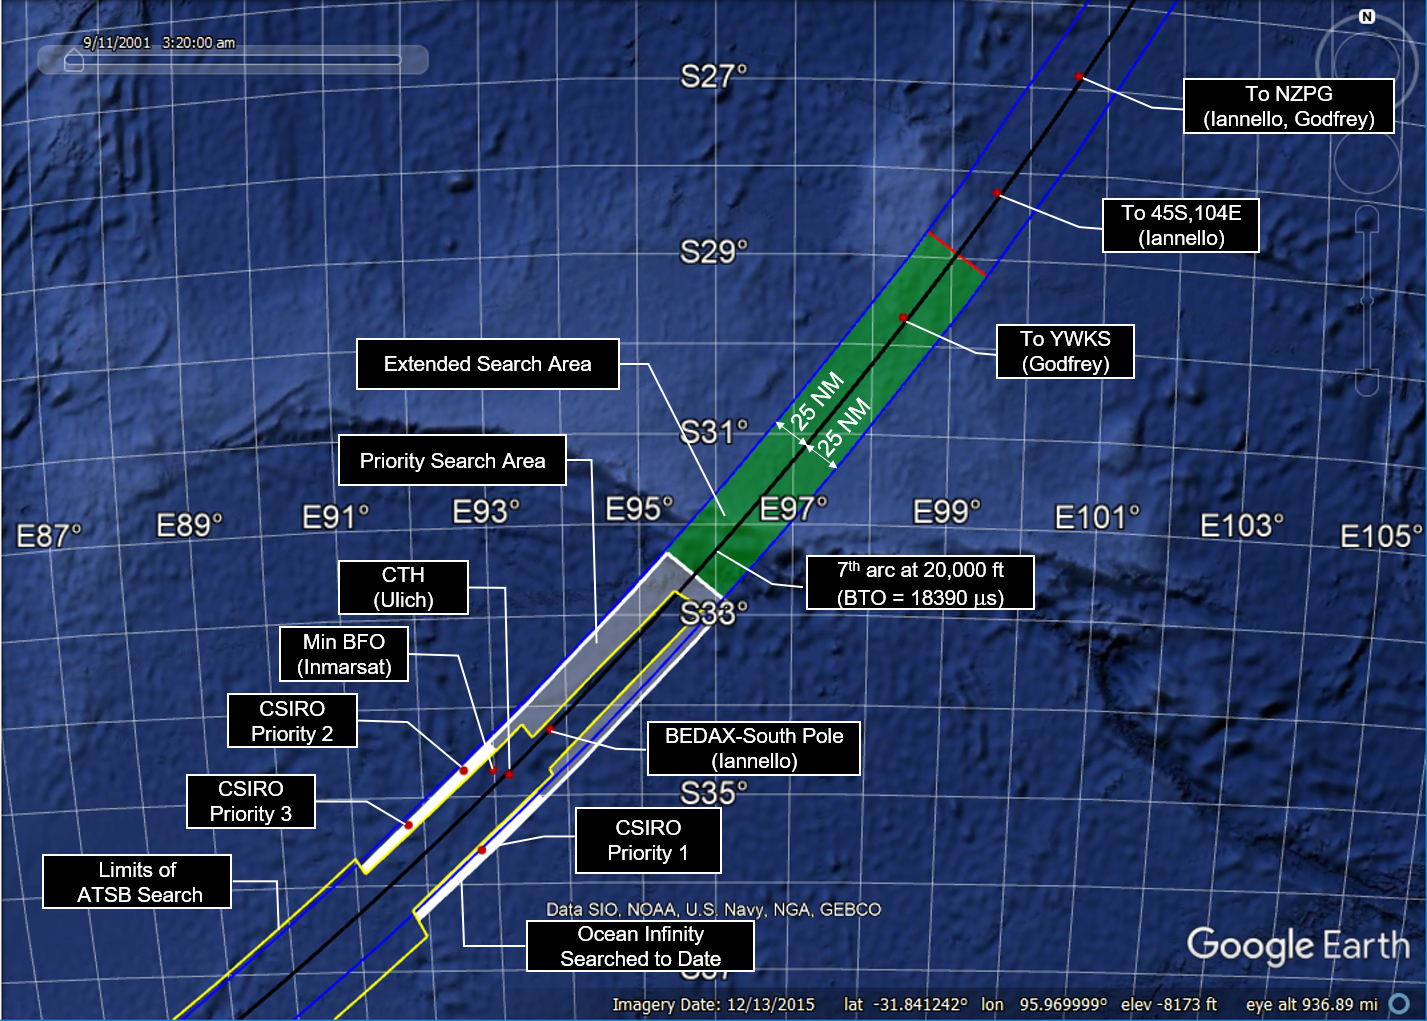
Nonetheless, if it can be proven that the aircraft was in a controlled descent at the time it impacted the ocean, the distance from the 7th arc could be greater than 120 NM, as there could have been a long glide after fuel exhaustion. A controlled descent after fuel exhaustion would also leave open the possibility of pilot navigational inputs after 19:41, and possible paths would include crossing the 7th arc over a large range of latitudes. These unknowns would make it very difficult to define a new search area of a manageable size. For this reason, it is critical that mechanism that led to separation of the flaperon be determined with a higher level of certainty.

First Officer’s Cell Phone Connect

The First Officer’s cell phone registered on a cell tower as MH370 passed to the south of Penang Island. Although it would be unlikely that a cell phone connection would persist long enough to complete a call, a cell phone registration of short duration and at cruise altitude is not that uncommon.

Considering the large number of Malaysian passengers and crew that were likely carrying cell phones compatible with the Malaysian cell network, and with some fraction of those phones likely in an operational configuration during the flight, it is odd that other cell phone registrations did not occur. It is unexplained whether or not a systematic review of the cell phone numbers of all passengers and crew was ever performed.

Final Comments

It is unlikely that another search for MH370 will occur unless a case can be made that there is a reasonable probability of success. Unfortunately, the Safety Report raises more questions than it answers, and it will be difficult to use the information in the report to define a search area of a manageable size. The answers to some questions will not be known until the flight data recorder is recovered. However, the answers to other questions are known to Malaysian authorities today. Any remaining chance to find MH370 squarely rests on the willingness of the new Malaysian administration to cooperatively work with official and independent investigators.

Posted in Aviation | 711 Comments »

Simulated drift of the flaperon after 389 days from 22S latitude (Godfrey).

Introduction

Fellow MH370 Independent Group (IG) member Richard Godfrey has completed a new drift analysis that suggests that MH370 might have crashed further north on the 7th arc than was previously searched. Richard concludes that the recovered aircraft debris from the beaches of East Africa could have originated from potential impact sites as far north as 20.5°S latitude. He is recommending that a new subsea search cover the part of the 7th arc between 25°S and 20°S latitudes based on his new drift analysis. As further justification for a new search to the north, he also cites the reconstructed flight path over Cocos Island ending at 22°S that we discussed in the previous post.

Discussion

The new drift analysis highlights the timing and location of the discovery of four parts that were found with barnacles still attached. These pieces are particularly important because the presence of marine life on a part suggests that the timing of the discovery was close in time to the arrival of the part.  Any marine life that is attached to a beached part either falls off or is picked off due to decomposition and scavenging, so the presence of barnacles is a good indicator that the part was recently beached.

The four parts found with barnacles that were considered in the drift analysis were:

  • The flaperon found on Reunion Island after drifting about 508 days
  • The fragment of the engine cowling (“Roy”) found in Mossel Bay, South Africa, after drifting about 655 days
  • The fragment of the cabin divider found on Rodrigues after drifting about 753 days
  • The outboard flap found in Pemba, Tanzania, after drifting about 835 days

The drift analysis uses the database of buoy positions that are tracked as part of the Global Drift Program (GDP). The data sets from 96 buoys were used to build a model of the Indian Ocean with a spatial resolution of 1° of latitude and longitude, and 1 day of temporal resolution. Both drogued and undrogued buoys were considered. For the flaperon, the drift model also includes an additional 10 cm/s and 1.5% of wind, at an angle to the left of wind at 16°, which were the values that were experimentally measured by CSIRO using a replica of the flaperon.

The figure below (adapted from Richard’s paper) shows the expected time for the flaperon to reach the longitude of Reunion Island for a range of impact latitudes along the 7th arc. Also shown by the shaded area is the actual time (+/- 50 days) for the flaperon to reach Reunion Island. The model predicts that starting latitudes are far north as 19S are possible.

Number of days for the flaperon to reach the longitude of Reunion Island for a range of impact latitudes on the 7th arc. The actual time (+/- 50 days) is shaded. (Adapted from Godfrey)

Richard also considered when debris is predicted to arrive on the shores of the African mainland for various starting latitudes along the 7th arc. The results are shown in the figure below. Also shown by the shaded area is the range of times corresponding to the actual arrival of the engine cowling fragment and the outboard flap, again bounded by +/- 50 days. The model again predicts that starting latitudes are far north as 19S are possible.

Number of days for debris to reach African mainland for a range of impact latitudes on the 7th arc. The actual time (+/- 50 days) is shaded. (Adapted from Godfrey)

Conclusions

The new paper on drift modeling of MH370 debris is interesting in that it gives special attention to those parts found with barnacles still attached, which allows us to estimate the arrival time with better accuracy than for other parts found with little or no marine life.  The paper provides justification for continuing the search further north along on the 7th arc.

Readers interested in learning more about the methodology and the results of the drift model should consult the full paper.

Posted in Aviation | 165 Comments »

An MH370 Flight Path Ending Further North on 7th Arc

Runway on Cocos Island.

Introduction

Now that the recent search effort conducted by Ocean Infinity has ended without finding MH370’s debris field on the seabed, we continue to re-evaluate the evidence and consider other possibilities.

Many researchers that have reconstructed flight paths assume that the aircraft was on autopilot after 19:41. This leads to flight paths that cross the 7th arc at 26S or further south. Now that the 7th arc has been searched as far north as 25S and at a width of at least +/-22 NM, we have to consider the following possibilities:

  1. There are automated flight paths that end north of the 25S latitude that have not been previously considered.
  2. The aircraft was actively piloted after 19:41.
  3. After fuel exhaustion, the aircraft glided without pilot inputs and impacted further from the 7th arc than was searched.
  4. After fuel exhaustion, there was an actively controlled glide that ended outside of the areas searched.
  5. The debris field was scanned but not detected.
  6. The BTO data set was somehow corrupted, and we are not properly interpreting it.

Although we cannot completely dismiss any of these possibilities, and each should be further explored, this article addresses the first in the list.

The challenge in finding automated paths ending further north than 26S is that the reconstructed paths need to curve to the left and decelerate to satisfy the BTO. What follows is one way this can occur while the aircraft is navigating on autopilot with no pilot actions after 19:41.

The automated flight path assumes that the flight computers were programmed to pass near Car Nicobar Airport (ICAO: VOCX) and fly towards Cocos Island Airport (ICAO: YPCC) with an intention to land there. (A route that includes flying towards VOCX, YPCC, and other airports was previously considered by Richard Godfrey.) Here, we assume that after programming the flight computers for a landing at YPCC, there were no further pilot actions. Furthermore, we consider that approaching YPCC, the automated flight plan caused the aircraft to turn to the left to align with the runway, to decelerate, and to fly over and continue past YPCC. This combination of left turn and deceleration is required to match the BTO data.

There are several explanations for why the flight computers might have been programmed for a landing at Cocos Island and then that landing not completed. One explanation is the pilot became incapacitated.  Some possibilities for incapacitation include a physical challenge from crew or passengers, or the aircraft was hit by hostile gun fire leading to rapid decompression of the fuselage. The possibility that MH370 was pursued by a Malaysian fighter jet was the subject of a previous article, and may have relevance.

Assumptions and sequence of events

The reconstructed flight paths are based on the following:

  1. FMC was programmed for automated flight between Car Nicobar (VOCX) and a landing at Cocos Island (YPCC) using the LNAV and VNAV autopilot modes at cruise altitude.
  2. The FMC was programmed for landing on Runway 15 using the RNVZ15 standard approach with PCCNE selected as the transition waypoint. (The selection of a transition waypoint does not significantly change the results.) In the aircraft’s navigation database, the approach would be defined as: APPROACH RNVZ15 FIX PCCNI AT OR ABOVE 1500 FIX PCCNF AT OR ABOVE 1500 FIX OVERFLY PCCNM 55 RNW 15 FIX PCCNH TRK 152 UNTIL 1500; TRANSITION PCCNE FIX PCCNE AT OR ABOVE 1500 SPEED 210
  3. Flying between VOCX and YPCC, the VNAV target speed was either LRC, ECON, the last speed constraint from the flight plan, or a speed selected in a VNAV screen. There was no speed intervention, i.e., the MCP speed window was closed.
  4. At the Top of Descent (ToD) about 110 NM from PCCNE, the pilot did not reset the altitude to a lower altitude, which constrained the aircraft to continue at the existing cruise altitude.
  5. At about 38 NM from PCCNE, the descent path calculated by the FMC would have reached 10,000 ft. The target speed would have reduced to 240 KIAS in accordance with the FMC’s default speed transition at 10,000 ft, even though there was no change in altitude from the cruise altitude.
  6. Approaching PCCNE, the VNAV target speed was automatically reduced to 210 KIAS in accordance with the programmed speed restriction at PCCNE, or the minimum maneuver speed (MMS), whichever is greater, with the aircraft remaining at cruise altitude. MMS was about 210 KIAS.
  7. At PCCNE, the aircraft turns towards waypoint PCCNI, and aligns with the runway on a track of about 152°M.
  8. Upon passing the runway and the final waypoint PCCNH, the FMC reaches an END OF ROUTE, the plane continues at the cruise altitude on a constant magnetic heading until fuel exhaustion. As the speed constraint for the runway is less than the MMS, the MMS becomes the target in the MCP speed window, and this speed is maintained for the remainder of the flight until fuel exhaustion.

The input variables that were varied are:

  • The starting position at 19:41. Since we are constraining the path to a great circle between VOCX and YPCC, only the latitude at 19:41 needs to be specified.
  • The VNAV mode, i.e., whether in ECON, LRC, or constant airspeed. If in ECON mode, there is an associated Cost Index (CI), which is based on the cost of fuel and time. For ECON mode at a given CI, and for LRC mode, the optimum speed varies as a function of aircraft weight and altitude. VNAV also commands throttle and pitch so that the speed and flight path adhere to any speed and altitude constraints programmed in the flight plan or selected in the VNAV screen.
  • The cruise altitude, which is assumed to be constant until the flame out of the first engine.

As the aircraft passes YPCC on a constant magnetic heading, the magnetic variation tends to slightly curve the flight towards the east as the magnetic variation increases from about 2.4°W near YPCC to about 2.7°W near 22 S latitude on the 7th arc. On the other hand, after passing YPCC, the wind is initially towards the west at 19 knots and 266°T, but weakens and changes direction towards the east between 16S and 17S latitudes so that at 18S latitude, it is about 10 knots at 81°T.

Results

A range of paths can be generated by sampling the input space and incorporating the uncertainty in BTO values, BFO values, wind, temperature, and MMS. One solution that is shown below is at FL320 and M.819, with a position at 19:41 about 25 NM south of VOCX.

Automated flight path passing over YPCC.

At the time the aircraft reaches the approach waypoints for YPCC, the MMS is about 210 KIAS, and remains at this speed for the rest of the flight. The aircraft would cross the 7th arc at about 22.0S latitude, which places it well north of what was previously searched.

The following table summarizes the flight parameters after 19:41 for this case (M.819 at FL320). The RMS error for the BTO is 26.0 μs and the RMS error for the BFO is 6.4 Hz with a mean error of -5.1 Hz:

Discussion

Ocean Infinity has expressed an interest in continuing the subsea search for MH370 at some time in the future. Options include

  • Scanning along the 7th arc at latitudes north of 25S
  • Scanning along the 7th arc at previously searched latitudes, but at a greater distance perpendicular to the arc
  • Re-scanning areas where the detection of the debris field might have been missed

Ultimately, the decision where to search must consider other aspects such as end-of-flight dynamics, drift modeling, surface search efforts, and fuel consumption, none of which were considered here. As such, this article is not a recommendation as to where to search next. Rather, this article was meant to provoke discussion about the possibility of an automated flight ending much further north on the 7th arc than was previously considered. Also, the article provides additional data for scenarios in which the pilot intended to land on Cocos Island but did not take the actions required for landing.

Acknowledgement

I am grateful for comments received from Mike Exner, Richard Godfrey, and @Andrew.

Update on July 4, 2018

Here are the results for another path, including the results from a fuel analysis. The path assumes that after a hold at Car Nicobar at FL250, the aircraft proceeds towards YPCC at FL320 and M0.8, and crosses the 2nd arc about 53 NM south of Car Nicobar. The following table summarizes the flight parameters after 19:41 for this case (M.8 at FL320). The RMS error for the BTO is 25.3 μs and the RMS error for the BFO is 6.0 Hz with a mean error of -4.6 Hz:

The fuel model is an improved version of a model I developed over one year ago, and is based on the drag-lift curves for a B777-200 that was presented in Ed Obert’s textbook entitled “Aerodynamic Design of Transport Aircraft”, with fuel flow – thrust relationships developed from descriptions in Walt Blake’s Boeing textbook entitled “Jet Transport Performance Methods”. Previously, I found that the model predicted the tabulated fuel flow data for LRC and Holding speeds with an RMS error of about 1%. The present model improves the prediction by introducing a correction factor that forces the calculated fuel flow to the exact tabulated values at the LRC and Holding speeds, and linearly varies the correction factor as a function of Mach number between those speeds. As such, the accuracy of the model between the Holding and LRC speeds should be very high. Also added to the model are calculated flow rates for climbs and descents, which assume full thrust and idle thrust, respectively, with vertical speed and flight path angle (FPA) directly calculated from the thrust and drag models.

The results of the fuel analysis are tabulated in this Excel file, which includes the remaining fuel at one minute intervals from 17:07 UTC until fuel exhaustion. At each time, the fuel flow is calculated as a function of weight, altitude, speed, and temperature. Assuming both engines fail at exactly the same time, fuel exhaustion is predicted to occur at 00:14 UTC. If the right engine fails before the left, the final (left) engine will fail at about 00:17. The predicted time of fuel exhaustion is consistent with our assumed fuel exhaustion at 00:17, considering the uncertainty in the actual flight path, the engine PDAs, and the meteorological conditions.

Posted in Aviation | 549 Comments »

Sixty Minutes Australia Story on MH370 is a Sensation

On Sunday night, Sixty Minutes Australia aired an episode on the disappearance of MH370. Included was a panel of five experts, consisting of Canadian crash investigator Larry Vance, US air safety expert John Cox, British airline captain Simon Hardy, former ATSB commissioner Martin Dolan, and Australian oceanographer Charitha Pattiaratchi. Before airing, the episode was heavily promoted with teasers claiming there would be “groundbreaking revelations”, the “passengers’ final seconds”, and a “forensic twist”.

Unfortunately, after watching the episode twice, I found nothing in the way of new evidence or insights. What I did see were some of the experts confusing speculation with facts, and cherry-picking evidence to support their pet theories while carefully omitting contradicting evidence.

Despite the obvious shortcomings of the episode, the mainstream media is covering it extensively with headlines like “Experts Have Finally Solved the Mystery Behind the MH370 Disappearance”. The sensational nature of the story makes it attention-grabbing, and hiding behind the Sixty Minutes brand name, there is little or no attempt to fact-check.

A large part of the episode was devoted to Larry Vance’s theory that the captain hijacked the plane and flew it to the SIO to hide it. That plan included a successful ditching with the engines running and the flaps extended, leading to the sinking of the aircraft with the fuselage intact. (This “new” theory was already presented by Mr Vance in a Sixty Minutes story that aired in July 2016.) This ditching would produce only a small amount of floating debris. Mr Vance also refers to the damage to the trailing edges of the right flaperon and right outboard flap and the lack of damage to the leading edges of those parts. He believes this pattern of damage conclusively shows that there were hydrodynamic forces as those parts were dragged across the water surface during the ditching.

What was omitted is that we do have pieces of evidence that refute some of Mr Vance’s claims, and should at least cast a shadow of doubt on many of his conclusions. Briefly,

  • Crash investigators at the ATSB have examined the right flaperon and the right outboard flap that were recovered and determined that some damage on both parts was caused by mutual contact, and the location of that contact could only occur with the flaps retracted.
  • Recovered parts from the passenger cabin show deformation from a high energy impact and not a successful ditching.
  • The final log-on of the SATCOM at 00:19 suggests there was a disruption of electrical power to the SATCOM, which is consistent with fuel exhaustion of both engines, and not a ditching with the engines running. It’s not clear in his scenario what caused the log-on.
  • The damage to the trailing edges of the flaperon and flap could have been caused by aerodynamic forces occurring during a high speed descent. The lack of damage to the leading edges can be explained by separation of these parts from the aircraft prior to impact with the ocean.

Strangely, in the episode, Martin Dolan does not challenge Mr Vance’s scenario with the contradictory evidence published by the ATSB. Perhaps those challenges were made, and they were not included in the episode. Or, perhaps Mr Dolan is not sufficiently familiar with the technical analyses of the ATSB where he could confidently refute some of Mr Vance’s claims.

The theories of Simon Hardy also were featured in the episode. Mr Hardy, like Mr Vance, believes that the captain hijacked the plane, but he believes the plane glided a long distance after fuel exhaustion rather than a ditching with the engines running. The possibility of a glide suggests a crash location at a distance from the 7th arc that is well beyond what was searched. His claim that military data shows that MH370 was flown along the borders of Malaysia and Thailand is presented as shocking new evidence, when in fact the turnback flight path across the Malay peninsula has been known to the public within weeks of the disappearance, and the implications have been widely discussed. (The precise flight path flown as captured by civilian radar has only been recently published, and was the subject of the preceding blog post.) Mr Hardy also demonstrated on a flight simulator that it is possible for a skilled pilot to recover from a high speed descent that matches the satellite data, which was not in dispute, although he does downplay the importance of gently working the controls and applying speedbrakes to help arrest the descent and prevent overloading of the lift and control surfaces. (Why a pilot would first enter into a steep descent, then recover and maximize the gliding distance, was not explained.) At another point, he claims to know exactly where MH370 crashed, although he neglects to state that all drift models suggest a crash point much further north.

In the episode, Mr Hardy once again promotes his theory that MH370’s flight path as it flew south of Penang Island shows indication that the captain turned to the right, lowering the right wing, and allowing the captain to have a final, sentimental view of Penang before leaving Malaysia forever. In fact, using the recent radar data, we can deduce that at the point of closest approach to Penang, MH370’s wings were either level or only slightly banked. After passing Penang, there was a turn to the right followed by a turn to the left, but to conclude that this was an emotional farewell is pure speculation, and weakens his theories.

Although I disagree with some of Mr Vance’s and Mr Hardy’s conclusions, I am in general agreement that the disappearance was likely an intentional diversion and not likely the result of a series of mechanical failures. After reviewing many accident scenarios proposed by some very bright minds, I have yet to see an accident scenario that did not require a sequence of very unlikely events. On the other hand, a deliberate diversion requires no unlikely events, even if we might not understand the motivation for many of the intentional actions.

If the diversion was intentional, the captain becomes the likely suspect, as he had the skill and the best opportunity to divert the aircraft. In addition, as discussed and analyzed in a previous blog post, the incriminating evidence found on his home computer of a simulated flight to the Southern Indian Ocean would be an extraordinary coincidence if the captain was not somehow involved in the disappearance.  There is certainly not enough evidence for a legal determination of guilt. However, I believe there is sufficient evidence to make him the prime suspect.

Perhaps the Sixty Minutes episode did have value in that it did not shy away from presenting what many believe is the most likely scenario, even if some of the conclusions from the experts were either unfounded or premature.

The episode comes at a time when Ocean Infinity is in the final weeks of the seabed search for MH370. If not found, and if there is a willingness to conduct additional searches next year, a decision has to be made whether to prioritize areas along the 7th arc that are further north, or to revisit previous latitudes but search further away from the arc, or to revisit areas that might have been insufficiently scanned previously.  A strong case for the possibility of a glide after fuel exhaustion would support searching wider (+/- 100 NM) from the 7th arc.  Unfortunately, the size of the search becomes unreasonably large unless there is rationale to support a narrow range of latitudes along the 7th arc.

On a final note, I have been asked whether the defeat of the incumbent party in the recent Malaysian elections could lead to a more thorough investigation of the events surrounding MH370. Although it is possible, the winning candidate and former Prime Minister, Mahathir Mohamad, has previously supported the unlikely theory that MH370 was diverted remotely using secret Boeing technology embedded in the flight controls. While this might indicate his willingness to challenge the official narrative, it also might demonstrate his willingness to use the MH370 for political gain rather than seek the truth. Meanwhile, his heir-apparent, former Deputy Prime Minister Anwar Ibrahim, had family and political ties to MH370’s captain, and those ties might taint future investigations. On a positive note, it is possible that any whistleblowers that were previously reluctant to come forward might now feel less threatened.

Posted in Aviation | 820 Comments »

The Civilian Radar Data for MH370

Civilian radar data after transponder was disabled. (Click to enlarge.)

We know that MH370 was captured by civilian and military radar sites before and after the transponder was disabled at 17:21 UTC. However, Malaysian authorities have chosen to release these data sets only as low resolution images that have imprecise position information with few timestamps. The DSTG did choose to publish in its Bayesian analysis the speed and track data that was derived from radar data that was provided to them by Malaysia. However, the DSTG presented the speed and track data after applying a Kalman filter to remove noise. It’s unknown whether that Kalman filter produced artefacts in the graphical presentation of that data.

We now have what we believe are the data sets for the primary surveillance radar (PSR) and secondary surveillance radar (SSR) from Malaysian civilian radar assets. The PSR data is of particular significance because it provides additional insight about how MH370 was flown after the transponder was disabled at 17:21 UTC. The data was publicly released by fellow IG member Mike Exner. The military radar data remains unavailable.

The data begins at 17:30:33 when the civilian radar installation at Kota Bharu Airport (WMKC) detected MH370 traveling back towards the Malay peninsula about 58 NM from shore. The last radar target was captured by the civilian radar installation at Butterworth Airfield (WMKB) after MH370 had passed to the south of Penang Island and was tracking northwest up the Malacca Strait towards Pulau Perak.

Some initial observations about the data:

  1. The PSR data is similar to the civilian radar data that was graphically presented in the Factual Information (FI) from March 2015. However, while the last civilian radar capture in the FI was at 17:51:47, the new data set has captures until 18:00:51.
  2. The path derived from the Kota Bharu radar data is not straight. More analysis is required to determine if this waviness indicates that there were pilot inputs from manual flying, pilot inputs to the selected heading with autopilot engaged, or inaccuracies of the radar data.
  3. The path was tangent to a 5 NM radius for both Kota Bharu and Penang Airports. This may indicate that these airports might have been displayed as fixes in the navigational display (ND) with a radius of 5 NM and used as navigational references.
  4. After passing to the south of Penang Island, the plane first tracked towards 301ºT, and then changed to 291ºT, which aligned with Pulau Perak and roughly towards VAMPI.
  5. The groundspeed data as derived from the radar data is noisy, reflecting uncertainty in the value of the timestamp as well as the range and azimuth for each capture. In light of the uncertainty, the average speed was calculated for five of the six segments of radar captures, and shown by the red line in the figure below. (The time interval of the shortest segment was only 24 s, and deemed to short to calculate the speed with a useful level of precision.) The average speed for the second and third segments are 527 knots and 532 knots, respectively, which suggests the plane was flying close to Mmo=0.87. For instance, with a tailwind of 12 knots and a temperature offset of ISA+10.3K, a groundspeed of 527 knots converts to M0.87. At the Mmo/Vmo crossover altitude of 30,500 ft, a groundspeed of 532 knots converts to M0.86. This suggests that after the aircraft flew past Kota Bharu, it was at the upper end of its operating speed range, and possibly at times beyond it.

Calculated groundspeed as derived from the civilian radar data. (Click to enlarge.)

I know that independent investigators that contribute here and elsewhere will continue to analyze the data to better understand how MH370 was flown before it completely disappeared from all radar sites.

Update on April 12, 2018: The plot of groundspeed was updated by removing the trend lines and replacing them with average speeds over segments. In light of the noise on the speed calculations, this is more appropriate. The estimated peak groundspeed reduced from 545 knots to 532 knots. The corresponding text in (5) was also updated to reflect this change.

Update 2 on April 12, 2018: Here is an Excel file for those wishing to see the basis for my calculations. Please let me know if corrections are required.

Posted in Aviation | 1,114 Comments »

MH370 Search Update – Mar 18, 2018

Ocean Infinity’s search progress, from Richard Cole.

Recent Activity

Seabed Constructor, the vessel operated by Ocean Infinity to scan the seabed in search of MH370, is returning to port in Fremantle, Western Australia, to refuel, change crews, and resupply. Constructor is completing the second of three or four swings, each swing lasting about six weeks. So far, there have been no promising sonar “contacts” that might represent the debris field of the missing aircraft.

There remains about 3,000 sq km of seabed to search in the area that the ATSB and CSIRO designated as a priority. After that, the extended search area along the 7th arc would require scanning about 46,600 sq km to reach north to around 29S latitude if the width of the search was 25 NM on either side of the 7th arc. That will require more than one additional swing to complete. In fact, it could prove challenging to complete with even two additional swings, depending on the weather and how well the eight autonomous underwater vehicles (AUVs) perform. Although not publicly stated, there are indications are that at least one of the AUVs is having technical problems.

What We Know So Far

Any scenario that leads to a particular location (a “warm spot”) is based on a set of assumptions, and the failure to find the debris field in proximity to this location means that one or more of those assumptions are false. So we can be fairly certain that the large, blurry objects seen in the French satellite images were not from MH370, as the corresponding impact locations calculated by CSIRO were searched without success. Also searched was the warm spot that was calculated by assuming that the aircraft flew until fuel exhaustion on a path towards the South Pole. Unless an interesting contact was found but not yet disclosed, this scenario also can be dismissed.

In the coming weeks, other scenarios will be searched, including the impact site near 30S latitude that is based on two floating debris fields that were spotted during the aerial surveillance, and discussed at length in a previous post.

Reasons Why the Debris Field Has Not Yet Been Found

Although the area already scanned by Seabed Constructor was designated the highest probability by the ATSB and CSIRO, there are reasons why endpoints outside of this area are still possible.

  • A descent at 18:40 followed by a holding pattern, excursion, or other “loiter” before the turn to the south could mean the plane impacted along the 7th arc to the north of the priority area that has been searched. The last radar target was captured at 18:22, and after 18:28, the next ping arc derived from the BTO data is known at 19:41. There is simply no way to be sure of the path of the plane during this interval.
  • A shift in oscillator frequency of the satellite data unit (SDU) of the SATCOM, which would change the value of the fixed frequency bias (FFB) that is used to convert the location and speed data into a BFO that can be compared with the measured BFO values. In a nutshell, if the FFB shifted by +7 Hz after the power up at 18:25, endpoints as far north as 27S are allowed by the BTO and BFO data. It turns out there is an effect called “retrace” that causes oscillators that are powered down, cooled, and powered up to shift in frequency, and there are indications that a retrace shift of about -4 Hz occurred while 9M-MRO was on the ground at KLIA before the MH370 flight. A similar shift, but in the opposite direction (up) might have occurred due to the inflight power cycling.
  • Pilot inputs after 19:41 might have altered the path. The continuous, smooth progression of the BTO and BFO data suggests automated flight with few or no pilot inputs until fuel exhaustion. However, there is a remote possibility that the smooth progression of values was produced by a more complicated path that by chance replicated the simplest of paths.
  • There is also the possibility that the previous search was as the correct latitude along the 7th arc, but the width of +/- 25 NM from the 7th arc was not sufficient. The final two BFO values indicate a steep, increasing descent that if continued would mean the plane impacted close to the 7th arc. The debris is also consistent with a high-energy impact. However, it is possible, albeit unlikely, that a skilled pilot carefully recovered from the high-speed descent, regained altitude, and glided for some distance beyond 25 NM.
  • Although some of the area north of the priority search area was searched by aerial surveillance in the weeks following the disappearance, the search area was large and the coverage was spread thin. Also, some debris was seen from air, but never recovered due to the distance of ships supporting the search effort.

Simulation of Seabed Constructor’s Search Pattern

Finally, Richard Cole, who has carefully been tracking and analyzing the search patterns of Seabed Constructor, has produced a short video which shows the path of the vessel and how it relates to the launch and recovery of the AUVs. Richard is quite talented at extracting a lot of information from small amounts of data, and this video, like all his work, is commendable.

Posted in Aviation | 1,124 Comments »

MH370 Search Update – Feb 16, 2018

Status of current underwater search. (Click on image to enlarge.)

Recent Activity

After a short stop in Fremantle for to re-fuel, re-supply, and change crew, Seabed Constructor, operated by Ocean Infinity, is back searching for the wreckage of MH370. Ocean Infinity is under contract with Malaysia to use its team of eight autonomous underwater vehicles (AUVs) to scan the seabed in the Southern Indian Ocean (SIO) in search of wreckage from the aircraft. Under the terms of the contract, Ocean Infinity will only be paid if the wreckage is found. The search is occurring in multiple six-week long “swings”, of which the first swing has been completed, and the second swing is just beginning. Subsequent swings will also require a stop in Fremantle for servicing.

For the first swing, Ocean Infinity began by searching the 25,000 sq km of seabed that ATSB and CSIRO have designated as the priority area (shown in white in the figure). So far, Constructor has scanned about 7,500 sq km of seabed, including 5,000 sq km within the priority area that was designated by CSIRO as the “primary area” (solid white). There remains about 20,000 sq km of the priority area that is unscanned (translucent white). Beyond that is the extended search area, which reaches to about 29S latitude along the 7th arc (translucent green), and is expected to be searched at a width of +/- 25 NM from the 7th arc. Under ideal conditions, the eight AUVs are capable of scanning about 1,200 sq km of seabed each day. Recognizing the possibility of weather and operational constraints,  a more realistic expectation might be about 25,000 sq km per swing. However, until Ocean Infinity gains more operational experience, it is difficult to predict what scan rates are realistically achievable.

With the sparse and imprecise evidence we have, it is impossible to assign a high level of certainty to any impact site, as the satellite data and the drift models allow a broad range of possibilities. So, it becomes a numbers game–the more area searched, the higher probability of finding the wreckage. However, within that broad range, there are some “warm spots” that are based on assumptions about navigation inputs and other evidence.

What We Know So Far

In the previous post, I estimated the probability of finding the wreckage as 67%, assuming all of the priority and extended areas are scanned. (This probability will vary some depending on how far north the search reaches.) Considering that only 5,000 sq km of that area were scanned in the first swing, and assuming that there are equal probabilities within that total area, the probability of finding the debris field within the primary area would be about 4.4%. Considering this low percentage, it should come as no surprise that the wreckage has not yet been found, and we are far from the point of re-thinking the search strategy.

Within the area searched so far, there are three warm spots that CSIRO has designated as priorities, based on satellite images of objects that could have been MH370 debris, and from drift models that estimated the points of impact from the location of these objects. Last August, the highest priority location (CSIRO Priority 1) was described by CSIRO’s David Griffin in these words: We think it is possible to identify a most likely location of the aircraft, with unprecedented precision and certainty. Unfortunately, all three of these locations have now been scanned with negative results. Unless positive news is being withheld, the confidence expressed by CSIRO was unfounded. This is not a total surprise: The objects captured by the satellite images had too much surface area to likely be from MH370, and the location of the potential impact sites were  not consistent with the high speed descent suggested by the final BFO values.

Two other warm spots have been at least partially searched in the first swing. The first is an impact location near 34.7S latitude that Inmarsat derived by minimizing the BFO error. More recently, Bobby Ulich proposed a location near 34.8S latitude that was based on a path of constant true heading (CTH). We should know soon whether or not these warm spots are completely eliminated.

Another warm spot that should be searched during the current swing is based on a great circle path between waypoints BEDAX and the South Pole. I first proposed this path in August 2014, and I still consider it to be among the best possibilities because of the excellent fit of the BTO and BFO data, and because of the simplicity of navigating in the direction of true south. That said, despite the attractiveness of this scenario, we don’t know whether the aircraft was navigated in this manner, so it remains one of many other possibilities.

As shown in the figure above, there are warm spots that reach as far north as 27S latitude that are based on certain navigational inputs. Although the match to the BFO data is not as good for paths ending that far north, the BFO error is still well within what was recorded for previous flights of the 9M-MRO airframe. The drift models also favor an impact point further south than 27S. However, for debris discovered on the beaches of Eastern Africa, there could have been a considerable delay between the time of discovery and the time of arrival near the shore, and this uncertainty reduces the accuracy of the drift models.

In a nutshell, although the previous search swing has eliminated some possibilities, we are still very early in the search process, and it is much too early to draw any conclusions.

Unknown Activities of Seabed Constructor

The figure below from Richard Cole shows the recent behavior of Seabed Constructor. At the end of the last swing, Constructor returned to the outer leg of the primary search area, which had been previously scanned. After following the pattern of a 5-km circle, it retraced what we believe was part of a previous path of an AUV, and then disabled its AIS data, which made it impossible to remotely track. When the AIS was eventually re-enabled three days later, Constructor had left the search area, and was traveling back to Fremantle. What activities occurred during these three days is not known.

Seabed Constructor’s path, as adapted from the work of Richard Cole. (Click on image to enlarge.)

At the start of the search for the current swing, Constructor again returned to the southern end of the outer leg of the primary search area, and seems to be actively searching the seabed in this location. The activities in the current area are likely related to activities that occurred when the AIS was disabled during the last swing.

Some possibilities that have been proposed by others to explain the behavior are:

  • Constructor is re-scanning areas that had poor quality or missing data either because of malfunctioning equipment or challenging terrain
  • There are one or more promising points of interest that are under being comprehensively investigated
  • A search is underway to locate equipment that was lost in the previous swing
  • Some combination of the previous possibilities

Whatever the reason for the unexplained behavior, it is noteworthy that there was no reference to the behavior in either of the last two weekly updates from Malaysia. As Malaysia has two observers on Seabed Constructor, Malaysia is certainly aware of the surrounding circumstances. Malaysia’s decision to omit pertinent information in the weekly reports further erodes the public’s confidence in the Malaysian-led investigation. Credibility is not possible without transparency.

Posted in Aviation | 780 Comments »

The Search for MH370 Begins Again!

What many of us have been encouraging has finally transpired–the seabed search for the wreckage of MH370 has been re-started. The search vessel Seabed Constructor has just arrived in the new search area, outfitted with a team of eight autonomous underwater vehicles (AUVs). Ocean Infinity, the company under contract with Malaysia to conduct the search, has agreed to start by searching the 25,000 square kilometers identified by the ATSB and CSIRO as most likely. Included in that area are three locations that CSIRO has identified as high priority, as determined from satellite images of floating objects and complex drift models. Last August, the highest priority location was described by CSIRO’s David Griffin in these words: We think it is possible to identify a most likely location of the aircraft, with unprecedented precision and certainty. This location is 35.6[degrees south], 92.8 [degrees east]. 

At Ocean Infinity’s touted scan rate of 1,200 square kilometers per day, the entire 25,000 square kilometers would be completed in 21 days of searching, and the highest priority area of 5,000 square kilometers would be completed in less than a week.

The nominal location of the 7th arc that is shown in the figure above is a based on the assumption that the last transmission from the aircraft occurred at 20,000 ft, and our best estimate of the final BTO value is 18390 μs. The final two BTO values that were used for the best estimate occurred when the SATCOM of MH370 initiated a log-on to Inmarsat’s satellite network at 00:19 UTC on March 8, 2014, minutes after the engines stopped due to fuel exhaustion. (The re-boot of the SATCOM likely occurred after the APU automatically started and briefly supplied electrical power.)

I performed a statistical analysis of previous log-on events that occurred on March 7, 2014, including those that occurred on flight MH371 from Beijing to Kuala Lumpur. Using the results of this analysis, the final two BTO values from MH370 were first corrected and then appropriately weighted based on their respective uncertainties in order to arrive at the best estimate of 18390 μs.  The procedure was briefly described in a previous comment of mine.

Also shown in the figure are two other arcs that are positioned at +/- 25 NM from the nominal location of the 7th arc. These might serve as limits for some parts of the search. The figure shows that the +/-25 NM limits do not correspond to the boundaries of the 25,000 square kilometer area that was previously identified. In fact, the highest priority location identified by CSIRO (labeled CSIRO Priority 1) falls slightly outside of the 25-NM outer limit.

If not found in the initial 25,000 square kilometer area, the contract with Ocean Infinity indicates that the search will continue further northeast along the 7th arc. Likely, the search will continue along the 7th arc as far northeast as time and weather permit.

I often get asked whether I believe this search will succeed in finding the wreckage of MH370. I long ago arrived at the conclusion that based on the evidence we have, it is impossible to determine any one location with a high level of certainty, and I stopped trying. The satellite data and the drift models allow a broad range of possible impact sites. Within that range, there are at best some “warm spots” that are based on assumptions about navigation inputs. So, it becomes a numbers game–the more area searched, the higher probability of finding the wreckage. I subjectively believe there is a 33% chance of finding the wreckage in the first 25,000 square kilometers. If there is time and money to search at +/- 25 NM from the 7th arc all the way to a latitude of 26S, I subjectively put the chances of success at around 67%. That might seem like bad odds, but realistically, that’s higher than they’ve ever been.

The highest priority location identified by CSIRO is about 66 NM from Seabed Constructor’s present location, and might be reached within the next day. We’ll all be watching.

[Don Thompson reminds me that the data from an AUV mission is available only after the AUV is recovered after the completion of a dive, which could last 2+ days, based on the endurance of the batteries. It might take another 18 hours to analyze the data. That means that although the AUVs could reach “CSIRO Priority 1” by tomorrow, we would not know until Wednesday or Thursday whether or not the debris field was found.]

Posted in Aviation | 1,025 Comments »

Ocean Infinity Will Soon Start New Search for MH370

A new article by Hal Hodson on the search for MH370 was today published in the The Economist, and gives more details surrounding Ocean Infinity and its exploration technology. The article discloses that:

  • Host vessel Seabed Constructor, owned by Swire and under lease by Ocean Infinity (OI), has been fitted with eight underwater autonomous vehicles (AUVs) for the search.
  • The search will be conducted under the basis of “no find, no fee”, which means that OI will bear the economic cost of not finding the wreckage.
  • Even though the contract with Malaysia has not yet been signed, Ocean Infinity will proceed with the search in order to take advantage of the favorable weather in the Southern Indian Ocean in January and February.
  • The expected scan rate that is achievable using eight AUVs is 1200 sq km per day.
  • Some additional testing of the scanning capability of the AUVs will be performed en route between the imminent departure from Durban, South Africa, and the arrival to the search area.
  • The scanning will begin in the area designated by the ATSB as most likely (the 25,000 sq km) around 35S. If unsuccessful, the search will proceed towards 30S latitude.
  • The advice to proceed north towards 30S latitude came from independent experts. (Readers here might be able to guess the names of the independent experts that have advised OI.)
  • Rather than communicating with the autonomous surface vehicles (ASVs), the AUVs will communicate with the host vessel to periodically recalibrate the onboard inertial guidance system.
  • If the flight data recorder (FDR) is found, it will be recovered and surrendered to the Australian authorities.
  • Recovery of wreckage would require a separate agreement with the Malaysian authorities.

For readers of this blog, there are few new facts presented. Probably the most significant new fact is OI’s decision to start the search without a signed agreement.  The article is helpful in that it will provide useful information to a larger, broader audience, and will increase the overall awareness of the new search. There will also be renewed questions as to why Malaysia has delayed signing the agreement with OI.

Update on Jan 3, 2018: Malaysian Transport Minister Liow was asked about recent developments regarding Ocean Infinity and the renewed search for MH370. He replied that the parties were in final negotiations, and there would be an announcement next week. The fact that he offered no stipulations for reaching an agreement, which has been the pattern in the past when Malaysia has wanted to stall the negotiation, is very encouraging.

Update on Jan 5, 2018. Channel News Asia is reporting that Malaysia has accepted Ocean Infinity’s offer to continue the search on a “no cure, no fee” basis. The information was sent to the families of passengers on in an email. (Malaysia in the past has informed the next-of-kin of new developments before releasing details to the public.)

Update on Jan 10, 2018. As widely reported, the agreement between Ocean Infinity has been finalized in a signing ceremony. The tiered payment terms are linked to where the debris field is found, and ranges from $20 million if found in the highest priority, 5,000 sq km area, to $70 million if found beyond the 25,000 sq km area. Here is the complete statement from Minister of Transport Liow:

Posted in Aviation | 833 Comments »

Possible MH370 Debris Seen in Aerial Search in March 2014

Figure 1. Location of possible debris from MH370 (red) detected during the surface search (green) on March 29, 2014. Possible flight paths aligned with waypoints also shown (black). (Click on image to enlarge.)

Introduction

Australia’s CSIRO recommends that the next subsea search for MH370 be carried out in a 25,000 sq km area that extends along the 7th arc as far north as 32.6S latitude. The recommendation is based on extensive drift analyses as well as satellite imagery which may have captured debris from the impact.

Despite the work of CSIRO, there are reasons to believe that the wreckage from MH370 is along the 7th arc, but at latitudes to the north of 32.6S latitude. Some of these reasons are:

  1. The absence of debris discovered along the shores of Western Australia is better explained by an impact to the north of 32.6S latitude.
  2. The timing and location of the fragment of the engine cowling with the letters “Roy” that was discovered in Mossel Bay, South Africa, in December 2015, is better explained for an impact north of 32.6S latitude.
  3. The particular impact points that CSIRO considers to be most likely are located at latitudes along the 7th arc that have already been searched to about 19 NM from the arc. With the increasing descent rates indicated by the final two BFO values, the impact likely occurred within that distance from the arc.

On the other hand, CSIRO has provided reasons why they believe the impact could NOT be north of 32.6S latitude. These are:

  1. For latitudes north of 32.6S, debris should have arrived in Madagascar, Mozambique, and other locations in Eastern Africa, before the discovery of debris was reported. But this could easily be explained by the delay between when debris arrived near a location, and when it is discovered and reported to authorities. In fact, the circumstances surrounding Blaine Gibson’s discovery of the horizontal stabilizer fragment with the letters “No Step” suggests the arrival of that part in Mozambique well before it was discovered.
  2. Reconstructed paths terminating along the 7th arc to the north of 32.6S latitude are less consistent with the satellite data. Yet, if we allow for pilot input between the last radar capture at 18:22 and the second handshake at 19:41, and if we assume automated flight after 19:41, there are reconstructed paths that match the satellite signaling data within allowable error limits. In fact, there is a range of possible paths that terminate to the north of 32.6S, and these were the focus of my last post. Within this range, there are some waypoint-derived paths that might deserve extra attention.
  3. If an impact had occurred north of 32.6S, the floating debris would have been detected by the surface search that was conducted by aerial surveillance in the weeks following the crash.

In this article, we take a closer look at the last item in the list.

Many believe that CSIRO’s estimate of search efficiency is over-stated, and it is possible that debris was missed during the surface search. Here, we consider the possibility that floating objects from MH370 were in fact detected by the aerial search and photographed, but those images were ignored after path reconstruction models placed the probable impact site further north, and then further south along the 7th arc. The images captured by the surface search demand a new level of attention in light of the prospect for re-starting the subsea search along the 7th arc in areas that will likely include latitudes to the north of 32.6S.

Obtaining the Images

Large areas of the ocean were surveilled by the Royal New Zealand Air Force (RNZAF) using P-3 Orion aircraft as part of the overall surface search effort. One image from March 28, 2014, which included an object described as a “blue panel”, received some attention because of the object’s resemblance to a flaperon. This object was discussed in an article by Bernard Lagan, who flew with the New Zealand Orion crew on March 28. (The video that accompanies the article is worth watching.)

Curiosity surrounding this debris prompted IG member Brian Anderson in October 2015 to request more information about this and other images collected by the RNZAF search that could be debris from MH370. His request was fulfilled, and he received a large set of images that were made publicly available on Duncan Steel’s website. For convenience, here is a compressed file (1 GB) of the all the images.

Brian continued to query the RNZAF, and was able to obtain more information about the coordinates of the images. IG member Don Thompson was also able to extract the position and timing from the meta data embedded in some of the images. IG member Richard Godfrey in turn helped assemble the data for the completed set of images and also provided some descriptions of the images. The time and position data that we have for all the images is compiled in this Excel file.

As far as we know, none of the objects identified in the surface search on March 29, 2014, were recovered by ship, so the relationship to MH370 remains unknown.

What the Images Show

The images taken on March 29, 2014, captured a variety of objects, some of which could be floating debris from the impact of MH370. The surface search also found objects that are without a doubt not from MH370, including fishing articles such as nets, floats, and marker buoys. Some of the more interesting images from March 29 are shown in Figures 2 – 5,  including two debris fields of small fragments, an object that resembles a suitcase, one that resembles a portion of a panel with wires, and a rectangular box that resembled a cargo package.

Figure 2. Enlarged images of debris fields on March 29, 2014. Left: 28.3927S, 97.7750E from image 5832. Right: 29.19333S, 95.1250E from image 5853.

Figure 3. Object resembling a suitcase near 28.3176, 97.8234E on March 29, 2014. (Enlarged from image 5833.)

Figure 4. Object resembling a portion of a panel with wires near 28.8867S, 96.0844E on March 29, 2014. (Enlarged from image 5847.)

Figure 5. Object resembling a rectangular cargo package near 29.1936S, 95.1094E on March 29, 2014. (Enlarged from image 5854.)

Drift Analysis

As only 21 days elapsed between the impact of MH370 and the discovery of the debris, it should be possible to “backtrack” the objects to March 8 to determine a potential point of impact. To simplify this procedure, I looked at the forward drift results for a point of impact on the 7th arc at 29.7S latitude, which corresponds to the path aligned with Wilkins Runway (YWKS), Antarctica, and is also the closest path to the objects among the four waypoint-derived great circle paths that I examined in the last article.

Using the CSIRO results for drift of low windage debris from 30S latitude, I selected 31 particles that were positioned within a 15-NM radius of the assumed impact point at 29.7S latitude, among the hundreds of particles that CSIRO studied over a much larger area. The selection of multiple particles within a circular area allows for a diversity of drift paths which reflect the uncertainty in the impact point and the stochastic nature of ocean drift. Ideally, more than 31 particles would be modeled as we know the crash produced many more, but the geographic spread of the injected particles in the available CSIRO data sets limited the number of particles I could select and get meaningful results about a particular impact point. The selected particles (green) among the total particles available (translucent blue) are shown in Figure 6.

Figure 6. Selected particles (green) within a 15-NM radius (white) of the 7th arc crossing (intersection of black and blue lines) at 29.7S latitude. (Click on image to enlarge.)

The drift of the particles is shown in the following video for the time period between March 8 and March 29, 2014. The direction of the particles is from the impact at 29.7S latitude (white circle) and towards the detected debris (red dots). The video also shows how the paths of the particles diverge so that after 3 weeks, the particles are separated by more than the 150-NM distance between the two detected debris fields (images 5832 and 5853). The drift results indicate that the detected objects are consistent with an impact on March 8, 2014, along the 7th arc at 29.7S latitude. (The video is best seen in “full screen” mode by selecting the four arrows next to the Vimeo logo.)


Implications for New Search

Unless there is evidence that objects detected on March 29, 2014, are not from MH370, we have to consider the possibility that one or more objects are from MH370. This greatly increases the probability that the impact was further north than the 25,000 sq km area recommended by CSIRO for the new seabed search. Ocean Infinity seems committed to searching beyond the first 25,000 sq km, and based on the results presented here, a hot spot around 30S latitude deserves special attention.

I have asked the ATSB and CSIRO for more information about these “contacts”. The ATSB had record of the detection of some of the objects on March 29, 2014, but no record of the detection of the two debris fields. Meanwhile, David Griffin of CSIRO has agreed to do some “backtrack” drift calculations to see where along the 7th arc the debris would have originated if the debris was from MH370. As these results are very relevant to future search efforts, I will make the results available when I can.

Update on April 5, 2018

On November 29, 2017, I received an email from David Griffin in which agreed that the objects spotted by the RNZAF on March 29, 2014, could have been from an impact on the 7th arc around 29.7S latitude. At that time, I had no permission to share his email. I now have that permission, and what follows is the email in its entirety:

Hi Victor,

First, a few responses to your post (which I thought made some good points):

  1. The 25,000km^2 search area was not recommended by CSIRO. It came out of the First Principles Review. CSIRO was just one voice in the room.
  2. Roy: “better explained” – well, sort of, see below
  3. “could NOT be north of 32.6S” – if you check the reports I think you will find words like “less likely” are what we said.
  4. I won’t comment on what the images may or may not be. I leave that to others. CSIRO’s role is to comment on how floating things move.
  5. Your use of the kmz files: well done! I think you’ve done much of the job. See below for additional info.
  6. I think you have made a good point that the items seen by the RNZAF were NOT all conclusively proven NOT to be from MH370.

Next, two asides:

  1. The surface search targeted regions of ocean where items from the 7th arc may have drifted to. So backtracking any items seen should, by and large, conclude that they were near the 7th arc on 8 March. So anyone (one of your commenters, I think) who thinks that backtracking to the arc supports the idea that the items were MH370-related has missed the point. You are correct that the only point of doing the backtracking is to identify what area on the arc was the potential crash site.
  2. Forward tracking and backward tracking are mirror images when we do not include any random numbers (which is normally the case). The difference is sensitivity to starting point. Assume for the moment that the NZ photos are all bits of plane. If I backtrack them with our (guaranteed-imperfect) model, I fully expect that many would go wide of the 7th arc. Long story short: its simpler to use forward tracks, as you have done.

Finally, some fresh results:

I have now used both our models (BRAN2015 and BRAN2016, as used in our reports) to investigate the 29.7S crash site scenario. This is a “poor man’s ensemble” (just 2 members) but I think it really helps people not to over-interpret results when confronted with two models. Confucious said: “man with 2 watches does not know the time”. I say “man with just one watch thinks he knows the time exactly when he might not”.

The flow field

Trajectories from a line of points on the 7th arc (~30.5S to 29.5S on 8 March) up til 29 March:

http://www.marine.csiro.au/~griffin/MH370/br15_MH370_93103_tp3l1p2d_bh_arc7_305295_0/20140329.html

http://www.marine.csiro.au/~griffin/MH370/br16_MH370_93103_tp3l1p2d_bh_arc7_305295_0/20140329.html

It is around 19 March (click PREV to go back to then) that the line of points starts to stretch apart. You can see that this is because of the fanning-out of the sea surface height contours. 28.5S 96.5S is a saddle point in the sea level. Images 5847 and 5846 were near this saddle point. Neither model is keen to make trajectories go right there (corollary: backtracks will not come back). Wind and Stokes drift are what make it possible (in both reality and the modelling). Images west or east are more easily reached, from points on the arc that are not far apart, suggesting that it is indeed plausible (taking model imperfections into account) that all the photographed debris items were from a single origin (near 29.7 or 29.8S) on 8 March.

SST images

I have also looked at the satellite sea surface temperature imagery, and overlain this on modelled trajectories with three levels of windage. The debris will be somewhere between the 1.2% and 3% windage dots, while the deep ocean features will move more like the zero windage dots.

The images for 28 Mar

http://www.marine.csiro.au/~griffin/MH370/br15_L3S-1d_MH370_93103_tpb_arc7_305295_0/2014032812.html

and 30 Mar are clearer than 29th, and show (like others before) that there was a strong temperature front at about 29S, very close to the image locations. Currents tend to flow mostly along temperature fronts, not across them. This happens in the model as well as in the real world to a pretty good degree. But fronts are also often slightly convergent at the surface (water sinking) which is why buoyant material accumulates at fronts. So you can see that this provides a plausible explanation of why there were many debris items here – MH370-related or not.

Roy

I would not claim that BRAN2015 trans-Indian trajectories starting at 29.7S are very consistent with the finding of Roy in Dec 2015. It is only a very small fraction of the trajectories that go down there. Enough to say to it is possible – certainly – but not really a very conclusive result. See:

http://www.marine.csiro.au/~griffin/MH370/br15_MH370_IOCC_tp3l1p2dp_rw2_297986/index.html

Other items

March-April 2015 is when debris from a crash at 29.7S would (according to BRAN2015) have started to wash up on Madagascar, Tanzania and Mozambique. http://www.marine.csiro.au/~griffin/MH370/br15_MH370_IOCC_tp3l1p2dp_rw2_297986/20150312.html

Flaperon

Nov-Dec 2014 is the earliest that the flaperon might have arrived at Reunion if the crash was at 29.7S according to BRAN2015. 29 July 2015 is well after this earliest time but still perfectly plausible:

http://www.marine.csiro.au/~griffin/MH370/br15_MH370_IOCC_tp3l1p2dpf10_20_99_297986/20150729.html

So not particularly helpful.

I talked to Craig Longmuir at AMSA today about this, so have copied him in. He may have something to add about the photos and their interpretation.

So, as with the Pleiades images, these RNZAF sightings, if MH370-related, do potentially lead us to a crash site. But Pleiades and RNZAF are mutually-exclusive. Same with what was sometimes referred to as “the Esky lid”.

David

Posted in Aviation | 883 Comments »