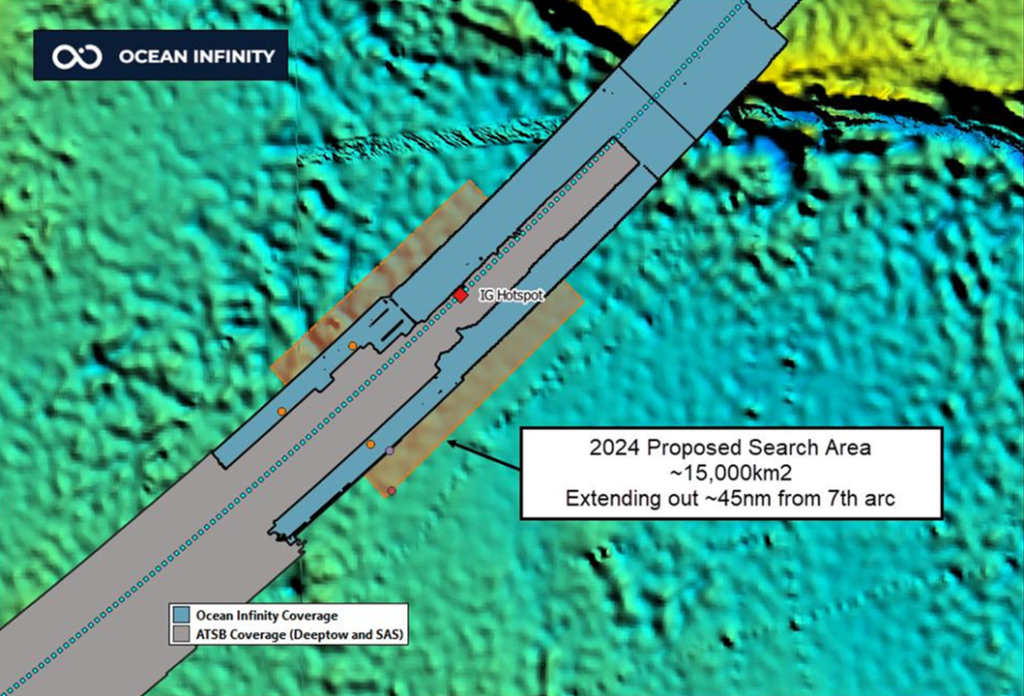
On Sunday, MH370 family member V.P.R. Nathan presented several slides highlighting Ocean Infinity’s willingness to conduct another subsea search for the debris field of the aircraft. The search area, which may be refined later, extends along the 7th arc from about 33°S to 36°S, and out to about 45 NM (83 km) on either side of the arc. Ocean Infinity also plans to “fill-in” areas that were previously searched that had low quality or missing data due to equipment failures or challenging terrain.
The proposal is broadly consistent with the flight reconstruction and recommended search area that we presented in UGIB 2020 and the subsequent drift study. In fact, the “Last Estimated Position” (LEP) presented in those studies is designated the “IG Hotspot” in the slide. The proposed search area will also incorporate our high priority area due south of the LEP that was missed by the previous searches by the ATSB and Ocean Infinity due to the steeply sloping terrain in that area.
So, will Malaysia accept Ocean Infinity’s offer to conduct another search with the proposed terms of “no-find, no-fee”? At Sunday’s event, Transport Minister Anthony Loke expressed an interest in discussing the new proposal with Ocean Infinity. However, both he and Malaysian Prime Minister Anwar Ibrahim cautioned that a new search would be conducted only if there was “credible new evidence”. So, although we may be seeing progress towards a new search, it is unclear whether or not Malaysia will accept Ocean Infinity’s proposal.
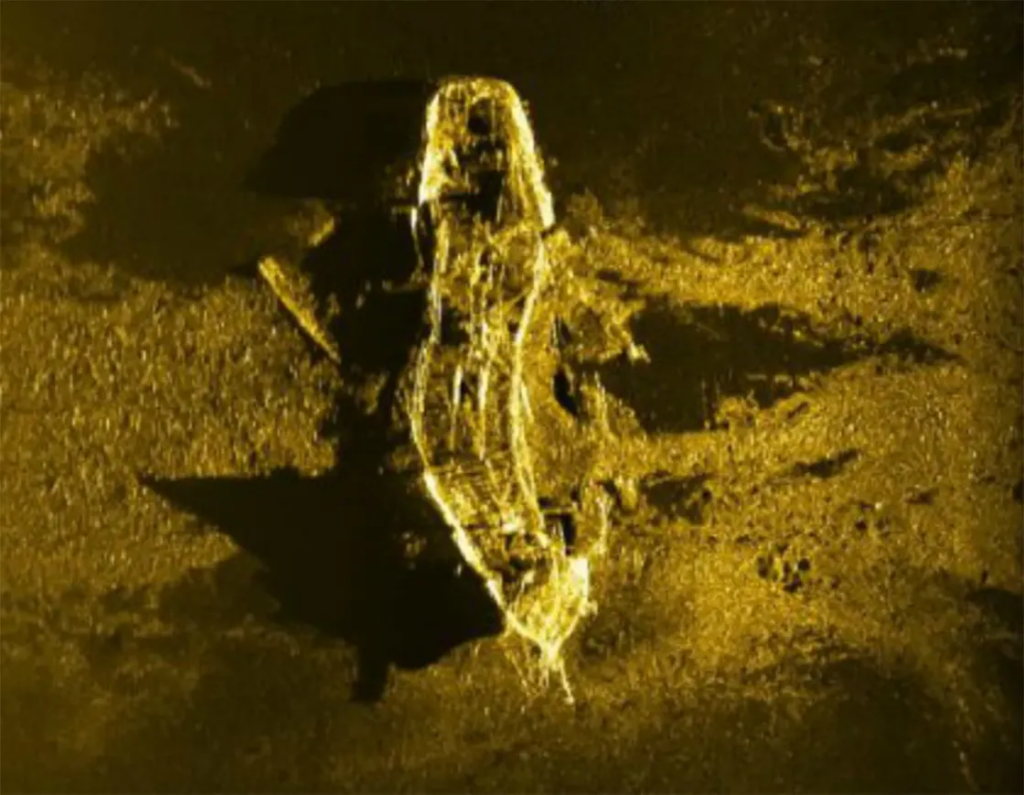
A shipwreck found during the subsea search for MH370
The total subsea search for MH370 comprised more than 240,000 km2 of seabed in the Southern Indian Ocean (SIO) along the 7th arc, which is derived from the metadata from the last transmission from MH370’s SATCOM terminal. The search of the first 120,000 km2 was managed by the Australian Transport and Safety Bureau (ATSB), and included the areas that Australia’s Defense Science and Technology Group (DSTG) deemed most likely as the Point of Impact (POI). The ATSB’s subsea search along the 7th arc extended in latitude from 39.4 S to 32.8 S, varying in width from 130 km at the southern end of the search area to 40 km at the northern end.
An additional 120,000 square kilometers of seabed was scanned by Ocean Infinity (OI) using a fleet of autonomous underwater vehicles (AUVs). OI extended the length and width of the ATSB’s search so that a full 110 km width was scanned along the 7th arc north to a latitude 31.5 S. The search area was then narrowed to a width of 84 km and extended north along the 7th arc to a latitude of 24.8 S.
Despite this unprecedented large search in the area deemed most likely to find the debris field, the search was unsuccessful. So why wasn’t MH370’s debris field identified? There are only three realistic possibilities:
The aircraft was manually piloted after fuel exhaustion and glided beyond the area that was previous searched. Although the final BFO values suggest an increasingly high rate of descent that would certainly have resulted in an impact within kilometers of the 7th arc if there had been no further pilot inputs, there is a possibility that the pilot arrested the steep descent and transitioned into a long, efficient glide.
The point of impact (POI) occurred along the 7th arc further south than 39.4 S or further north than 24.8 S. For instance, although the statistical match to the satellite and drift model data is not as strong, Ed Anderson has discovered an acoustical event along the 7th arc at 8.4 S that he believes is related to MH370. Meanwhile, Paul Smithson believes an impact further south than 39.4 S is within the uncertainty limits of the fuel consumption and drift models, and should not be excluded.
The debris field lies on the seabed within the area already searched, but was not identified due to challenging terrain, low quality data, or equipment issues.
Here we address the third possibility. In particular, we again consider whether the debris field might be located in the high probability search area previously identified, which is in proximity of the last estimated position (LEP) calculated in the UGIB 2020 study. We further consider whether parts of MH370 were detected but were never fully investigated because they were not part of a larger debris field.
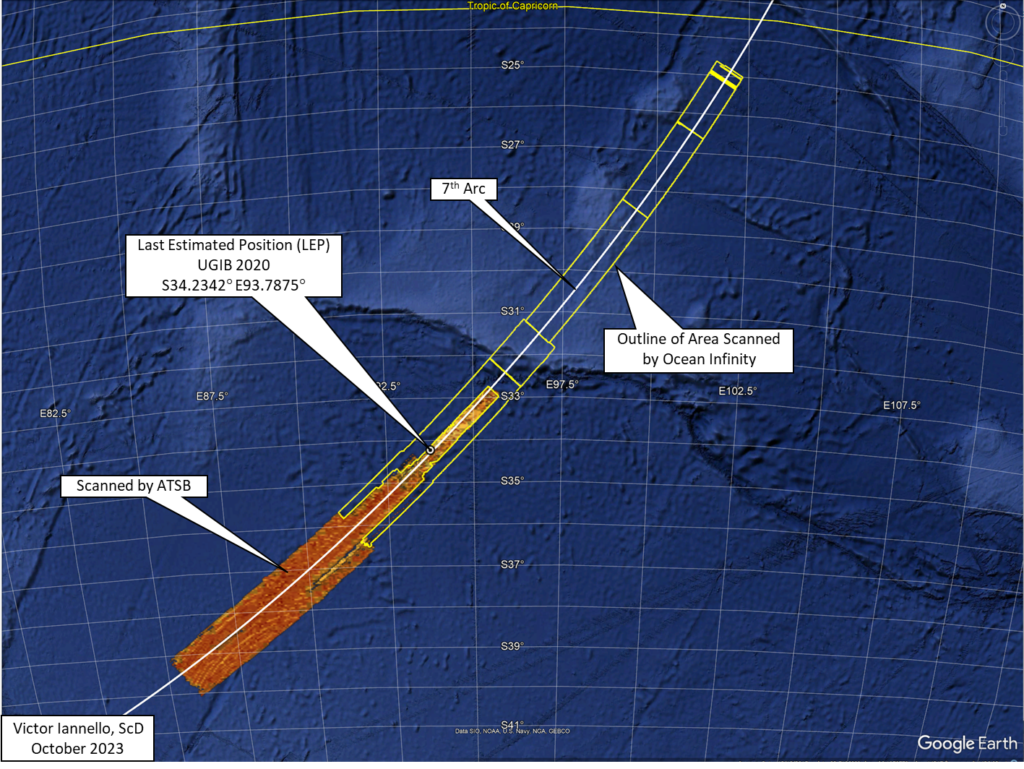
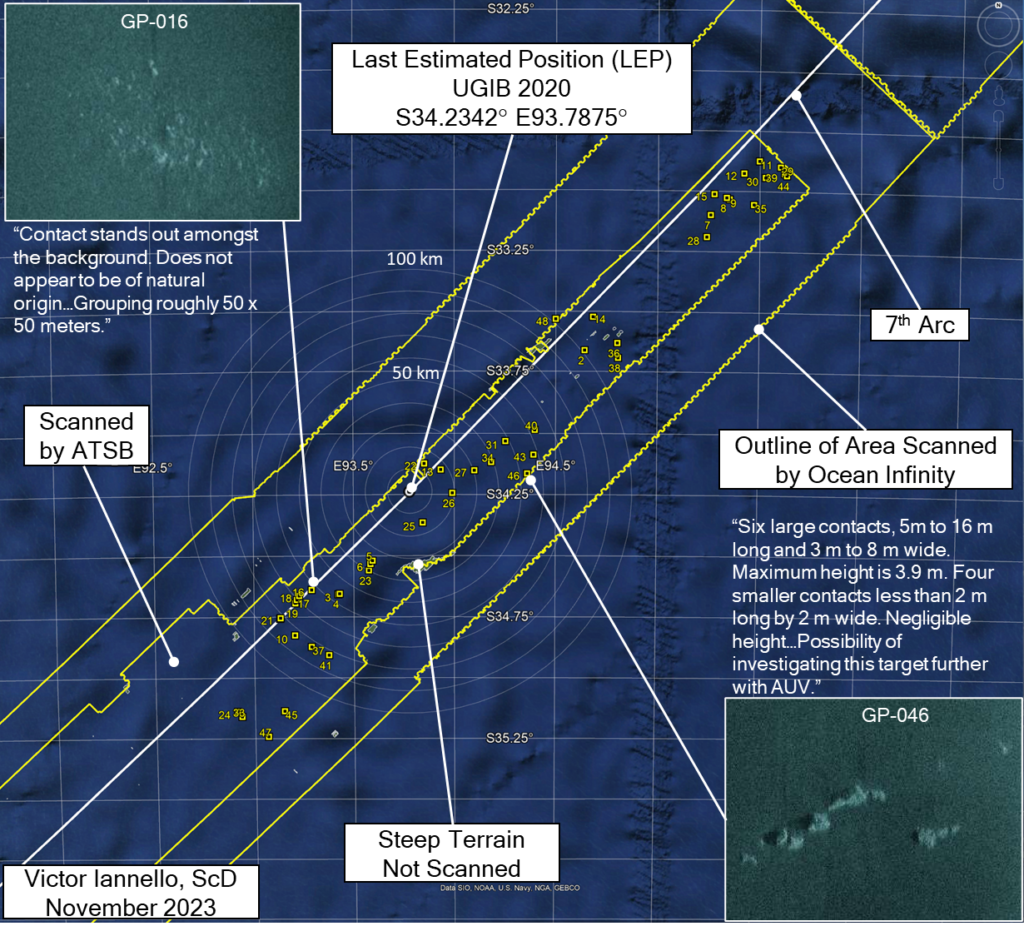
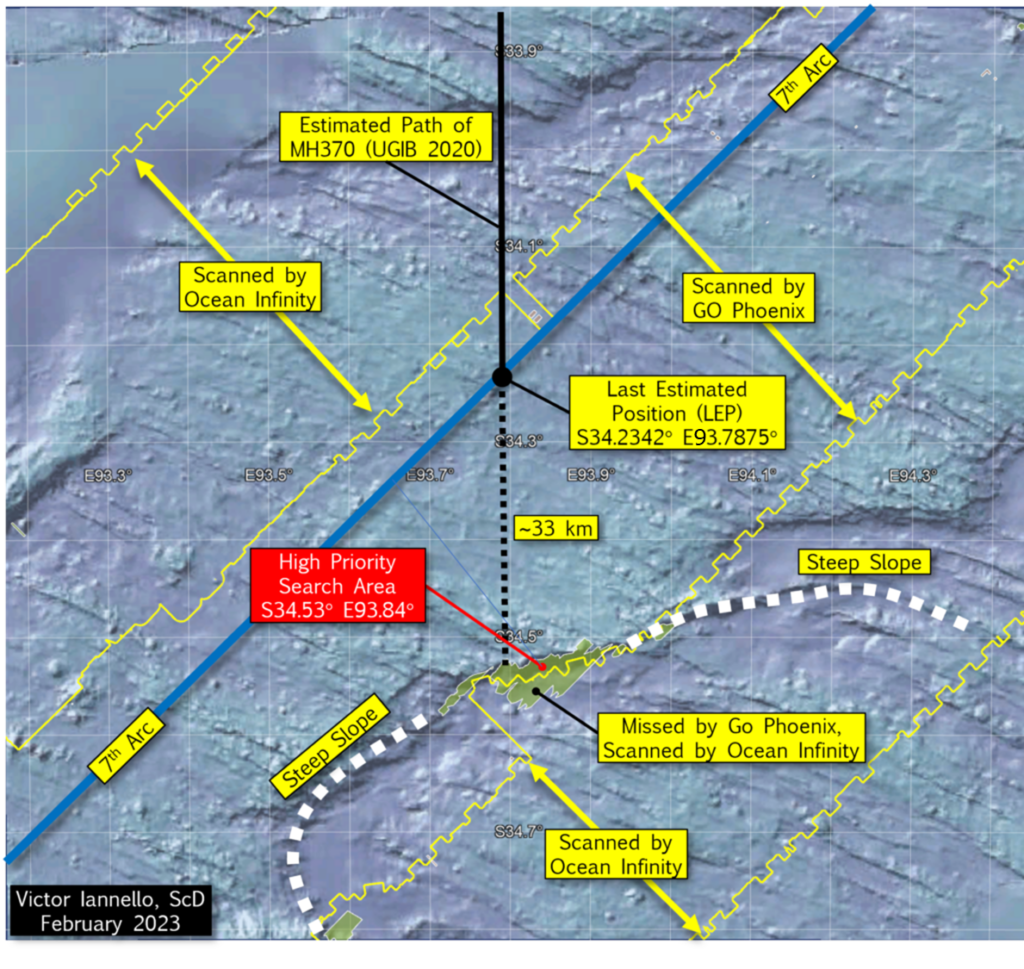
In the figure below, the two inner yellow lines show the approximate limits of the area searched by the vessel GO Phoenix (under contract with the ATSB), and the outer lines show the limits of the Ocean Infinity search area. Also shown in the figure are olive-green areas which represent areas that were not scanned by GO Phoenix’s towfish due to steep terrain. The outlines of these and other areas of missing or low-quality data were made available by Geoscience Australia.
There is a steep slope to the south of the LEP, and the portion of the steep slope that was not scanned by the GO Phoenix towfish is about 60.3 km2. Of this, about half was later scanned by Ocean Infinity AUVs, leaving about 30.5 km2 of seabed surrounding S34.53° E93.84° that was never scanned. We designated this area as a “High Priority Search Area”, and it may be here that the debris field lies.
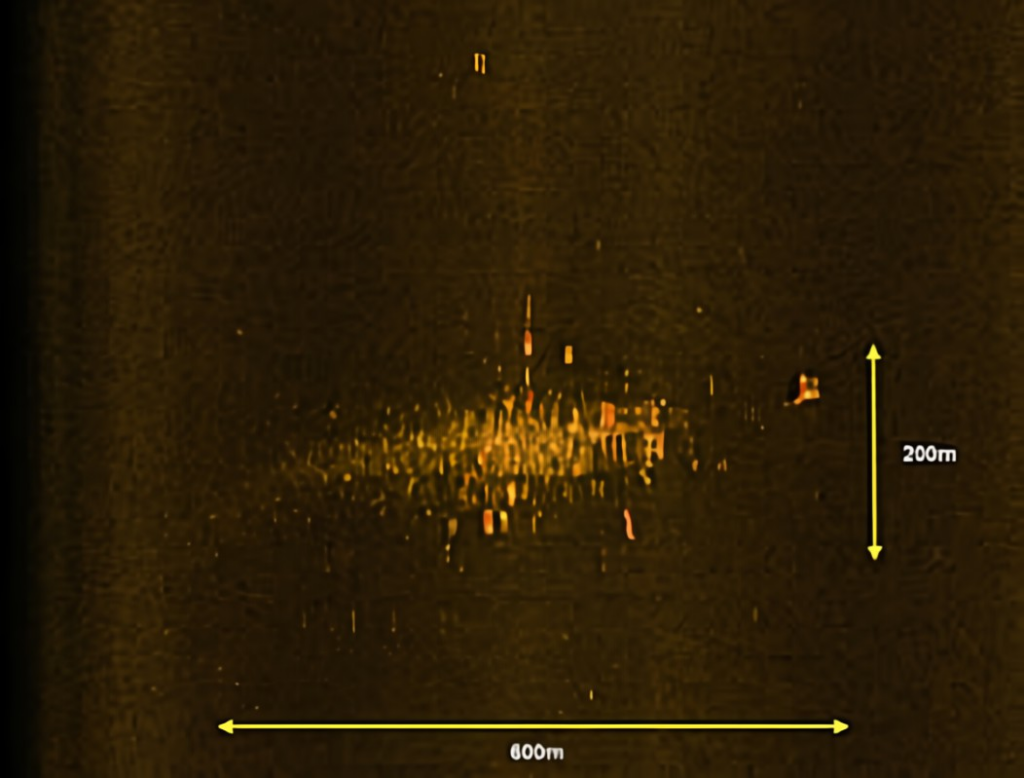
The subsea search for aircraft wreckage that many deem most similar to the search for MH370 was the search for Air France 447 (AF447), which was an Airbus A330 that crashed off the coast of Brazil in June 2009 in around 3000 m (9,800 ft) of water. Floating remnants of the aircraft were found within 2 days of the crash, but the subsea search was not successful in locating the debris field until April 2011, about 2 years after the crash. The sonar image from the debris field, which measured around 200 m x 600 m, is shown below.
AF447 is believed to have impacted the ocean surface without breaking up in flight and with a nose-up attitude. As such, the debris field that AF447 generated may be significantly different from the debris field created by the impact of MH370, as the final two BFO values suggest a high downward acceleration of 0.7g, and descent rates greater than 15,000 fpm. Without pilot intervention, MH370 possibly entered the water at a descent angle greater than 45 deg and at an airspeed approaching or exceeding Mach 1.
The debris from MH370 may more closely resemble the debris from SilkAir 185 rather than the debris from AF447. SilkAir 185 was a Boeing 737 that crashed into the Musi River near Palembang, Sumatra, Indonesia in December 1997. The aircraft experienced a rapid, nearly vertical dive that the US NTSB attributed to control inputs from the captain. During the high speed descent, parts of the control surfaces, including a large portion of the tail section, separated from the fuselage due to the high aerodynamic forces from the high speeds. The airspeed of the fuselage before impact is believed to have exceeded Mach 1.
SilkAir 185’s debris was found in two areas: the main debris field of around 60 m x 80 m at the bottom of the Musi River, which was only 8 m (26 ft) deep; and other larger debris, mainly flight control parts that separated before impact, that were widely scattered on land no closer than 700 m (2,300 ft) from the main debris field. According to the accident report, due to the high energy of the impact, the parts recovered from the river were “highly fragmented and mangled on impact” which made identification difficult.
If MH370 experienced the rapid descent suggested by the final BFO values, then it is probable that the fuselage broke apart before impact, and also probable that many large parts would be found outside of the main debris field. The flaperon recovered on Reunion Island is a good example of a flight control part that may have separated before impact. We would also expect the main debris field to be smaller in extent than for AF447, and within that debris field, the debris to be smaller and more difficult to identify. For instance, for the case of SilkAir 185, the landing gear was identified only by its subcomponents (struts, landing gear door actuators, wheels, brakes, tire pieces, etc.). This counters conventional wisdom that says that aircraft engines and landing gear should be among the easiest parts to identify by sonar on the seafloor, as it was the case for AF447.
The subsea search for MH370 was focused on finding the main debris field at the expense of identifying other parts that may have separated. For the search phase conducted by GO Phoenix, reports were written for a total of 45 “contacts” (observable features in images) that merited a further review. All the contact reports are compiled here. Of these 45 contacts, 24 contacts were within 100 km of the LEP, 10 contacts were within 50 km of the LEP, and 4 contacts were less than 25 km from the LEP. The locations of the contacts are shown in the figure below.
Of the 45 contacts, 11 (GP-002, 016, 018, 019, 021, 025, 026, 028, 030, 031, 047) were described in the reports with phrases like possibly “man-made”, “not geological”, or “not of natural origin”, and one (GP-046) was considered for further investigation with an AUV, which seems to have never been done. Of course, many of the man-made objects on the seafloor could be marine debris from sea vessels unrelated to MH370.
Andy Sherrill is an experienced ocean engineer who has conducted deep water search and salvage operations for a number of missions. He was a key member of the team that reviewed the sonar data for the subsea searches for MH370 that were conducted by the ATSB and Ocean Infinity. Andy was also part of team that identified the debris field for AF447 off the coast of Brazil as well as part of the team that found Argentina’s ARA San Juan submarine. Andy graciously offered these comments as to why many of the MH370 promising contacts were never investigated further:
“Typically, if there were small isolated objects that appeared to be man-made and marked as a target, but nothing else was of interest within several kilometers then we did not investigate further.
We certainly took into account if the debris field did not look like AF447 or any others, however there still needed to be enough debris to be at least a fair amount of the aircraft to warrant further investigation.
Sure a small part of the plane could have drifted and sunk, but we were looking for the main field. A decision was made to focus on finding the main field of debris, not just one small piece – and likely all of those “potentially man made” contacts are from passing vessels given there was no associated debris within several kms.
Having said that, there is always a chance it [a tagged contact] could be from MH370, but based on our assessment the time it took to investigate each of these small contacts was not worth taking vs searching new areas.”
Discussion
As the final BFO values, the lack of IFE log-on, and the end-of-flight simulations all suggest a high speed impact close to the 7th arc, a high priority should be to completely scan the areas closest to the 7th arc. MH370’s debris field may be smaller in area, consist of smaller parts, and be much more difficult to identify than searchers were anticipating. It’s also possible that the debris field is located in an area that was not fully searched due to challenging terrain, low quality data, or equipment issues, such as the steep slope identified above as the high priority search area due south of the LEP. As such, the investigation of many of the contacts previously identified becomes more important, as one or more of these contacts could be parts of MH370 that separated before impact. It’s also possible that one or more contacts are part of a less conspicuous debris field.
We again acknowledge that with pilot inputs, it is possible that MH370 glided after fuel exhaustion beyond the areas that were previously scanned. Therefore, searching wider along the 7th arc should also be part of the search plan if pursuing areas close to the 7th arc is unsuccessful in locating any of MH370’s wreckage.
Update on Nov 3, 2023
Andy Sherrill offered these additional comments:
“We did get rerun over GP16, and collected some higher frequency AUV SSS on that one. Looks highly likely to be geologic in my opinion.
We did not reacquire any more data over GP46, however that one looks very similar to GP16 and I would still classify it as highly likely to be geologic.”
Recommended Search Areas Surrounding 34.23°S, 93.79°S
After three years of work, Bobby Ulich and I are publishing a very detailed drift model for predicting the point of impact of MH370. The most likely point of impact (POI) is estimated to be along the 7th arc at 34.0°S latitude, which is around 76 km (41 NM) northeast of the last estimated position (LEP) of 34.23°S, 93.79°E from our previous study (UGIB 2020). While the current study primarily uses drift modeling, the previous study primarily used satellite, weather, and aircraft performance data. The consistency of these two studies lends support to the results. Because of uncertainties in the drift model, the present study estimates that it is possible that debris drifted from an origin along the 7th arc between 30°S and 36°S.
The study incorporates the following data sets, assumptions, and methodologies:
Seventeen reliable MH370 debris reports with unique locations and finding dates
86,400 drift trials predicted by CSIRO using the BRAN2015 ocean model for the flaperon and for generic debris
Windage for generic MH370 debris varied over a range
A Bayesian statistic for the localization error of BRAN2015 drift tracks
Errors in the BRAN2015 ocean current and wind speeds
Minimum and maximum reporting delays of recovered debris based on barnacle encrustation
Maximum likelihood estimation theory
Processing methods for computing a PDF and estimating its uncertainty
Bayesian statistics for accommodating a large range of allowable transport speed of debris
Validation studies through non-blind, partially blind, and blind tests
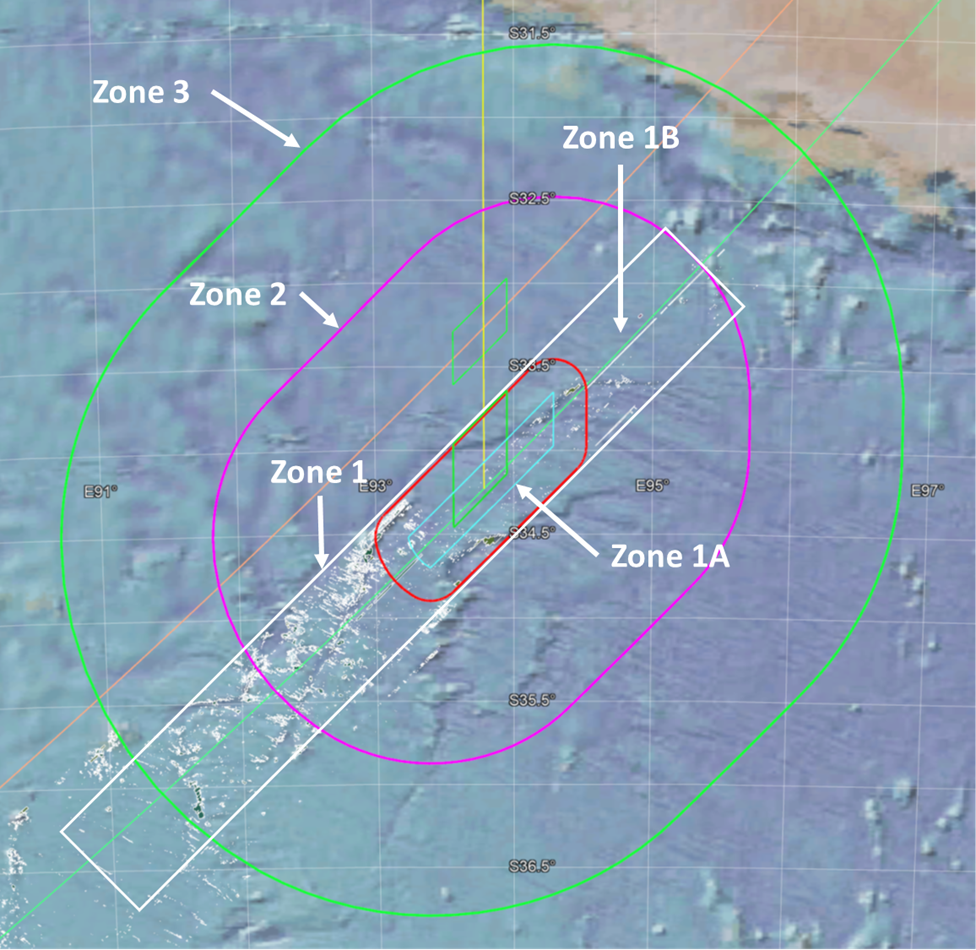
The figure above shows the subsea search recommendations from the current study. The search area is subdivided into the following zones, in order of search priority:
Zone 1: Shown as the white rectangle, the area was largely searched before, but some areas were missed due to missing or low-quality data, including areas with challenging terrain. We also consider that one or more contacts previously dismissed may be individual parts from MH370 rather than the expected field of debris. Within Zone 1 is Zone 1A, shown by the red racetrack, which defines the limits of an impact before 00:21:07, which is when a log-in to the Inflight Entertainment (IFE) server was expected. Zone 1B is the part of Zone 1 that is not within Zone 1A.
Zone 2: Shown as the purple racetrack, this area extends to +/- 70 NM from the 7th Arc, and represents the likely limits to a glide after fuel exhaustion.
Zone 3: Shown as the large green racetrack, this area extends to +/- 140 NM from the 7th arc, and represents the extreme limits of a long glide after fuel exhaustion.
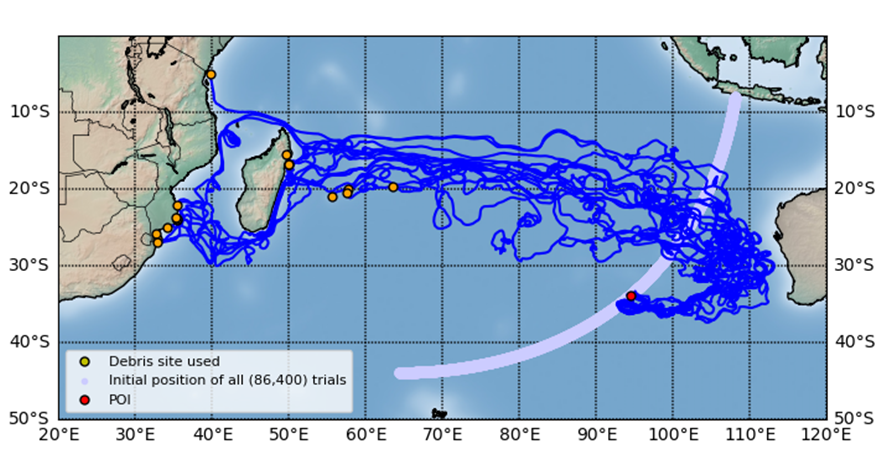
CSIRO shared with us two sets of 86,400 predicted trial drifter tracks using the ocean model BRAN2015. Each trial was assumed to have originated at a unique location near Arc 7, in an array with a fairly uniform areal density and within 25 km of Arc 7 between 8°S and 44°S latitude. The location (latitude, longitude) of each trial drifter was predicted by CSIRO at one-day intervals up to 1,027 days after crash. One set of 86,400 trials used the drift parameters CSIRO determined for the flaperon by sea trials with a cut-down flaperon. The other set was for non-flaperon debris and assumed 1.2% windage to account for Stoke’s Drift, which is shown in this video for all 86,400 trials:
Representative drift paths from our estimated point of impact (POI) to the 17 debris locations used in the analysis is shown in the following figure:
The paper “Improved Prediction of MH370 Crash Location Based on Drift Modeling of Floating Debris” by Bobby Ulich, Ph.D. and Victor Iannello, Sc.D., can be downloaded here.
Acknowledgement
I’d like to personally show my gratitude to Bobby Ulich, who has made this drift study a priority for three years, and was the driving force for its completion. We also gratefully acknowledge the many valuable contributions of David Griffin and by CSIRO, who made this work possible. In addition, we thank Don Thompson, Michael Exner, and Henrik Rydberg for reviewing an earlier version of the paper.
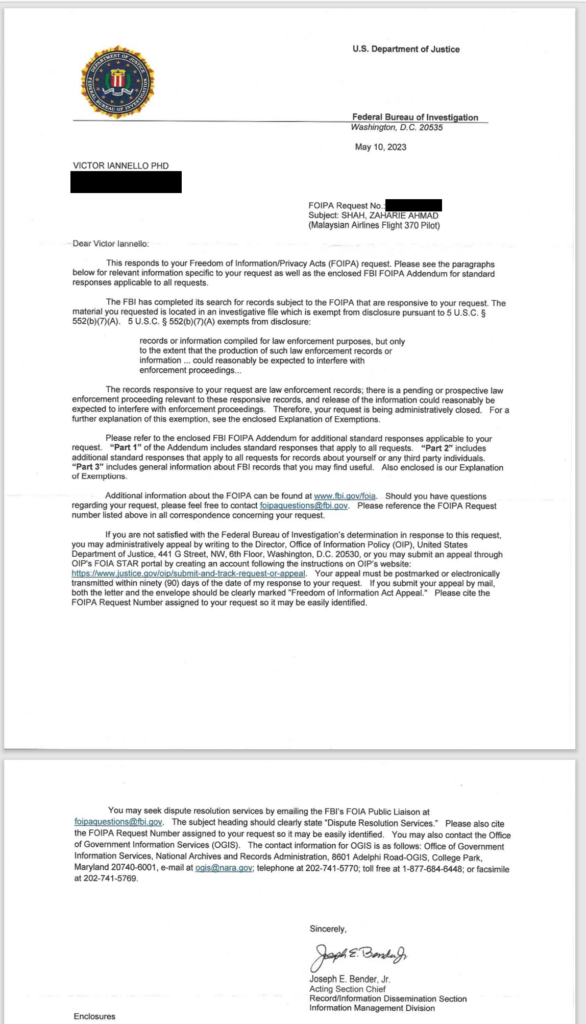
I recently submitted a FOIA request to the FBI for all documents related to MH370, which disappeared more than nine years ago. This week, the FBI responded that the request was denied due to “a pending or prospective law enforcement proceeding relevant to these responsive records, and release of the information could reasonably be expected to interfere with enforcement proceedings”. This is identical to the response I received two years ago, and two years before that, after I submitted similar requests. It implies the US intelligence community has relevant material that it will not release due to an open criminal investigation.
Although I requested “All information pertaining to Malaysia Air MH370, including but not limited to information pertaining to Captain Zaharie Shah”, the subject of the FBI’s response only referenced Captain Zaharie Shah. This could mean that only the captain is under investigation by the FBI.
In 1971, an unidentified individual that referred to himself as Dan Cooper, who later mistakenly became known as D.B. Cooper, hijacked a Northwest Airlines flight between Portland, OR, and Seattle, WA, and parachuted from the Boeing 727. That FBI investigation remained open for 45 years. With that perspective, it is possible that the facts uncovered in the FBI investigation of Captain Zaharie Shah will be unavailable to the public for a long time.
Ocean Infinity launches the first remotely-operated ship of their Armada fleet, which could be used to search for MH370
Introduction
In two previous posts, (here and here), we have presented the assumptions and analyses for reconstructing our best estimate for MH370’s path into the SIO. Often referred to as “UGIB” after its authors Bobby Ulich, Richard Godfrey, Victor Iannello, and Andrew Banks, the model was developed using exhaustive data sets and technical documentation available from both public and confidential sources, and includes:
Radar data collected by military and civilian installations in Malaysia
Timing and frequency measurements collected by the Inmarsat satellite network
Aircraft performance data for Boeing 777-200ERs
Historical performance data for airframe 9M-MRO
Navigation and speed modes for automated flight
Drift analysis of debris that floated and was recovered in East Africa
Aerial search results from March and April 2014
Weather data along the flight path
The work included the development of an accurate fuel consumption model, as well as a statistical metric for the expected random noise inherent in the recorded satellite data. These improvements allowed the rejection of hypothetical flight paths that were previously believed to be possible.
An important assumption of UGIB is that from 19:41 UTC until impact, MH370 flew with the autopilot and autothrottle engaged and with no pilot inputs. The results of that work suggest that the final hours of the flight were due south in the Indian Ocean along E93.7875° longitude, which matches a great circle between the waypoint BEDAX (about 100 NM west of Banda Aceh, Sumatra) and the South Pole. The Last Estimated Point (LEP) was defined as the intersection of E93.7875° longitude and the 7th arc, with coordinates S34.2342 E93.7875°. The debris field was postulated to be close to the LEP, as the end-of-flight after fuel exhaustion was expected to be a short distance.
The final BFO values at 00:19:29 UTC and 00:19:37 UTC suggest that MH370 was in an increasingly steep descent with a downward acceleration of around 0.7g. That, combined with the missing IFE log-on, are consistent with an impact relatively close to the 7th arc. Boeing simulations of the end-of-flight (assuming no pilot inputs) suggest an impact within 8 NM of the 7th arc. Other simulations with a PC-simulator in which a bank was imposed to match the BFO-derived downward acceleration suggest that the impact should be within 5 NM of the 7th arc. Yet, two subsea searches along the 7th arc near the latitude of 34°S, covering a much larger width of 110 km, failed to find the debris field.
The first search, conducted by GO Phoenix with a towfish, had a width of 40 km (7 km inside, 33 km outside the 7th arc) when scanning near 34°S latitude. Although this search failed, there were some areas that were missed due to terrain avoidance, shadows, equipment failures, and tracking errors, which does open the possibility that the debris field was passed over by GO Phoenix and not detected.
The second search was conducted by Ocean Infinity using a fleet of autonomous underwater vehicles (AUVs), and extended the width inside the 7th arc by 42 km and the width outside of the 7th arc by 29 km, for a cumulative search width of around 110 km (49 km inside, 61 km outside). Due to the greater maneuverability of the AUVs, the search area included some of the steep slopes that were deliberately avoided by GO Phoenix due to challenging terrain. Despite this wider and more thorough search, the debris field again was not found.
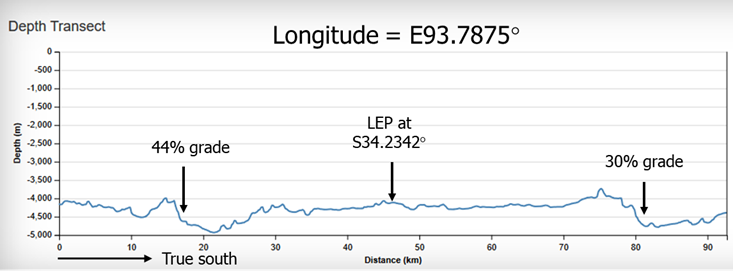
In a previous article, we postulated that the debris field may have been missed due to terrain avoidance and/or shadows, or detected but not properly interpreted by reviewers. In particular, there is a steep slope that lies about 33 km due south of the LEP and 27 km from the 7th arc that was not scanned by the GO Phoenix’s towfish and appeared to have been only partially scanned by Ocean Infinity’s AUVs.
The figure below shows the ocean depth along a line of constant longitude in the vicinity of the LEP. The previously identified steep slope to the south of the LEP has a grade of about 30%. To the north, another slope has a grade of 44%. The slope to the north was beyond the limits of the search boundaries of GO Phoenix, but was scanned by Seabed Constructor’s AUVs, so we focus on the steep slope to the south.
New Information about the Previous Search
Working with Ocean Infinity, we were able to obtain a more accurate outline of the area searched with their team of AUVs. The outline is shown by the four yellow lines in the figure below. As shown in the figure, the two inner yellow lines show the approximate limits of the GO Phoenix search area, and the outer lines show the limits of the Ocean Infinity search area. Also shown in the figure are olive-green areas which represent areas that were not scanned by GO Phoenix’s towfish due to steep terrain. These and other areas of missing or low-quality data were made available by Geoscience Australia.
Looking again at the steep slope to the south of the LEP that we previously suspected was not fully scanned, we can see that our suspicions were correct. The portion of the steep slope that was not scanned by the GO Phoenix towfish is about 60.3 km2. Of this, about half was later scanned by Ocean Infinity AUVs, leaving about 30.5 km2 of seabed surrounding S34.53° E93.84° that was never scanned. We designate this area as a “High Priority Search Area”.
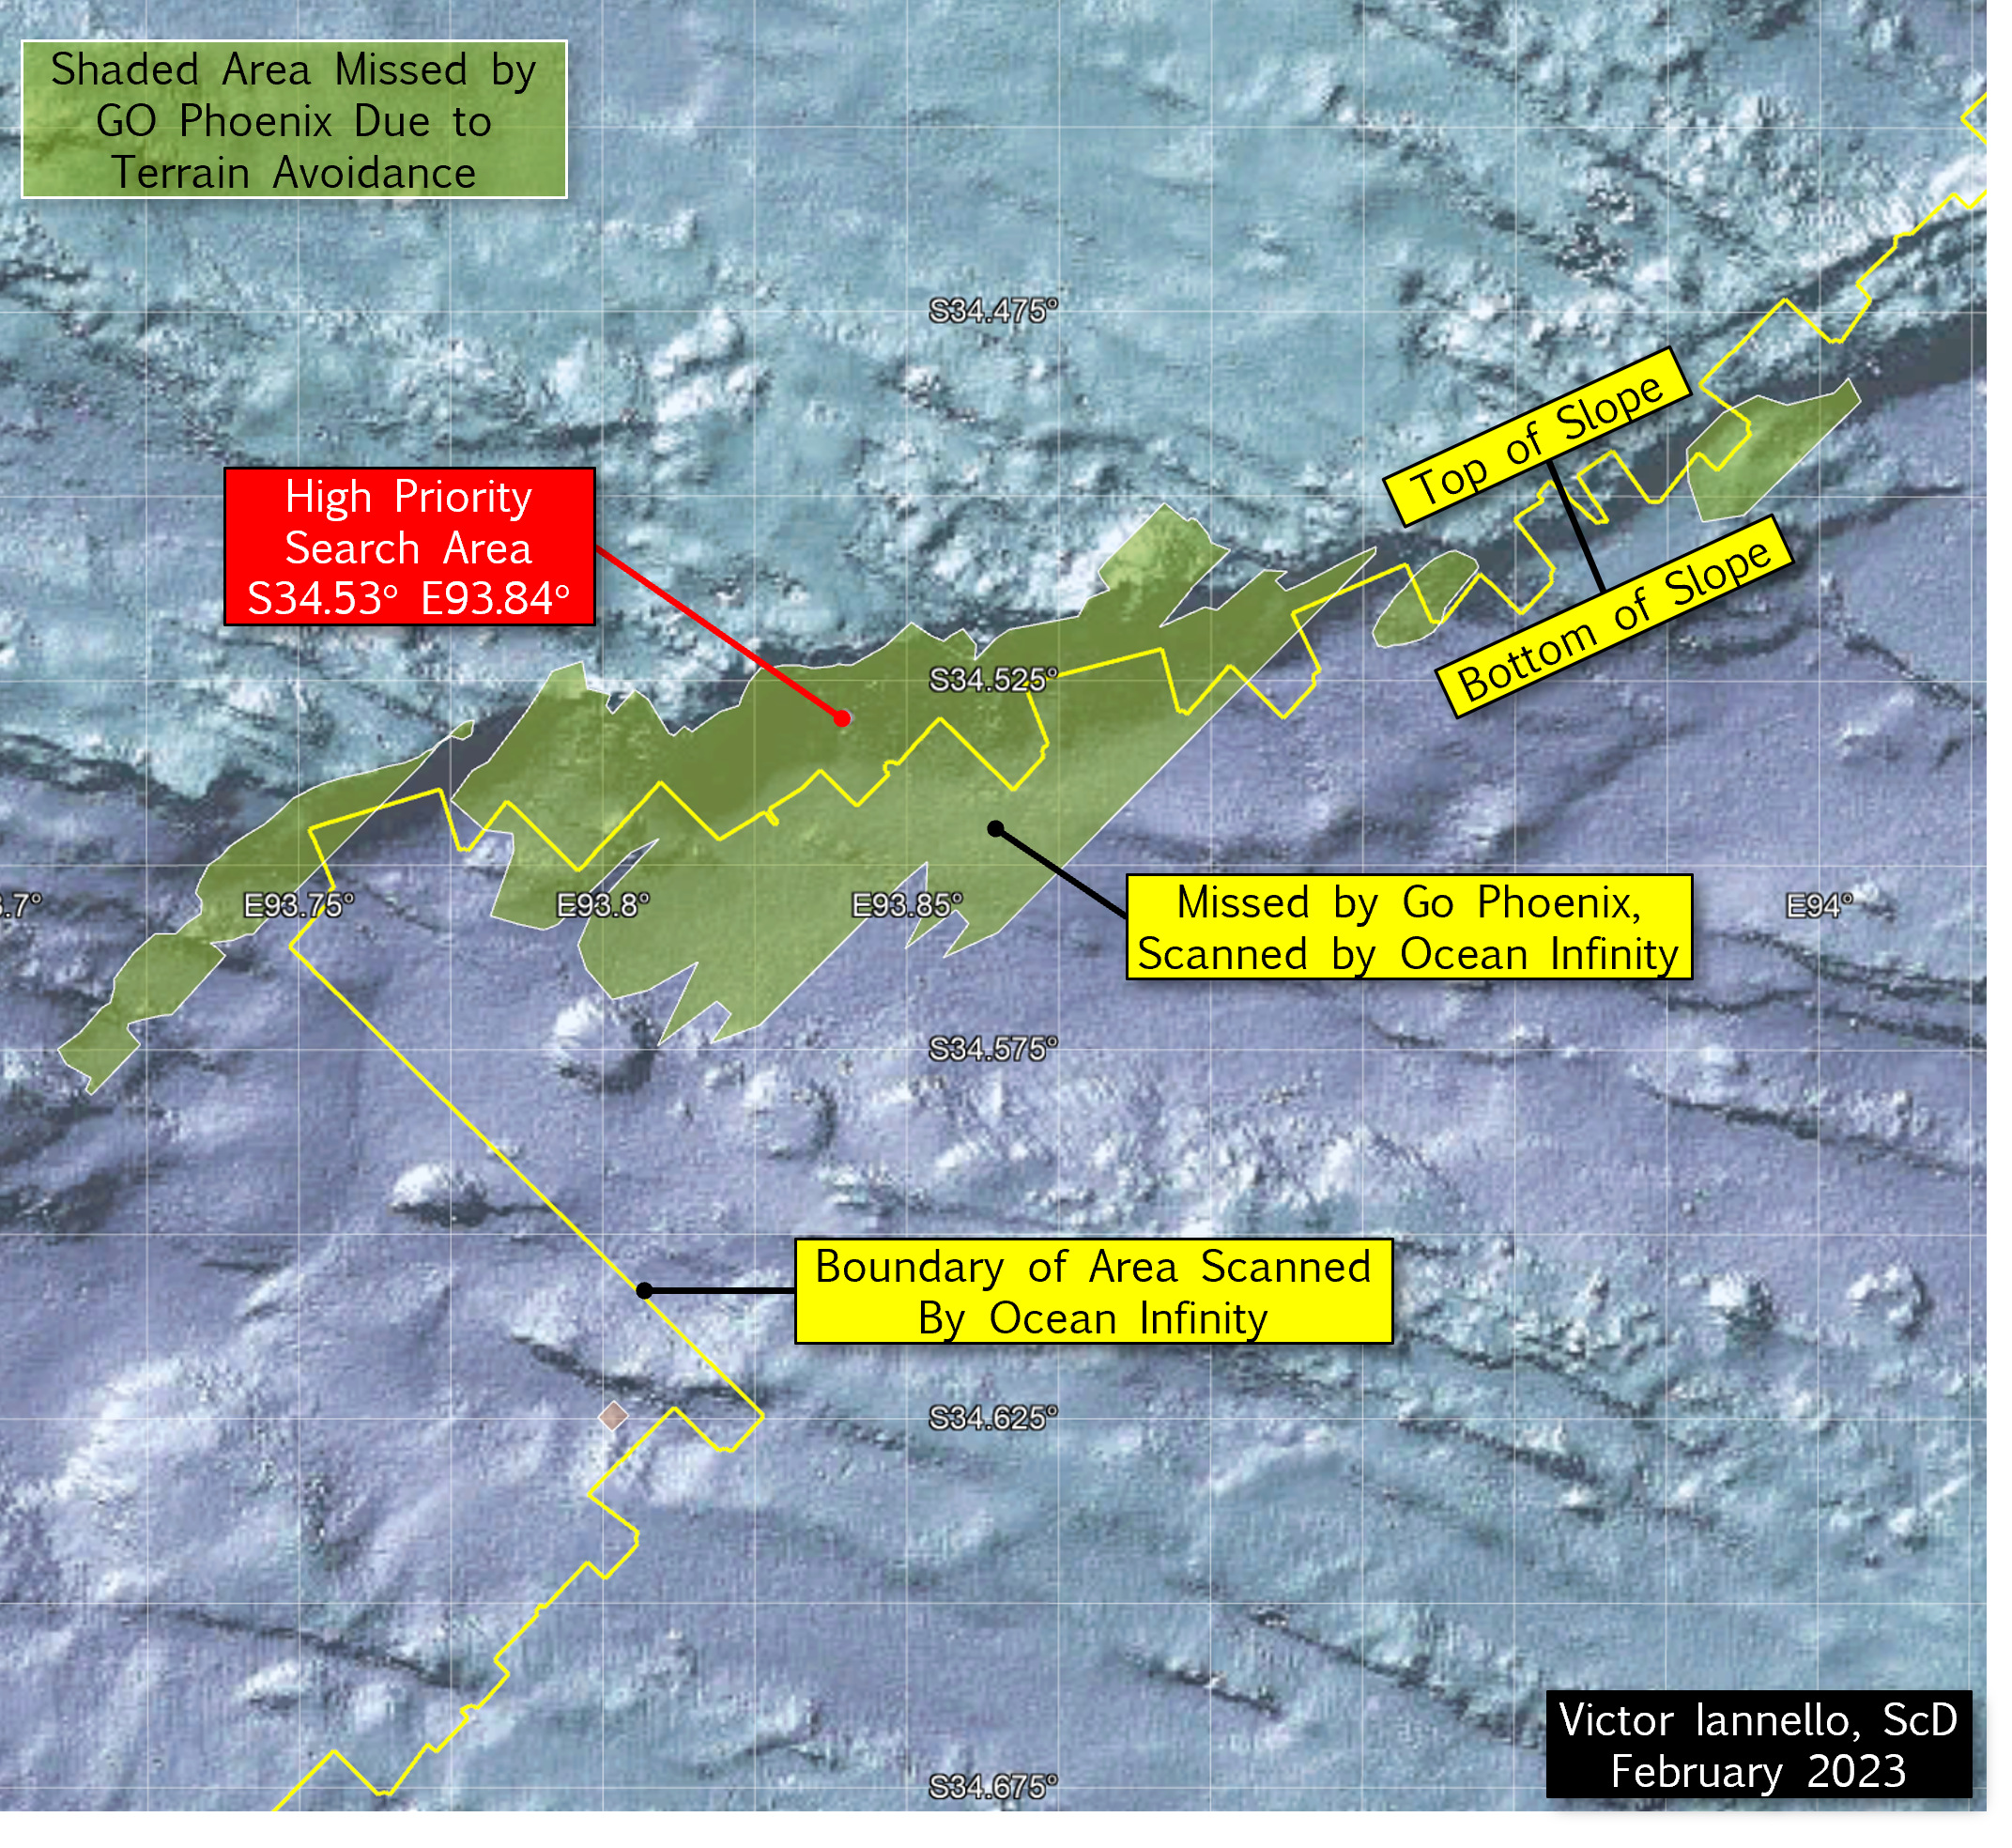
The figure below is a closer view of the High Priority Search Area and surrounding terrain.
(Click on image to enlarge.)
Discussion
Ocean Infinity has expressed a desire to resume the subsea search for MH370 in the Southern Indian Ocean (SIO), hopefully during the next austral summer that begins this December. As the a) final BFO values, b) the lack of IFE log-on, and c) the end-of-flight simulations all suggest an impact close to the 7th arc, a high priority should be to scan the areas closest to the 7th arc that were either never scanned or have low quality data before searching new areas further from the 7th arc. However, with pilot inputs, it is possible that MH370 glided after fuel exhaustion beyond the areas that were previously scanned. Therefore, searching wider along the 7th arc should also be part of the search plan if areas closer to the 7th arc are unsuccessful in locating the debris field.
The reconstructed route of MH370 proposed by UGIB remains a leading candidate for the hypothetical route to the SIO because of the accuracy of the physical models, the breadth of the data sets analyzed, and the statistical rigor applied to the BTO and BFO data. The analysis does assume there were no pilot inputs after 19:41 UTC, and the autopilot and autothrottle were engaged until fuel exhaustion. A steep slope to the south of where UGIB predicts MH370 crossed the 7th arc happens to lie along the extended path of the reconstructed route, and much of this slope remains unscanned. For this reason, the unscanned area surrounding S34.52 E93.84 should be designated a High Priority Search Area.
Acknowledgement
I’d like to thank Ocean Infinity for their help in defining the geographic boundary of their subsea search for MH370. I’d also like to thank Don Thompson for his help in GIS file format conversions.
According to a report released by Blaine Gibson and Richard Godfrey, another item has been recovered from a beach in Madagascar, and that part is similar in appearance and discovery location to parts that are from MH370. The new part is believed to have washed ashore in March 2017 and was discovered by a local fisherman at that time, but was unknown to the public until recently.
In a recent blog post that summarizes the finding of the report, Godfrey claims the debris item is likely the remnant of the left main landing gear trunnion door. In this article, we show that we can be very confident that the new debris is NOT a trunnion door.
Misidentification of the New Debris
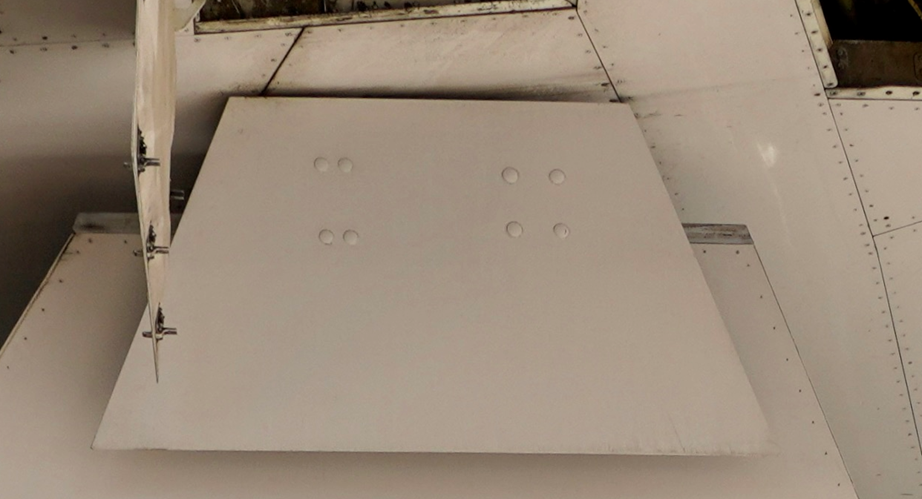
In a short technical note, MH370 Independent Group (IG) members Mike Exner, Don Thompson, Tom Kenyon, and I show why the new debris cannot be the trunnion door. To determine the approximate size of the trunnion door, we first examine a photo of the underside of a Boeing 777 in which the trunnion door can be seen. Then, using the known wing span of the B777 as a scaling reference, we can determine the approximate dimensions of the trunnion door, which are shown in the figure.
Next, we observe that the trunnion door is attached to the landing gear mechanisms by two brackets, each requiring four fasteners, as shown in this figure. That allows us to determine the position of where we would expect to see through holes through the new debris if indeed it is the trunnion door.
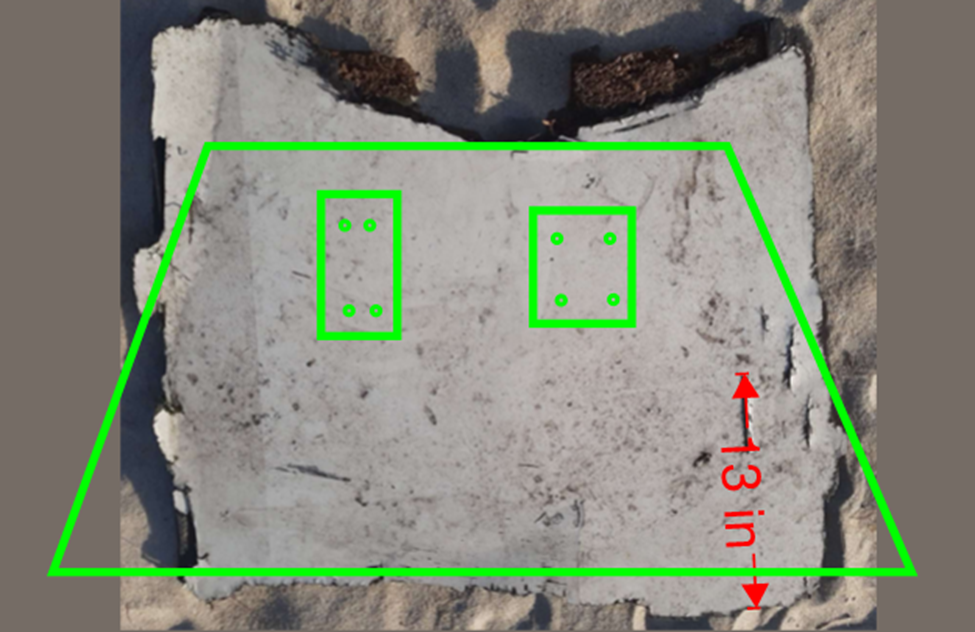
Finally, we compare the debris depicted in Gibson and Godfrey’s report with an outline of the trunnion door, and note that there are no through holes for fasteners in the locations expected. Nor do the dimensions of the new debris match the outline of the trunnion door.
Trunnion door outline on image from the Gibson and Godfrey report.
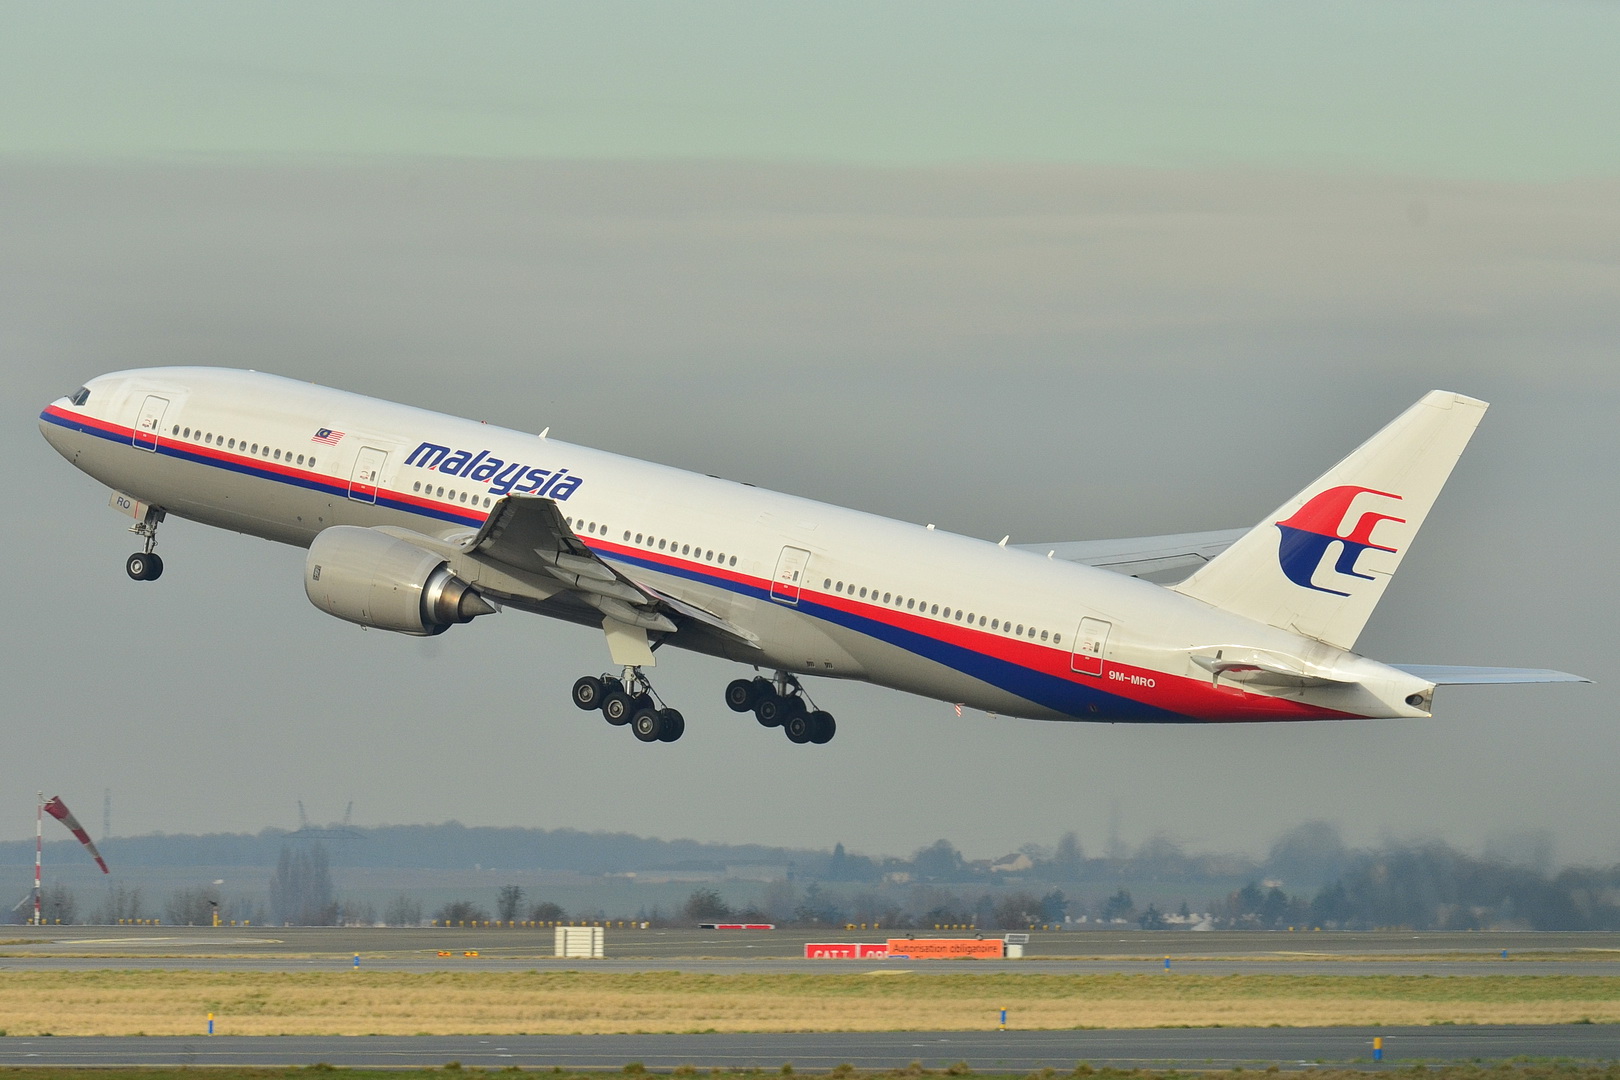
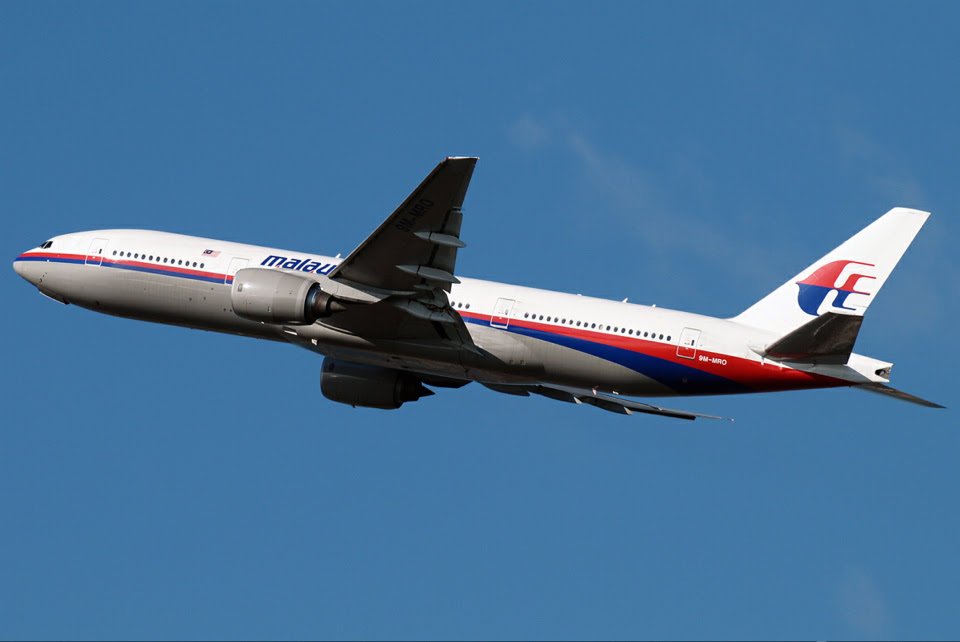
Another piece of evidence that weighs against identification as the trunnion door is the color of the paint, which is white. As Bobby Ulich says in a recent blog comment, the B777s that were operated by Malaysian Air at that time had undersides that were painted grey, not white, as seen in the next photo of 9M-MRO. Although the grey paint might have faded, other debris from MH370 that was previously recovered had identifiable paint such as livery colors and text lettering, so there is only a very small possibility that none of the grey paint would be recognizable.
Cannot Determine Landing Gear Position
There are four parallel, penetrating, narrow cuts on the new debris in which the penetrating objects appear to have entered on the interior surface of the debris and exited from the exterior, white surface. Gibson and Godfrey propose that the cuts could have been caused by rotating engine parts that separated from a disintegrating engine upon impact with the ocean. Whatever the cause of the cuts, the authors believe the damage is consistent with the main landing gear that is lowered based on the direction that the penetrating objects entered and exited the debris.
We’ve already shown that the new debris is not the trunnion door, nor is it any other part of a landing gear door, so it is not possible to surmise the position of the landing gear based on the damage to the new debris. Even if the new debris was part of one of the landing gear doors, there is no reason to believe a rotating engine part caused the damage. Components on one of the shaft assemblies in the engines would tend to fly radially outward from the engine. Yet, the landing gear doors are located aft of the engines, which are positioned forward of the wings, which means the landing gear doors are not along a projectile path. Also, when the landing gear is extended, the exterior surfaces of the doors, not the interior surfaces, are facing the engine.
Lowering the Landing Gear Does Not Increase Damage
Gibson and Godfrey propose that the landing gear might have been lowered to cause a high-speed impact designed to break up the aircraft and sink the aircraft as fast as possible to hide the evidence of the crash. However, this is not consistent with maximizing the kinetic energy of the impact, as lowering the landing gear would add drag, and could limit the attainable airspeed. After fuel exhaustion, the flight control mode would degrade from NORMAL to SECONDARY, and there would be no envelope protection that would prevent an overspeed of the aircraft. The pilot flying would only need to lower the nose by pushing forward on the yoke to ensure the aircraft would shatter upon impact.
Conclusion
The new debris recovered from Madagascar may eventually prove to have probative value. However, the debris is not part of a trunnion door from the main landing gear, nor can the debris provide any insights into the position of the landing gear when the aircraft impacted the ocean. Work continues to identify the debris and to determine any new clues about the disappearance of MH370.
Acknowledgement: This article benefited from discussions with and suggested edits from Mike Exner, Don Thompson, and Tom Kenyon.
Update 1 on February 1, 2023
Based on the construction of the composite layers, Don Thompson, Mike Exner, and other contributors to this blog believe that the new debris is more likely from the racing yacht Vestas Wind rather than from a Boeing 777. Vestas ran aground near Cargados Carajos Shoals in November 2014, and one or more pieces may have separated and floated to Madagascar.
Godfrey refutes this, and now claims that “a closer examination of the recent debris find in Madagascar proves that it is from a Boeing aircraft and cannot be from marine provenance. The key difference is the lightning protection system used on Boeing aircraft with composite materials, which is fundamentally different to the lightning protection system used in marine applications with composite materials. ” Godfrey offers this close-up photo, which he believes shows an aluminum mesh that offered lightning protection for MH370. He believes the mesh was supplied by Dexmet.
Resin infusion mesh misidentified as lightning strike protection [Godfrey comment]
Don Thompson refutes the claim that the mesh is related to lightning protection, a dubious claim that was regurgitated by Geoffrey Thomas at airlineratings.com. Don says:
The material highlighted in the photographs referred by the Gibson-Godfrey paper, and ensuing comments from the second author is not an LSP [lightning strike protection] layer; rather, it is a ‘media flow’ layer necessary on the ‘bag’ side of the composite lay-up in a resin-infusion process. That is, the resin-infusion process used by the constructor of the V065 yacht hull, its internal bulkheads and interior decks.
It’s important to understand that an LSP layer will lie immediately under the surface finish on the external face of a panel/structure as any intermediate CFRP (or GFRP) layers will form an (electrical) isolation layer.
Further, the aggregate mix surface coating that is evident in further photographs referred by the second author, and has been argued as somehow typical of B777 panels where surface protection may be necessary, is also evident on decking in video clips that document the rebuild of the seven VO65 yachts ready as they were prepared for the 2017-2018 Volvo Ocean Race. It is a common deck surface coating manufactured by Akzo Nobel/International.
Also, consider the comments from a retired, senior Boeing design engineer whose role afforded him extensive and detailed knowledge of Boeing’s composite fabrication techniques on the B777. For example: that the orientation of CFRP tape tows on the exposed side of the panel is alien to the techniques specified for the B777; that the combination of CFRP fabrication and the panel’s thickness is also alien to a B777’s construction.
The claim that this piece of flotsam originates from 9M-MRO, or any Boeing 777, is demonstrably false. Demonstrably, from the very features evident in the many images shared by the authors of the Dec 12th paper in support of their conclusion for the origin of the piece of flotsam.
The further claim that oceanographic drift studies discount this piece of flotsam originating from the Cargados Carajos Shoals in Nov-Dec 2014 before its alleged recovery from a beach near Antsiraka, Madagascar, is also demonstrably false. That assertion is false because the piece of flotsam did originate its drift, after its separation from ‘Vestas Wind’, at the Cargados Carajos Shoals on Nov 29, 2014, or within the few weeks before the yacht was salvaged and removed. How many times it beached, lay stranded, and washed out to sea again through the cycle of seasonal tides and storms is unknown, as is its final beaching and recovery time, thus rendering drift predictions irrelevant.
So, we now know that the new debris is not part of a trunnion door from the main landing gear, nor can the debris provide any insights into the position of the landing gear when the aircraft impacted the ocean. The new debris is almost certainly not from a Boeing 777, and is very likely from the Team Vestas Wind racing yacht that ran aground in the Cargados Carajos Shoals in November 2014.
Facts are stubborn things.
Update 2 on February 7, 2023
In light of the strong evidence that the new debris is from the Vestas Wind yacht that ran aground in the Cargados Carajos Shoals on November 29, 2014, I thought it would be instructive to study the path of debris that might have broken free of Vestas Wind from the accident.
To study the path of debris, I used the drift results generated by CSIRO’s David Griffin, PhD, that were created for studying how debris from MH370 drifted from hypothetical impact points along the 7th arc. In particular, I used the results of the BRAN2015 model for “generic” debris, i.e., debris that was subjected to “Stoke’s Drift”, modeled as 1.2% of the wind, but with no additional leeway drift. This is appropriate for the floating debris such as the flat panel recovered from Vestas Wind. In CSIRO’s drift simulation, 86,400 “trials” (virtual particles) were injected along the 7th arc on March 8, 2014, and the paths of these particles are tracked. Luckily, 204 of those trials passed within 100 km of the Vestas Wind accident site on November 29, 2014, so the path of those trials after that date should approximate parts of Vestas Wind that separated on that date.
In particular, I studied the timing of debris that beached on the shores of Madagascar, where a trial was classified as beached if there was negligible movement over the course of three days. Of the 204 trials, 61 trials (30%) eventually beached on the Madagascar coast. The following video shows the simulated paths of the debris originating from Vestas Wind:
(Click on the 4 arrows pointing outward to enable the full screen view.)
Based on this simulation, we make the following observations:
The first debris from Vestas Wind would reach the beaches of Madagascar in February 2015, less than 3 months from the time of the accident.
Of the debris beaching on Madagascar, more than half would arrive before May 2015, around 5 months from the time of the accident.
Very few debris would arrive after August 2015, around 9 months from the time of the accident. (The simulation ended on December 29, 2016.)
Any debris that was recovered in 2016 or later likely beached at an earlier time (likely between February and August of 2015), was swept out to sea, and then beached another time at a later date. This is likely what occurred for the new debris described by Gibson and Godfrey.
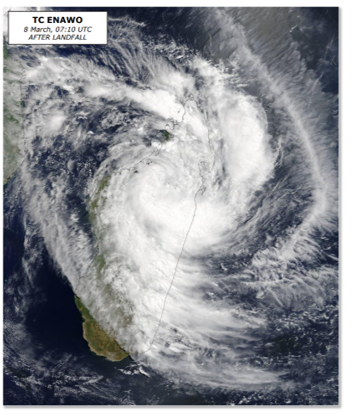
As Don Thompson noted in a private communication, tropical cyclone Enawo made landfall on Madagascar March 7, 2017, and the storm surge caused major flooding along the coast. The European Commission’s Joint Research Center published an extensive report on the storm, including the damage, as well as the number of people that were injured, missing, or died. A satellite image of the cyclone over Madagascar from that report is show below.
This tropical cyclone likely was responsible for the debris from Vestas Wind beaching on the coast of Madagascar in March 2017.
In the last blog article, I explained in simple technical terms why WSPR data cannot be used to track aircraft over long distances, and certainly cannot be used to reconstruct the flight path of MH370. The article concluded:
At long distances and at low transmission powers, the received signals from hypothetical aircraft scatter are simply too weak by many orders of magnitude. What is claimed to be discernable “anomalies” in signal strength attributable to forward scatter by aircraft are within the expected deviations in signal strength for long distance skywave propagation involving refraction off the ionosphere. Although aircraft scatter could be detected if the aircraft were close to either the transmitter or receiver and if the transmitted power were sufficiently strong, the detection of the aircraft requires signal processing to separate the Doppler-shifted scattered signal from the much stronger direct signal, and this data is not available in the WSPR database.
Since publishing that article, even more evidence supporting these conclusions was presented by me and other contributors in 667 blog comments, which include analyses of experimental data of HF scatter off of aircraft, and statistical analyses of the WSPR-tracking claims. I considered writing a new blog article with the updated results, but reasoned that the informed already understood that WSPR-tracking was junk science, the uninformed wouldn’t appreciate the significance of the new results, and the WSPR proponents were too dug in to do anything but continue to double down on their flawed theory.
A question often asked is “How were aircraft successfully tracked in validation tests?” Those that have studied the tests respond that the tests were not scientifically rigorous, and the positive results simply reflect the biases of the WSPR proponents, i.e., the data were cherry-picked to support the claims that historical WSPR data could be used to track aircraft.
One of the participants in the validation tests was Mike Glynn, who was an airline captain for Qantas. Mike has commented on the blog that he now agrees that the validation tests he helped conduct were not scientific. I repeat his comment below in its entirety and without edits:
Having just read this thread it’s appropriate that I comment on a couple of things.
My involvement with RG goes back to learning that he was after an appropriate flight to test his method of detecting aircraft via WSPR. I was in possession of a candidate plan, which happened to be my final flight in Qantas, although I was not aware of that fact at the time.
The flight was a ferry of a 747 with an oil leak in the number 4 engine which could not be repaired in Johannesburg and had to be flown, empty, to Sydney.
I had experience in post-maintenance air-tests in the 747 and this was considered desirable by QF.
The flight was planned overhead Perth and Adelaide then direct to Sydney, and due to the unusual routing, I thought it may have been a suitable candidate for a test of WSPR.
The kick in the tail was that we only got as far as Perth due to the oil leak accelerating during the flight and we diverted to Perth and landed with the engine still running, with the oil quantity indication bouncing off zero, but still with sufficient oil pressure to keep the EICAS quiet.
So, I contacted RG and the test went ahead. The test was not a success. RG initially appeared to be tracking the aircraft till it crossed the African coast, although there was a cross-track error of 20NM or so. He eventually reported that the aircraft had landed in Melbourne.
This was obviously incorrect, but he had been making some wrong assumptions regarding the aircraft type, weight and tracking and so we decided on another test which was a flight plan of a QFA330 from Apia to Adelaide.
I supplied RG with the details of the flight including weight, type and time of departure. We had done a search of most flight-trackers and the flight was not on the sites we checked. Only after the analysis was complete did we find a site which had the flight recorded; however, I do not believe RG found and used this site.
An informational error on my part at the beginning of the plan meant RG turned the aircraft the shortest way towards Australia (to the Right) after take-off, however there is a procedure for departures on RWY 08 at APIA to turn left due to terrain. RG had stated that WSPR does not supply a direction of turns so I accepted the error at the start of the plan due to the incorrect turn.
After a couple of days RG informed me that the flight was tracking to Brisbane.
We were preparing to stop the test at that point but the following day he stated that the aircraft was tracking to Sydney and the following day he stated that the aircraft had flown to Adelaide from overhead Sydney and landed there.
This was correct; however, no documentation was given to me to substantiate how he had arrived at this conclusion.
Considering the process so far, I wanted to do another test and had another one, an A380 flight from Sydney to an Asian port, ready to go.
RG declined another test as he wanted to start on the MH370 analysis. I wasn’t happy with this, but it was his decision.
However, my opinion remains that the test process was not scientific.
When RG produced his MH370 analysis it made little sense to me as an airline pilot. The track to the north of Sumatra is very irregular and I found it difficult to reconcile it to anything an airliner would fly.
I had not heard of the “loiter” hypothesis either, so the holding pattern was new to me.
I asked RG whether he had considered the weather in the area in his analysis and he said he hadn’t. Despite comments made about the weather analysis on this thread, the results make sense to me as an airline pilot, particularly the diversion away from the thunderstorms off the south coast of Sumatra.
Recently, however, I have revisited the WSPR track analysis. My knowledge of the characteristics and limitations of WSPR is basic, and I simply don’t have the appropriate background to comment on that with any authority.
However, as a former RAAF pilot, I was trained in the principles of radio navigation and off-airways navigation. Andrew Banks arrived at my squadron just as I was leaving and was trained in the same techniques.
In my opinion, the methodology used in the construction of the WSPR track does not conform to any known principles of aircraft navigation that I am aware of.
It is arbitrary in the extreme and, I believe, constructed only to satisfy the constraints of the only solid data available, the BTO and BFO data.
I realise now that I should have looked at this earlier. and avoided looking as if the construction of this track makes any sense from an aviation POV.
Thats my error.
I will be explaining why I believe this in due course.
Thank you for your time and understanding.
Mike
Perhaps this is a positive step towards a more scientific discussion of the flaws in using historical WSPR data to track aircraft.
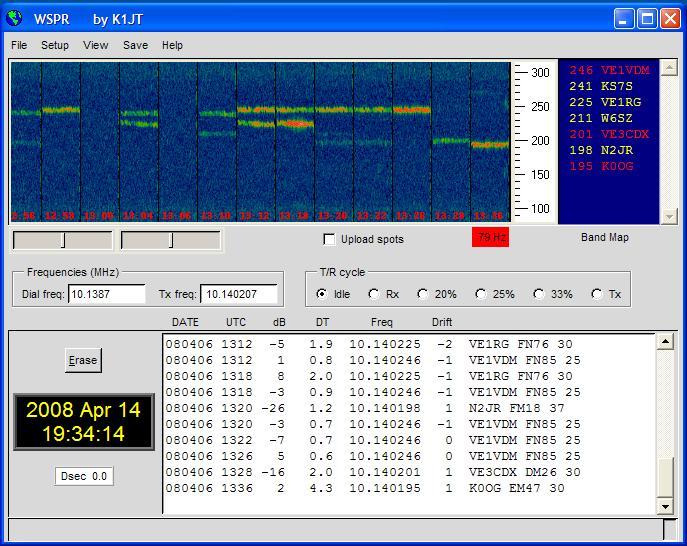
Screenshot from WSPR software as developed by Joe Taylor (K1JT)
“I do not believe that historical data from the WSPR network can provide any information useful for aircraft tracking.”
Prof. Joe Taylor (K1JT), Nobel Prize in Physics, Inventor of WSPR
Despite many stories in the media repeating claims that historical WSPR data can be used to track MH370, there are many reasons why these claims are patently false. There is broad agreement among acknowledgeable researchers that have investigated these claims, and a handful of these researchers have documented their concerns. For instance, amateur radio enthusiast Hayden Haywood (VK7HH) has created a video explaining why, in simple terms, WSPR can’t track airplanes. MH370 investigator Steve Kent published a paper that formally treats skywave propagation and scatter off airplanes, and concludes there is insufficient signal strength (by many orders of magnitude) for WSPR to detect aircraft over long distances. In fact, even WSPR creator Joe Taylor (K1JT), who won a Nobel prize in physics for his research on pulsars and gravity, told fellow MH370 Independent Group (IG) member Mike Exner, “I do not believe that historical data from the WSPR network can provide any information useful for aircraft tracking.”
WSPR Background
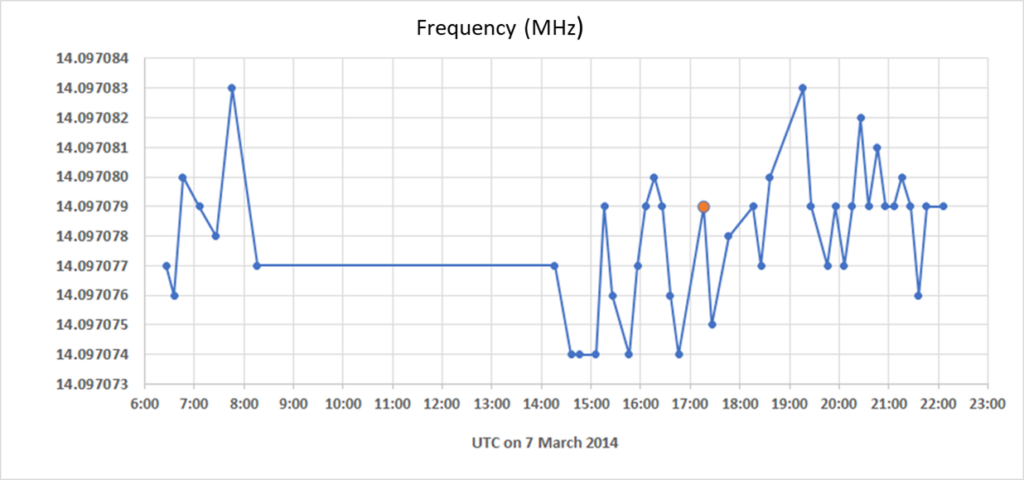
WSPR (pronounced “whisper”) is an acronym for “Weak Signal Propagation Reporter”. Amateur radio stations implementing WSPR send and receive messages using low-power transmissions to test propagation paths on the Low Frequency (LF), Medium Frequency (MF), High Frequency (HF), and Very High Frequency (VHF) amateur radio bands. When a participating station successfully decodes the transmission transmitted by another participating station, it sends that information to a central database, and that information is available to the public for retrieval. For each 110-second contact between stations (“spots”), the available information includes station call signs, locations, transmitted power, and three parameters discriminated by the receiver: signal-to-noise ratio (S/N), frequency, and frequency drift. The proposed theory is that recorded deviations (“anomalies”) in the (S/N) and the frequency shifts/drifts are related to radio wave interactions with aircraft some thousands of kilometers distant from either amateur radio station.
The theory behind using bi-static radar (i.e., transmitter and receiver in different locations) for aircraft detection and tracking is well-known, and books (e.g., this) have been written on this subject. A special case is when an aircraft crosses the “baseline” between transmitter and receiver, resulting in a “forward scattered” signal caused by the diffraction around the silhouette (projected area) of the aircraft. The Forward Scatter Radar Cross Section (FSRCS) is typically much larger than the RCS that conventional mono-static radar uses to detect targets. It is this forward scattered signal that is of interest here in evaluating whether WSPR signals can be used to reconstruct the path of MH370.
In this article we apply the well-developed theory of bi-static radar to demonstrate that WSPR signals cannot be used to detect MH370 in the manner claimed in this paper. The relevant equations are presented in the Appendix, and the inputs and the calculational results for the test cases can be found in the accompanying table in the Appendix.
Detection of MH370 Before Radar Coverage Was Lost
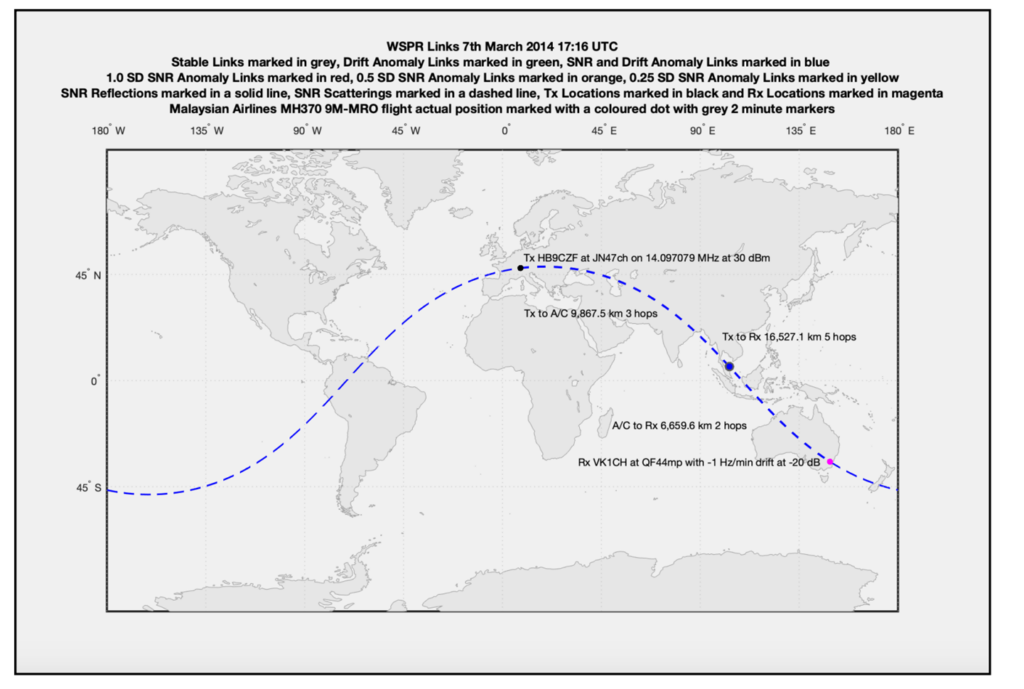
We consider the claim that the WSPR data shows that MH370 was detected on the night of the disappearance at 17:16 UTC when it was still under radar coverage as it flew over the Gulf of Thailand towards waypoint IGARI, before the turnback, at FL350 (37,200 ft). At that time, a WSPR transmission from a station in Switzerland (HB9CZF) was received by an Australian station near Canberra (VK1CH) over a distance of 16,527 km on 14.097 MHz at a transmitted power of 1 W. The distance from the Swiss transmitter to the aircraft was 9,868 km and the distance from the aircraft to the receiver was 6,660 km, as depicted in this figure from the paper:
Although WSPR contacts greater than 16,000 km are rare, this spot shows they can indeed occur. Based on the distance between the stations, the transmission from Switzerland reached the Australian station via skywave propagation in which the radio waves were refracted off the ionosphere and reflected off the Earth’s surface (“hops”) about 5 times.
WSPR Signals Forward Scattered from an Aircraft Would be Undetectable at Long Distances
The column labeled “Case 1” from table in the Appendix shows the inputs and the calculational results for this scenario. Assuming that the propagation loss is the same as for free-space propagation, the expected strength of the direct signal at the receiver is -110 dBm, which is about the same value claimed in the paper when considering hops between the ionosphere and the Earth’s surface. This suggests that the refraction and reflection losses were either calculated to be very small, or were neglected.
At 14.097 MHz, the wavelength is 21.3 m, and the FSRCS for the B777-200ER for waves directly incident to the top or bottom is estimated to be 18,791 m2, or about 23 times the projected area. The forward scattered signal at the receiver is estimated to be -210 dBm, or about 100 dB (10 orders of magnitude) weaker than the direct signal. Can a signal of this strength be detected and decoded by the WSPR software?
Whether the signal could be detected by the radio and decoded by the software depends on the achievable noise level, as a minimum signal-to-noise ratio (S/N) of around -30 db is required by the WSPR software, where the noise level is referenced to a bandwidth of 2.5 kHz. I ran some simple experiments on my Flex 6400 amateur radio to measure the achievable noise level on the 20-meter band at my home in suburban Roanoke, Virginia. At 10:30 am on December 19, 2021, on a quiet part of the band, when connected to a horizontal resonant antenna, and after setting the bandwidth to 2.5 kHz, I measured a noise floor of -102 dBm. This largely consists of manmade and natural noise received at the antenna. To determine the sensitivity of the radio independent of the environmental noise, I disconnected the antenna and connected the radio to a resistive dummy load of 50 ohms. The noise level dropped to -105 dBm. By using the radio’s built-in pre-amplifier configured for its maximum gain of 32 dB, the noise level further dropped to -129 dBm. (Pre-amplification improves sensitivity but increases the distortion from strong signals, and so must be used judiciously.) Even though this noise level would be very difficult to achieve under real conditions, I used this noise level as the reference for calculating (S/N) values on 20 meters.
So, for the forward scattered signal strength of -210 dBm, the (S/N) would be (-210 – -129) = -81 dB. This is 51 dB weaker than WSPR requires (-30 dB), i.e., the forward scattered signal is 5 orders of magnitude too weak to be detected and decoded by WSPR! Considering the very favorable assumptions we made regarding propagation loss, incident angle, and noise floor, we can be quite confident that the WSPR signal originating in Switzerland at 17:16 UTC did not interact with MH370 in any way that was detectable in Australia, as was claimed.
WSPR Signals Forward Scattered by an Aircraft Would Be Masked by the Stronger Direct Signal
Assuming the skywave propagation loss was equal to the free-space propagation loss, the WSPR signals originating in Switzerland and forward scattered by MH370 over the Gulf of Thailand would be received in Australia with a strength of around -210 dBm. However, the direct radio waves that did not interact with the aircraft would be received with a strength of around -110 dBm. That means that the direct signal strength would be about (-110 – -210) = 100 db (10 orders of magnitude!) stronger than the scattered signal. Under these circumstances, the combined signal (direct plus forward scattered) would be absolutely indistinguishable from the direct signal, even if above the noise level (which it was not).
However, the equations presented in Appendix A predict that it IS possible for radio waves to forward scatter from an aircraft and be detected under the right conditions. For example, Joki et al. studied how broadcast TV transmissions at around 50 MHz may be passively used to detect, identify, and track airliners over a distance of hundreds of kilometers. Some of the factors that determine whether the aircraft could be detected include:
The projected area of the aircraft
Strength of the direct signal received, i.e., high power transmitters near the receiver increase the signal strength
The distance of the aircraft to the receiver, i.e., the proximity of the aircraft increases the strength of the forward scattered signal
The frequency of the transmission, higher frequencies increase the FSRCS and therefore the strength of the forward scattered signal
Frequency-based signal processing to separate the direct signal from the Doppler-shifted forward scattered signal
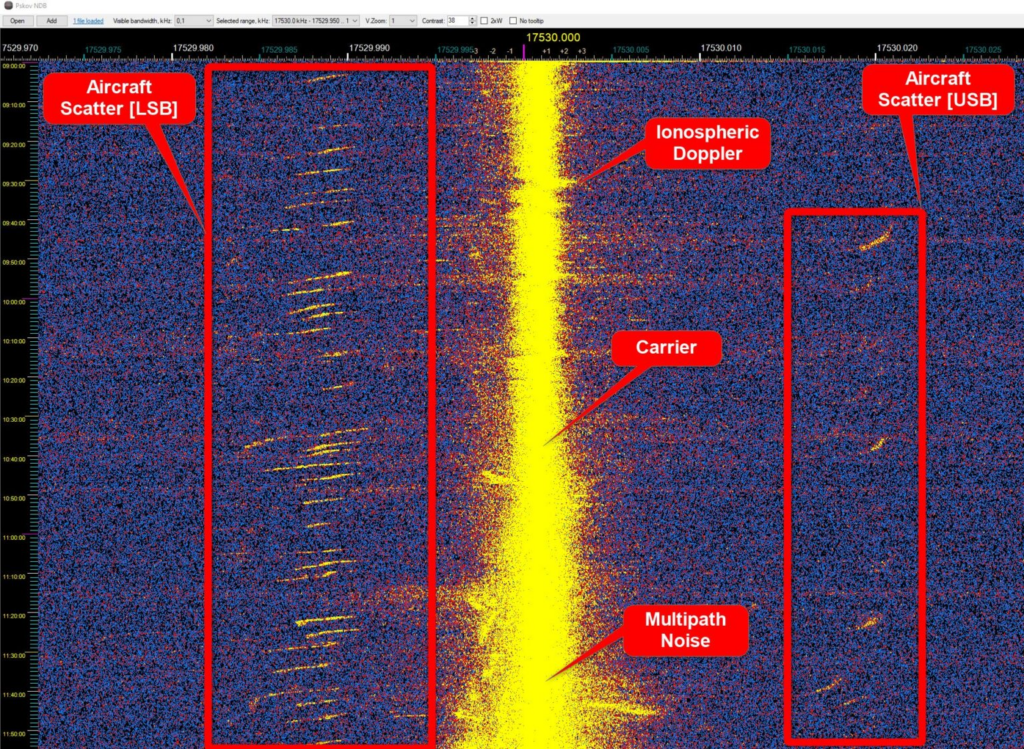
Recently, amateur radio operator Nils Schiffhauer (DK8OK) claims to have observed aircraft scatter by analyzing the signal from an AM broadcast of China Radio International (CRI), which operates on 17.530 MHz with a 250 kW carrier, and uses a beam antenna with a gain of 25 dBi towards Europe. Nils’ location is near Hannover Airport in Germany, some 7,600 km away from the CRI transmitter in Xianyang, China. The figure below depicts a “waterfall” plot showing aircraft scatter over a period of 3 hours. The Doppler-shifted signals from many aircraft are clearly visible in the lower sideband (LSB), some 5 to 20 Hz below the carrier frequency.
Waterfall plot of CRI broadcast on 17.530 MHz as received by Nils Shiffhauer DK8OK in Germany over a period of about 3 hours. Evidence of aircraft scatter can be clearly seen mostly in the lower side band (LSB).
After processing the data from a 1-hour measurement, Nils calculated that the carrier strength was -59.1 dBm, the average Doppler signal strength was -105.9 dBm, and the average noise level was -108 dBm.
I was curious if the forward scatter equations in Appendix A would produce calculational results consistent with Nils’ measurements. After using FlightRadar24 to observe flights passing near his residence, I estimated that planes landing on Hannover Airport’s Runway 27R would generally pass within a lateral distance of about 2 km and about 0.85 km (2800 ft) above his residence, which is a slant range of about 2.2 km . A good number of those airplanes were B737s, which I used to calculate the FSRCS. The inputs and the results from the calculations are shown in the column labeled “Case 2” from the table in Appendix.
We know the location, power, and antenna gain of the transmitter, and since we know the received strength of the carrier was -59 dBm, we can calculate the additional propagational loss of the skywave path due to refractions from the ionosphere and reflections from the Earth’s surface, which we estimate to be around -33 dB. The signal strength of the aircraft scatter is then calculated to be around -102 dBm, which is only 4 dB stronger than the measured value of -106 dBm. Considering that the value of FSRCS is assumed to be in the most favorable direction, the measured strength of the aircraft scatter is entirely consistent with the calculated value.
Nils concludes that since the signal from the aircraft scatter is 47 dB below the carrier, it would be impossible to look at the combined signal (which is all that is available in the WSPR database) and determine the contribution of the aircraft scatter. We strongly agree.
WSPR Signal Deviations are Not Related to Aircraft
Based on the extremely small signal generated by a hypothetical interaction with MH370 at 17:16 UTC, there can be little doubt that at that time, the WSPR database did not record a spot between Swiss and Australian stations consistent with forward scatter from the aircraft.
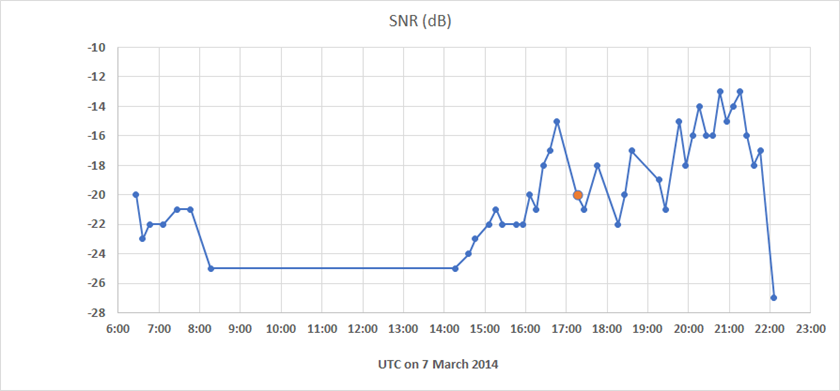
Yet it’s claimed that there was a detectable deviation in the recorded (S/N) values between the Swiss and Australian stations that is indicative of forward scatter from MH370. To evaluate this claim, Mike Exner and Bobby Ulich produced the following graph which shows the (S/N) for all WSPR contacts between the Swiss (HB9CZF) and Australian (VK1CH) stations over an time interval of around 16 hours. The particular (red) spot deemed as “anomalous” clearly shows no greater deviation from the trend than any other spot. What is claimed to be “anomalous” is within the scatter range of the other points. The dynamic characteristic of the ionosphere is all that is needed to explain these deviations.
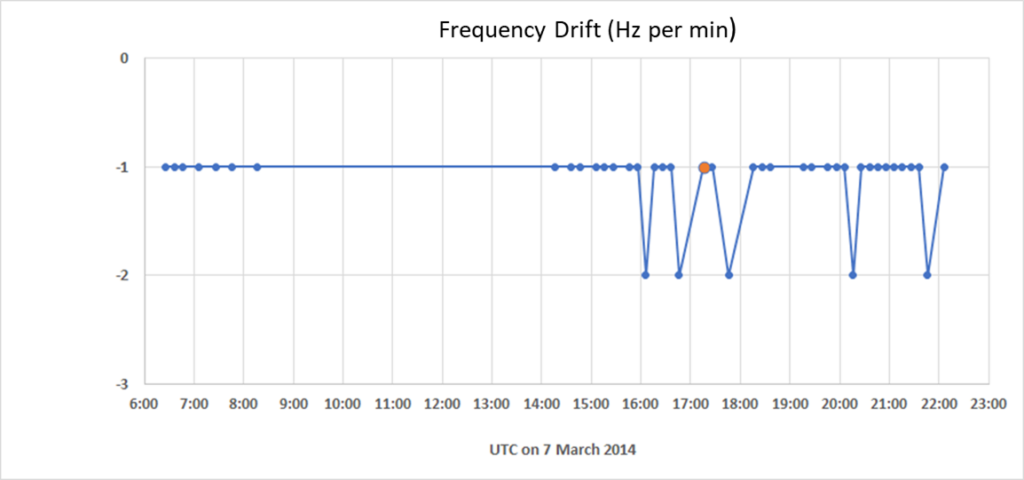
To further demonstrate that there is nothing anomalous about the spot at 17:16 UTC, Mike and Bobby produced the following graphs which show that the reported values of frequency and frequency drift at 17:16 UTC are in no way anomalous to the other values recorded on that day for HB9CZF-VK1CH WSPR contacts.
Conclusions
This article attempts to lay out in simple technical terms why WSPR data cannot be used to track aircraft over long distances, and certainly cannot be used to reconstruct the flight path of MH370. At long distances and at low transmission powers, the received signals from hypothetical aircraft scatter are simply too weak by many orders of magnitude. What is claimed to be discernable “anomalies” in signal strength attributable to forward scatter by aircraft are within the expected deviations in signal strength for long distance skywave propagation involving refraction off the ionosphere. Although aircraft scatter could be detected if the aircraft were close to either the transmitter or receiver and if the transmitted power were sufficiently strong, the detection of the aircraft requires signal processing to separate the Doppler-shifted scattered signal from the much stronger direct signal, and this data is not available in the WSPR database.
Acknowledgements
This article benefited from many private communications with Mike Exner, Don Thompson, Bobby Ulich, Steve Kent, Nils Schiffhauer, John Moore, and Ed Anderson. I also acknowledge the many insightful blog comments from Mick Gilbert, Sid Bennett, and @George G.
Update on December 22, 2021
I asked Joe Taylor for a comment on the material covered in this article. Here was his response, shared with his permission:
As I’ve written several times before, it’s crazy to think that historical WSPR data could be used to track the course of ill-fated flight MH370. Or, for that matter, any other aircraft flight…
I don’t choose to waste my time arguing with pseudo-scientists who don’t understand what they are doing.
Appendix: Equations and Table of Results
where the variable definitions and the inputs and results for the two cases can be found in the table below:
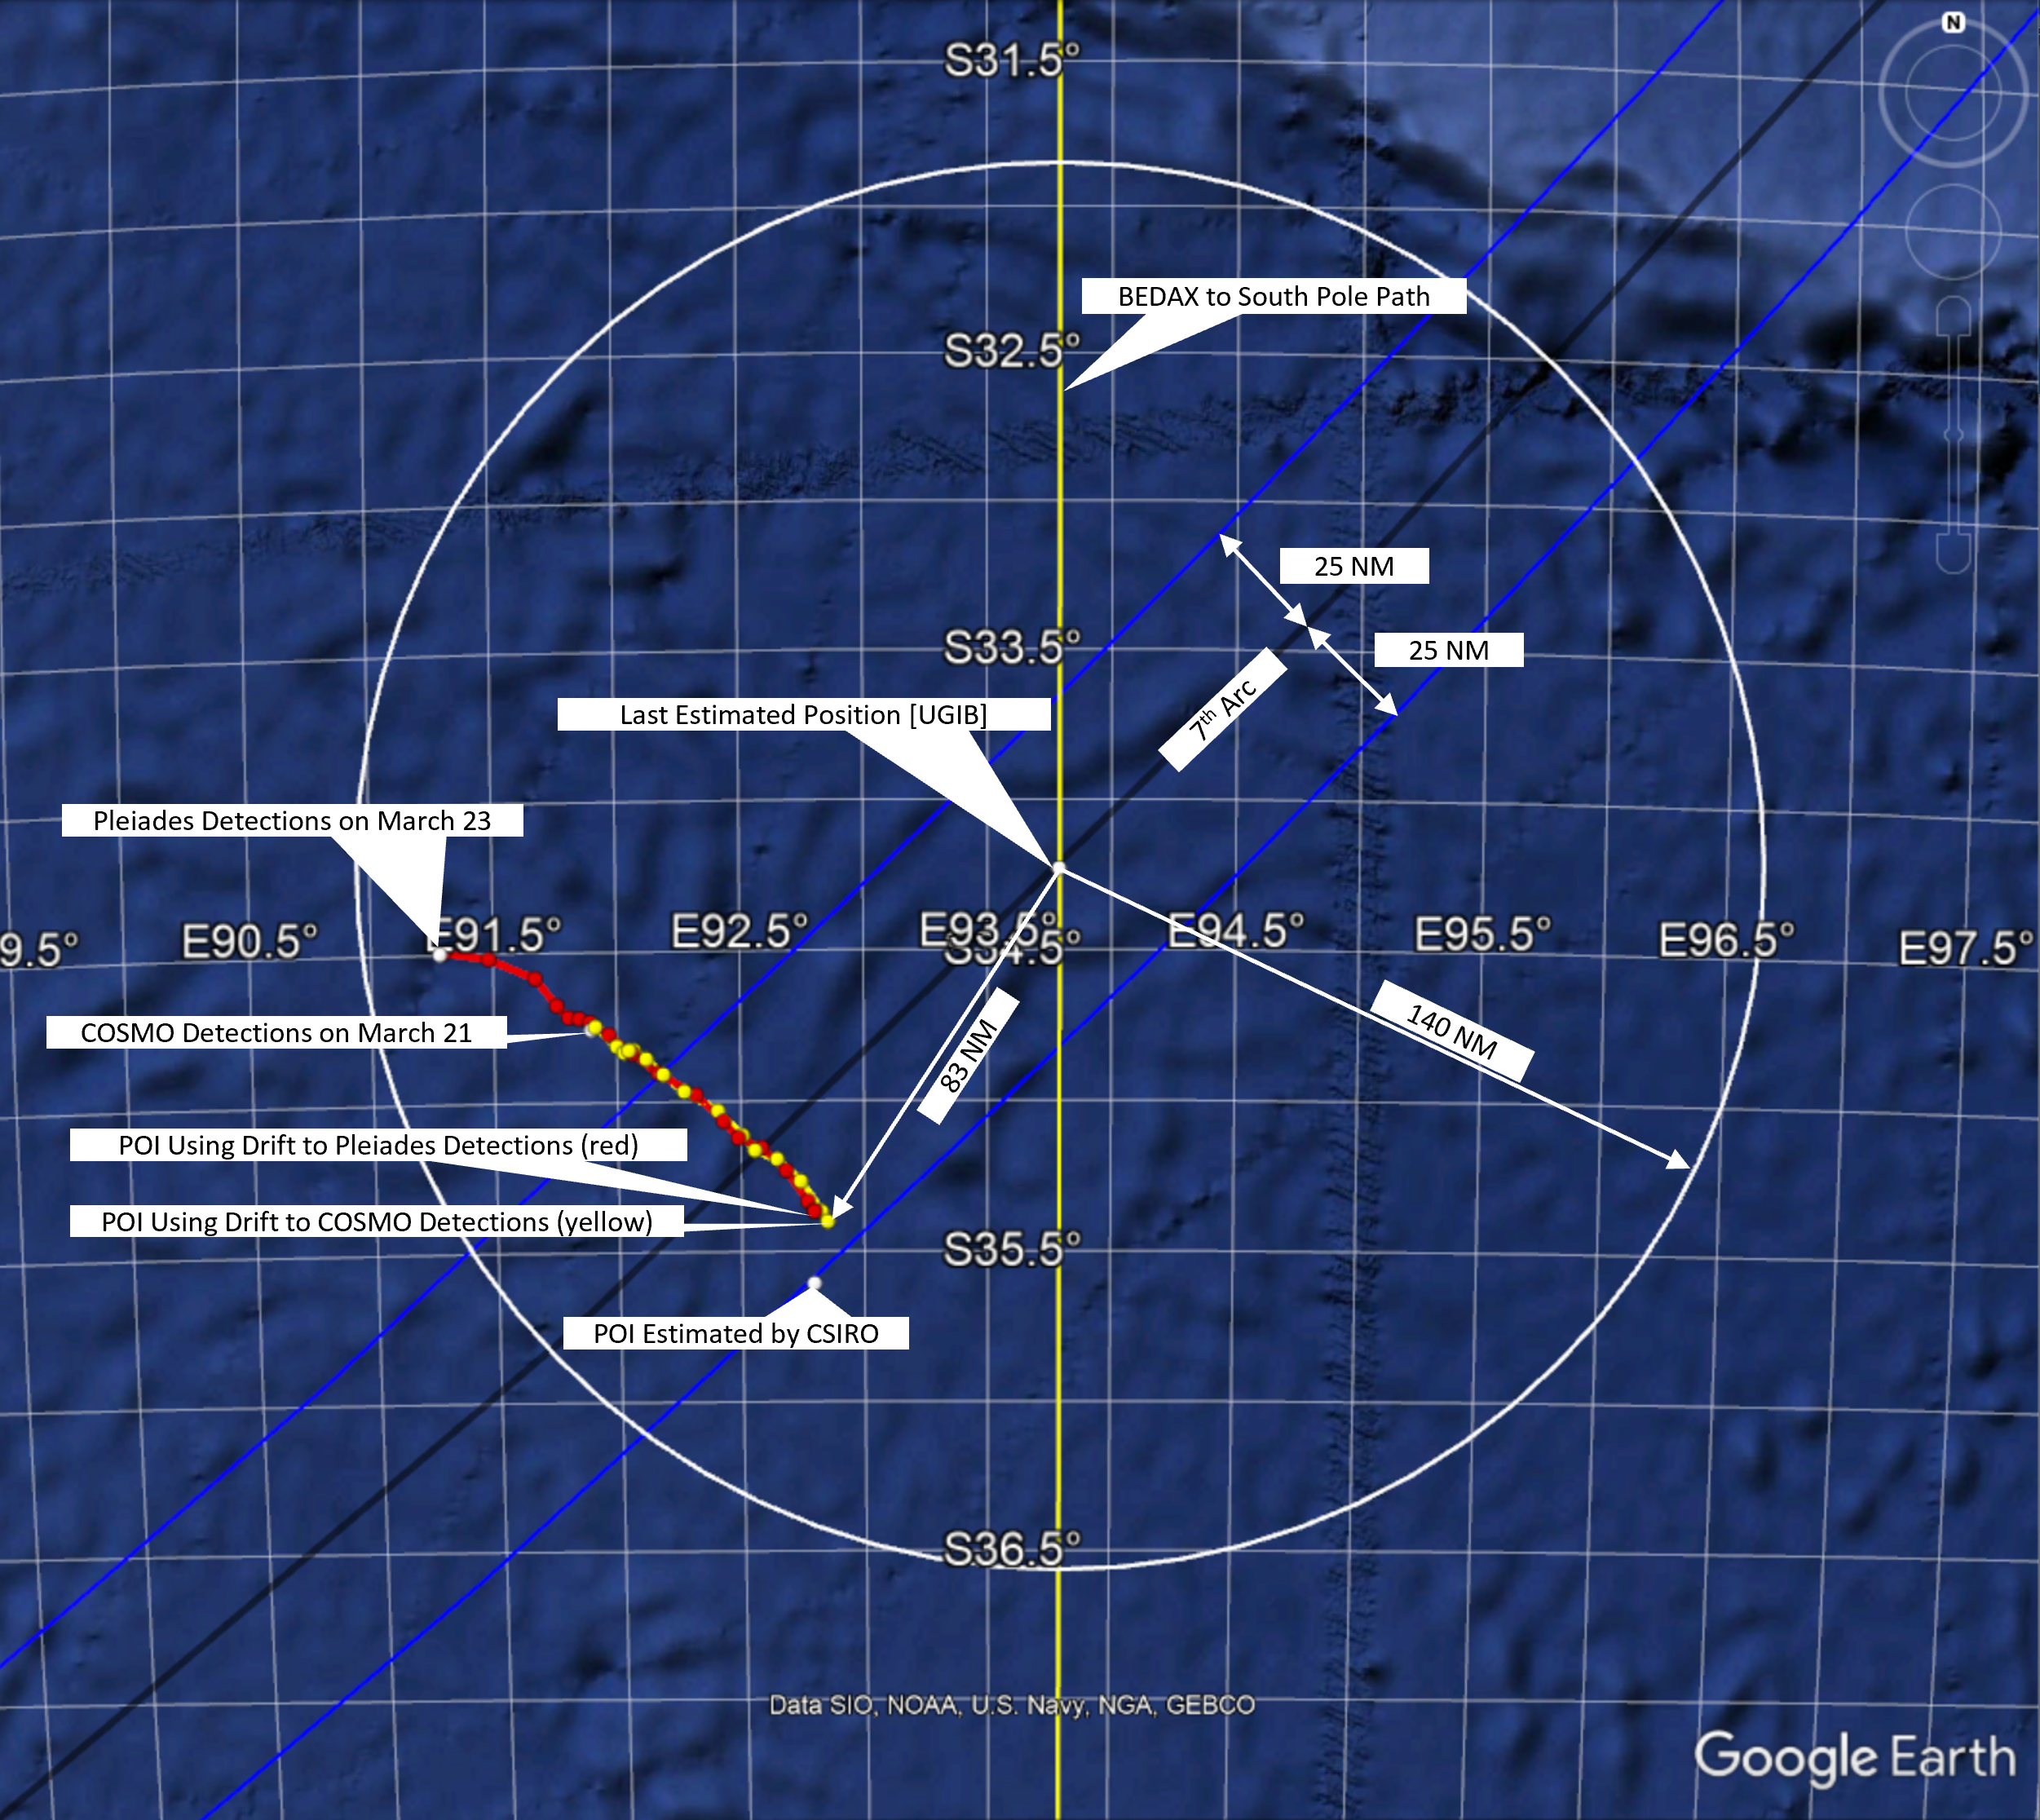
A source has disclosed that an Italian satellite that is part of the COSMO-SkyMed constellation detected three floating objects on March 21, 2014, near where MH370 is believed to have crashed in the Southern Indian Ocean on March 8, 2014. This information was never publicly released.
The three floating objects were detected at 34.9519°S, 91.6833°E; 34.5742°S, 91.8689°E; and 34.7469°S, 92.1725°E.
COSMO-SkyMed Satellite
The detections are significant because we know that a French satellite that is part of the Pleiades constellation detected what appears to be man-made floating debris on March 23, 2014, only 35 NM from where the Italian satellite had detected floating debris two days earlier. The French Military Intelligence Service shared four proximate images from Pleiades 1A with Geoscience Australia (GA) in March 2017, which then performed detailed analyses and determined that a cluster of nine objects that are probably man-made appear in one of the images near 34.5°S, 91.3°E. Australia’s Commonwealth Scientific and Industrial Research Organisation (CSIRO) then used this position information along with advanced ocean drift models to calculate the most likely point of impact (POI) to be 35.6°S, 92.8°E.
There is no definitive proof that either satellite detected floating debris from MH370. Our source also could not definitively state that there were no other floating objects detected near the 7th arc by these two satellites. However, the source believes that if there were other objects detected, they would have been shared with the MH370 search team.
The two satellites used different physical principles for detecting floating objects. The Pleiades satellite used optical sensors to capture images in multiple bands of color to achieve a pixel size of 0.5 m x 0.5 m. On the other hand, the COSMO-SkyMed satellites use Synthetic Aperture Radar (SAR) sensors to continuously scan the earth’s surface. Unfortunately, COSMO only obtained a wide-angle, low-resolution capture of the objects. On a subsequent satellite pass, attempts to capture the objects at high resolution were not successful.
Prior to 2014, researchers had already investigated using satellite SAR data to detect floating debris. For instance, in 2011, using SAR data from the crash of Air France 447 off the coast of Brazil in 2009, researchers presented a numerical method for processing the SAR data from COSMO-SkyMed to detect floating metallic objects. (HT Don Thompson.) Likely, those who have analyzed the COSMO data from March 2014 would know if the detected objects are metallic.
To determine if the objects detected by Pleiades and COSMO-SkyMed were from a common source, we used the results of a complex drift model (BRAN2015) developed by CSIRO and shared by oceanographer David Griffin. The results include the trajectories of 86,400 virtual drifters, representative of generic debris sitting flat on the surface. The virtual drifters start along the 7th arc on March 8, 2014, between latitudes 8°S and 44°S, and the trajectories are tracked for 1000 days. Our method was to find the two virtual drifters that best match the position and timing of the detections from the the two satellites. If those two virtual drifters started from nearby locations on March 8, likely the objects detected by the satellites came from a common source.
The results from the drift analysis are shown in the figure below. The yellow circles show the path of the virtual drifter that passed closest to the COSMO objects on March 21. The red circles show the path of the virtual drifter that passed closest to the Pleiades objects on March 23. These two virtual drifters start within 3.5 NM of each other on March 8, near to 35.4°S, 92.8°E. The proximity of the starting positions is consistent with a common source for the objects detected by the two satellites. That position is about 83 NM to the southwest of where a previous study estimated that MH370 crossed the 7th arc, and within the 140 NM radius recommended to search.
Floating objects detected by two satellites place MH370 impact near 35.4°S, 92.8°S. (Click on figure to enlarge)
In order to better estimate the likelihood that these objects were from MH370, we pose the following questions:
Were there other detections of floating objects along the 7th arc by Pleiades, COSMO-SkyMed, or any other satellites?
Were the COSMO-SkyMed detections on March 21 determined to be metallic objects?
Exactly what areas along the 7th arc were surveilled by Pleiades, COSMO-SkyMed, or any other satellites?
Will Airbus (the operator of the Pleiades satellites) provide the images for each color band so that independent researchers can analyze the raw data? (HT Bobby Ulich)
I recently submitted a FOIA request to the FBI for all documents related to MH370, which disappeared more than seven years ago. Yesterday, the FBI responded that the request was denied due to “a pending or prospective law enforcement proceeding”. This is identical to the response I received two years ago after I submitted a similar request. It implies the US intelligence community has relevant material that it will not release due to an open criminal investigation.
The FOIA request was one last attempt to obtain more information about MH370.
Independent investigators continue to use the data already in the public domain to guide future search efforts to find the debris field in the Southern Indian Ocean (SIO). Notably, Bobby Ulich continues to lead an effort that uses the timing and location of recovered debris, combined with CSIRO’s drift model results, to assess the most likely point of impact (POI), including uncertainty estimates of that position.
However, there exists other evidence not yet released that could aid researchers in localizing the POI:
All of the Malaysian military radar data.
Radar data from other sources, including the Singapore radar source operating in the vicinity of the Andaman Sea.
Existing subsea sonar data from Ocean Infinity to determine precisely what areas were searched and which areas have low quality or missing data due to steep terrain, sonar shadows, or equipment anomalies.
Any probative evidence discovered by the French judicial investigation.
Unpublished debris analysis, e.g., spoiler and vortex generator baseplate. (HT Mike Exner)
Boeing’s participation in detailed fuel calculations to confirm that our fuel models, which were used to help determine the southern-most limit of the POI, are accurate. Those models must include the effects of non-standard atmospheric temperatures and turning off the extraction of bleed air used to pressurize the cabin.
NTSB flight data and Inmarsat satellite data that were used by Australia’s DSTG to investigate the measurement error in recorded BTO and BFO values. (HT Don Thompson)
We are nearing the end of what is left to analyze that can realistically help us find the debris field in the SIO. Unless new data or insights are publicly released, there is not much more that the analysts can add to our understanding of the disappearance.