
Introduction
Independent researchers investigating the disappearance of MH370 today released a new technical report to guide the next search for the debris field on the floor of the Southern Indian Ocean (SIO). The report provides the scientific and mathematical foundation that was used to define the recommended search area that was disclosed last month. The authors of the report are Bobby Ulich, Richard Godfrey, Victor Iannello, and Andrew Banks.
The full report, including all appendices, is available for download. What follows is a brief summary of the important results.
The flight of MH370 was analyzed from takeoff to impact in the SIO using a comprehensive, fully integrated model. The model was developed using exhaustive data sets and technical documentation available from both public and confidential sources, and includes:
- radar data collected by military and civilian installations in Malaysia
- timing and frequency measurements collected by the Inmarsat satellite network
- aircraft performance data for Boeing 777-200ERs
- historical performance data for airframe 9M-MRO
- navigation and speed modes for automated flight
- drift analysis of debris that floated and was recovered in East Africa
- aerial search results from March and April 2014
- weather data along the flight path
A total of 2,300 possible flight paths were evaluated, and an overall probability metric was defined that incorporates the information from all the data sets. The highest probability flight path was identified as due south from waypoint BEDAX, which is about 185 km (100 NM) to the west of Banda Aceh, Sumatra, and an impact in the SIO near S34.2342° E93.7875°, which is 4380 km (2365 NM) from BEDAX.
The work included the development of an accurate fuel consumption model, and well as a statistical metric for the expected random noise inherent in the recorded satellite data. These improvements allowed the rejection of hypothetical flight paths that were previously believed to be possible.
Turnback Across Malaysia
After takeoff, the climb was normal, and the aircraft leveled at a cruise altitude of FL350 (35,000 ft standard altitude), tracking towards waypoint IGARI in the South China Sea. After flying by waypoint IGARI, the transponder was disabled as the aircraft turned towards waypoint BITOD. On passing the FIR boundary between Malaysia and Vietnam, the aircraft began turning back towards the Malay peninsula, and flew towards Kota Bharu airport, as shown in the figure below.
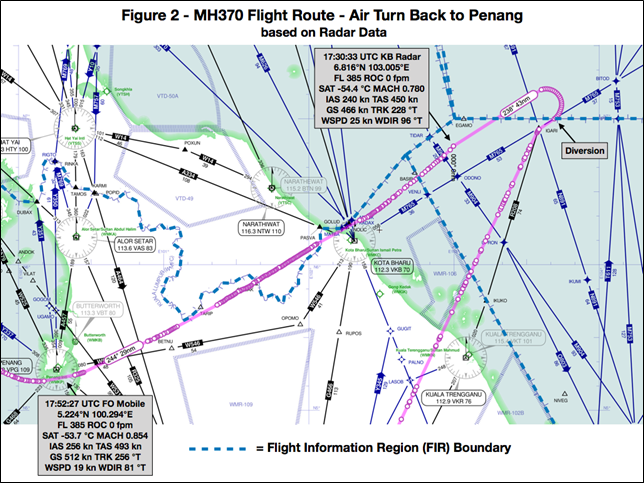
The civilian radar installation at Kota Bharu captured MH370 as it flew towards and then away from Kota Bharu. An analysis of this radar data shows that the aircraft climbed from FL350 to about FL385 (true altitude of 40,706 ft) and accelerated to near its maximum operating speed of Mach 0.87 as it passed to the north of Kota Bharu. It then flew across the Malay peninsula and towards Penang Island, where a civilian radar installation at Butterworth Airport captured the radar targets. As it passed to the south of Penang Island near Penang Airport, it slowed down to a speed closer to Mach 0.84, and turned to the northwest over the Malacca Strait.
Flight over the Malacca Strait and Around Sumatra
The flight over the Malacca Strait was captured by Malaysian military radar, as disclosed in a briefing to family members in Beijing in March 2014. After passing Penang Island, the aircraft proceeded on an exact course to waypoint VAMPI, and intercepted airway N571. The last radar target was captured at 18:22:12 about 10 NM after passing waypoint MEKAR on N571. The flight over the Malacca Strait, around Sumatra, and towards the South is shown in the figure below.
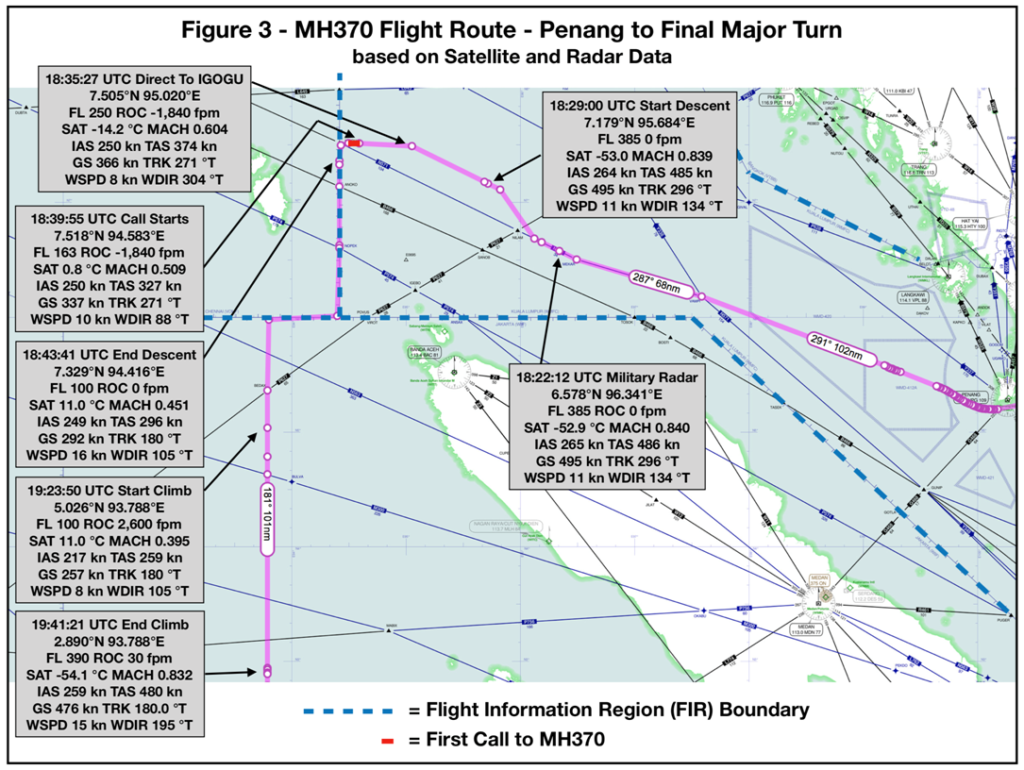
In the report, it’s deduced that soon after the aircraft was beyond Malaysia radar coverage, MH370 began a “lateral offset” that would position the aircraft about 15 NM to the right of N571, possibly to ensure separation from other traffic. Once this offset was completed at around 18:29, a descent began, and when the altitude reached FL250 (well below the minimum altitude of FL275 for traffic on N571), the aircraft turned directly towards waypoint IGOGU on a westerly course.
On reaching IGOGU, it’s deduced that the aircraft continued its descent and turned due south, flying along the FIR boundary between Malaysia and India. It leveled at around FL100 (10,000 ft standard altitude), and continued south until reaching the FIR boundary of Indonesia. It then turned to the west, away from Indonesia, and flew along the FIR boundary.
It’s further deduced that the final course change was due south towards waypoint BEDAX. After passing BEDAX, a climb to FL390 began at around 19:24, ending at around 19:41. The aircraft continued on a due south course at LRC speed towards the South Pole until fuel exhaustion occurred in the SIO at around 00:17.
The authors observe that the trajectory last covered by Malaysian radar was to the northwest along N571. Only when beyond Malaysian radar coverage was a descent to a lower altitude initiated, which was followed by turns to the west and south. It’s hypothesized that the intention was to lead the searchers into believing the trajectory continued along N571 to the northwest, as the transit at low altitude would have been below the radar horizon of Indonesian and Thai radar installations. It is only because of the analysis of the satellite data first performed by Inmarsat that we know the flight path continued into the SIO. Very likely, the party responsible for the diversion was not aware that this data set was recorded and could be later used to deduce a path.
The entire flight path is summarized in the figure below.

Possible MH370 Sighting by Kate Tee
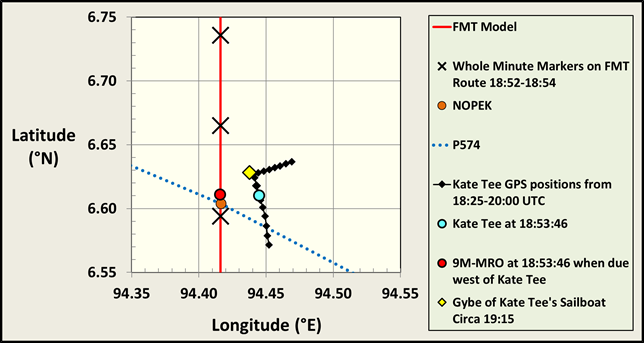
Kate Tee was on a sailboat on 7th March 2014 southeast of Great Nicobar Island and northwest of Sumatra. She reported seeing a large aircraft coming towards her from the north, flying at an unusually low altitude. At around the same time, she reported that the sailboat gybed accidentally. This gybe event and the track of the sailboat were recorded on the GPS system on board, and serves to define a position and an approximate timestamp for her sighting. In this time interval, the sailboat was close to waypoint NOPEK along the FIR boundary between Malaysia and India, which may help to explain her sighting.
The figure below depicts the path of MH370 at 18:55:57 and the GPS track from the sailing boat every five minutes from 18:25 to 19:25. The GPS track from the sailing boat and the deduced flight path of MH370 appear to align.
Probability of Various Paths to the SIO
In order to rank the likelihood of various reconstructed paths to the SIO, the available data sets were compared to predictions from the mechanistic models, and the match between the measured data and the models were used to develop probabilities for each path. For each path, probabilities were calculated for four classes of measured data:
- Measured satellite data compared with model predictions for navigation, weather, and data statistics
- Observed fuel endurance with model predictions from fuel consumption models
- Observed location and timing of recovered debris with predictions from drift models
- Failure to find floating debris compared with the areas targeted by the aerial search
The overall (composite) probability for a path was calculated as the product of the of the probabilities of the four classes of data and then normalized to produce a probability density function (PDF) in which the cumulative probability across all latitudes is unity.
Each panel in the figure below shows the probabilities for each class of data, followed by the overall probability. If only considering the match to the measured satellite data presented in the first panel, the probability is highest for the path ending near 34.3°S latitude. However there are many other prominent peaks for paths ending along the 7th arc to the north and south of 34.3°S, so further discrimination is required using the other three data sets.
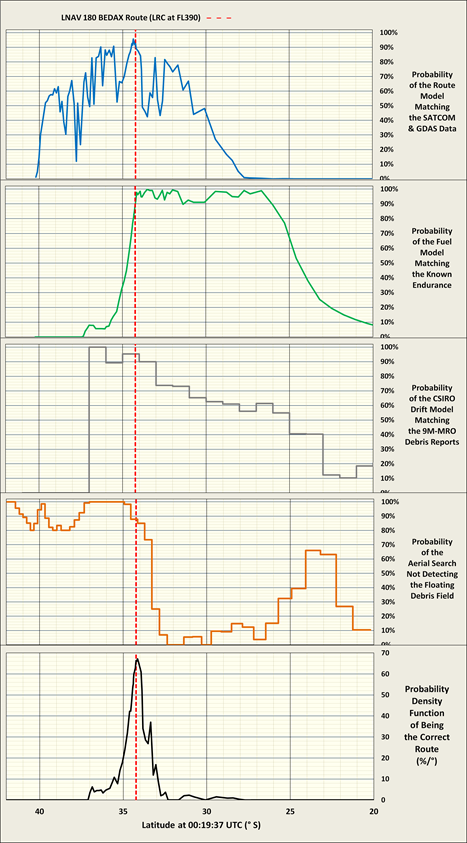
Peaks corresponding to end points to the south of 34.3°S are rejected because of low probabilities of matching the observed fuel endurance and the reports of the recovered debris in East Africa. On the other hand, end points to the north of 34.3°S are rejected because the impact would have produced a floating debris field that would have been detected by the aerial search with a high probability. What remains is a single prominent peak at 34.3°S, which represents a due south path from a position near waypoint BEDAX towards the South Pole.
Search Area Recommendation
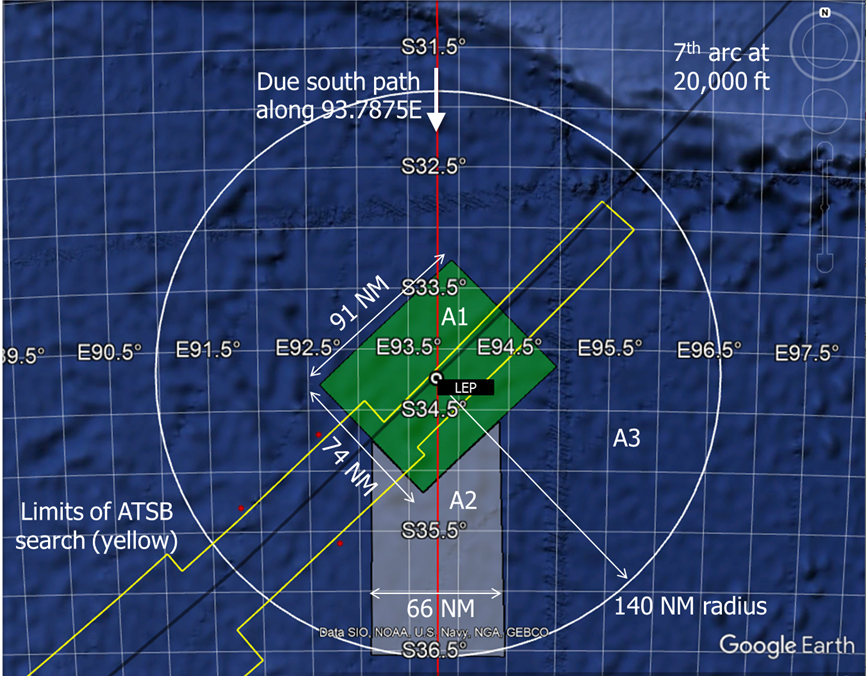
The analysis presented above suggests that MH370’s flight path in its final hours followed E93.7875° longitude, corresponding to a great circle path between waypoint BEDAX and the South Pole. Using this result, the last estimated position (LEP) is S34.2342° E93.7875°. Although some of the subsea was previously searched in this vicinity, the terrain is challenging, and the debris field might have been not detected, or detected and misinterpreted. There is also the possibility that there was a controlled glide after fuel exhaustion, and an impact well beyond what was previously searched.
To define the search area near the LEP, three cases were considered, each with an associated search area. The highest priority search area, A1, of 6,719 NM2 (23,050 km2), assumes there were no pilot inputs after fuel exhaustion. The search area of next highest priority, A2, encompasses 6,300 NM2 (22,000 km2), and assumes there was a glide towards the south after fuel exhaustion. The lowest priority, A3, is the controlled glide in an arbitrary direction with an area of around 48,400 NM2 (166,000 km2). The three search areas are shown in the figure below.
Discussion
A new report is now available that suggests that MH370’s flight path in its final hours followed E93.7875° longitude, corresponding to a great circle path between waypoint BEDAX and the South Pole. The report concludes that an impact near S34.2342° E93.7875° is most likely.
The technical details are included in the report so the analytical results can be evaluated, reviewed, and replicated by other investigators.
Three end-of-flight scenarios were considered, and a recommended search area for each scenario was defined and prioritized. As parts of the recommended search areas were already searched by GO Phoenix and Ocean Infinity, we recommend a thorough review of the existing sonar data, recognizing that the quality of the data in that vicinity varied due to challenging terrain.
As there are no ongoing MH370 search activities, the authors of the report believe the new technical results provide credible evidence that justifies a new search.
Update on March 9, 2020 – Civilian Radar Data
A newer version of the civilian radar data is now available as an Excel file. This data set represents the raw data from the Kota Bharu and Butterworth radar heads before the data was processed and stored by the radar network. This data set was used for the calculations in the report. Also included in the Excel file is the methodology for converting the raw data to latitude and longitude.
Update on March 12, 2020
The best estimate of the point of impact (BE POI) has been renamed the last estimated position (LEP), which is a more accurate description. The location is unchanged.
Update on January 7, 2021 – Links for CSIRO Drift Results
Some contributors are performing their own drift studies using the results from the CSIRO calculations. The following links can be used to download the results as MATLAB data files. The calculations were performed for floating particles that are considered “generic” and for floating particles that are hydrodynamically and aerodynamically similar to the flaperon.
Generic particles: http://www.marine.csiro.au/~griffin/MH370/data/br15_MH370_IOCC_tp3l1p2dp_arc7_4408_15_tracks.mat
Flaperon particles: http://www.marine.csiro.au/~griffin/MH370/data/br15_MH370_IOCC_tp3l1p2dpf10_20_99_arc7_4408_15_tracks.mat
Great post Victor! Many thanks!
Well we have a lot of reading to do before we post.
I thank all involved for the incredible work effort, and I am confident that there are many important new ideas disclosed. I am semi-convinced myself of the 180S start of the flight path.
@Paper authors. Thanks for this work. A couple of quick technical queries if I may.
You mention that Butterworth primary radar record runs up to 18:00:51. I thought this was 18:01:21 (ref “pure RHP clock” version)?
You say (page 11/12) we can use channel C6 BFO at 1840 because it aligns with an adjacent R4 value. But we can’t use C6 BFO at 2314 because we don’t know C6 offset. I don’t understand how you can hold those positions simultaneously. Why can’t we use the 2314BFO with whatever C6-specific offset (or offset range) that you have deduced from 1840?
Related to the last point, were there no C6 BFO observations from MH371 (or other accessible datasets) that permit empirical validation of a C6 channel BFO offset?
@paul smithson said: You mention that Butterworth primary radar record runs up to 18:00:51. I thought this was 18:01:21 (ref “pure RHP clock” version)?
In Section 5.2.1, it says Between 17:46:23 and 18:01:23, using the PSR data from the Butterworth radar data, a similar analysis was performed to calculate the ground-speed for various altitudes.
We’ll correct other times so they are consistent.
Why can’t we use the 2314BFO with whatever C6-specific offset (or offset range) that you have deduced from 1840?
This is a bit confusing. The routes were prioritized without regard to the BFO values at 23:14 because we don’t know the C-channel offset a priori. However, once the best route is selected, we can calculate the channel offset at 23:14 (for that route), and then apply that same offset at 18:40.
Thanks
Victor: Re: BFO C6 Bias
I haven’t been through the whole paper yet, so maybe the answer is in there…but how does your C6 bias value compare to what was estimated in 2017 (146.71 Hz)? Source here: http://bit.ly/2LaHqTq
@airlandseaman: Bobby would know the exact value of the channel offset, but using a linear fit at 23:14 should not be very different than the value calculated from the “best” route.
If plane turned a few times, it could have turned many times more, maybe doing a holding pattern. BTO/BFO with hourly gaps are just not enough to exclude pilot inputs in-between. Beating a dead cat. If any Australians are here, file a FOI request to your military to disclose raw acoustic data from Zenith Plateau search (which even included an oil slick sampled, chromatography should exist somewhere?)
@Kirill Prostiakov said: BTO/BFO with hourly gaps are just not enough to exclude pilot inputs in-between.
That’s correct. We can’t be absolutely sure that there were no pilot inputs after 19:41.
And yet, the BTO and BFO values after 19:41 have the same signature of an automated flight at Long Range Cruise (LRC) speed and a due south course between waypoints BEDAX and the South Pole.
What do you think the probability is that there were pilot inputs that just happened to match these automated settings?
@paul smithson
Victor states in his post “The model was developed using exhaustive data sets and technical documentation available from both public and confidential sources”.
The Butterworth RHP data goes to 18:01:23.203 UTC, a bit further than we wanted to publicly state. But you have now done that for us.
The DSTG Western Hill military radar data goes to 18:01:49 UTC, even a bit further still.
Neither data set changes the MH370 flight path in the Malacca Strait.
@All: As Richard has noted, we do have access to civilian PSR data that is slightly different than was publicly shared in a previous blog post. We believe this data set is more accurate, as there is less processing by the system before it was stored, and there are some additional points not included in the first data set. That said, the data sets are very similar.
I have received permission to share the updated data set so we’re all on the same page. I’ll update the article with a link to the most recent PSR data shortly.
@Bobby, Richard, Victor, Andrew
Many thanks for sharing the paper. An enormous amount of work and thinking has gone into this, so I’ll study with care. I started with some basic checks. The first is to run FL390 LRC in my tool with same 19:41 position. So far so good: I get a 00:11 lat of 33.40S which seems pretty close (note a small typo in your fig. 4, 00:11 lat), however I should check for implications of “air packs off” for the FF model. How much would that differ?
Could you indicate where to look for detailed parameters in relation to fig. 4, is that the fig. 35?
Many thanks for this analysis, to all the authors. You have come a long way over time, and this report contains the most plausibly constrained area I have seen so far. Well done.
Gents,
Once again an enlightening read.
@Victor et. al.
Had a viftually all day medical schedule today. So I did not put a lot of time into your excellent report.
At first blush, I am inclined to go with Figure 38.
@Niels
Many thanks for spotting the typo in Figure 4. I have fixed that in the link to the full report available for download. Victor will fix that in his post above in due course.
You ask: “I should check for implications of “air packs off” for the FF model. How much would that differ?”
The difference to the fuel flow when the air conditioning packs are switched off is described on pages 20, 36, 42 and more fully in the appendix pages 77 to 79.
You ask: “Could you indicate where to look for detailed parameters in relation to fig. 4, is that the fig. 35?”
Yes, Figure 35 gives the detailed flight parameters for the SIO flight route constrained to waypoint BEDAX and with Air Conditioning Packs off.
The text and figures of the downloadable .pdf are searchable: “packs” is found on 14 pages and “00:11:00” is found on 9 pages.
The video presentation of the new paper to the next of kin at the MH370 6th Remembrance Event on Saturday 7th March 2020 was well received, according to the family members who organised the event.
Here is the YouTube link: https://youtu.be/MgEDB36h_iA
Anthony Loke (former Malaysian Minister of Transport) was present at the event and promised to visit his successor, following the Government change in Malaysia, and push for a further MH370 underwater search.
Meanwhile, the video has been viewed 388 times.
@DennisW
You stated: “At first blush, I am inclined to go with Figure 38.”
When I read that comment, I could not stop laughing for several minutes.
Very drôle!
Figure 38 is the “Route Probability of Matching the BTOs and GDAS Data (not using BFOs)”.
Of course, I prefer Figure 39.
@All,
I appreciate all the hard work that has gone into this, but I fear it is another case of making the maths fit your preferred scenario. Just as CAPTIO came up with a route ending near CI.
Isn’t it becoming clear that this mystery could be just a random, meandering route(autopilot off-direct mode)? If this the case then multiple routes, perhaps even more than 2300 could be made to fit the maths.
@Tim: The route from 19:41 to fuel exhaustion shows evidence of automated flight. The probability of a “random, meandering route” matching a great circle path at LRC speed and FL390 is practically zero. On the other hand, the route between 18:28 and 19:41 was selected to match the beginning and end point in location and time, which also matching the BFO values at 18:40. It is true that we can’t prove that this part of the path is unique, but it doesn’t affect the end point.
On the other hand, the CAPTIO path requires multiple changes in course, speed, and altitude to fit the data after 19:41.
A B777 flying with autopilot disengaged and in direct mode would not fly the path recorded by the military and civilian radar, including the intercept with N571 at VAMPI, if that is your claim.
@Richard
Thanks a lot!
@Tim
You asked “ Isn’t it becoming clear that this mystery could be just a random, meandering route(autopilot off-direct mode)?”
No, it is becoming clear that this mystery is a carefully planned and perfectly executed diversion. There was nothing left to chance. There was no random!
We are not fitting our scenario to the maths, we are fitting a large number of independent data sources to the scenario.
@Henrik Rydberg: Thank you. The report represents an accumulation of knowledge and data gained over a period of nearly six years. You had an integral role in that.
ET302 interim report released:
http://www.aib.gov.et/wp-content/uploads/2020/documents/accident/ET-302%20%20Interim%20Investigation%20%20Report%20March%209%202020.pdf
@Richard
“… a carefully planned and perfectly executed diversion…”
Minor inconsistency.
If the perpetrator was not aware of BTO BFO then there was no perfection in this plan. However, if he knew about it, what was the plan?
Overall a great report.
@Richard said: Many thanks for spotting the typo in Figure 4. I have fixed that in the link to the full report available for download. Victor will fix that in his post above in due course.
The updated figure should now appear in the post above.
Hishammuddin Hussein, who at the time of the disappearance of MH370 was the Malaysian Minister of Defense and Acting Minister of Transport, has been appointed the Foreign Minister for the newly formed government.
https://www.nst.com.my/news/nation/2020/03/573172/foreign-minister-appointment-huge-trust-says-hishammuddin
@airlandseaman,
To expand on Victor’s answer to your question about the C6 BFO bias:
1. We did not find other instances of C6 besides the two phone calls during MH370. Apparently this channel is only used during phone calls.
2. The most accurate means of determining the C6 bias is to interpolate the 19:41-00:11 R4 BFOs at 23:14, and then find the channel frequency offset for C6 relative to R4.
3. The BFO at 18:40 cannot be independently estimated, because the flight path is unknown.
4. We found the 23:14 C6 bias by interpolating the R4 BFOs. You can use a linear fit to the 19:41-00:11 R4 BFOs, or you can use a 2nd order fit. The two methods differ by < 1 Hz.
5. We found a BFO bias of 148.9 Hz for C6 using a 2nd order interpolation and assuming the R4 bias is 149.86 Hz.
6. We applied that C6 bias to the 18:40 BFOs used in fitting the FMT Route.
DrB wrote “We did not find other instances of C6 besides the two phone calls during MH370. Apparently this channel is only used during phone calls.”
‘C6’ is a Channel Unit, a GES module that provides multiple separate channel CODECs, not a discrete channel.
The GES Log shows that three discrete channel CODECs were used for voice signalling, #3730, #3737 and #373E.
and “The most accurate means of determining [C-channel] bias is to interpolate…”
I wouldn’t characterise that as “the most accurate means”. It’s a method. Can one be confident that the performance of a demod/decoder for a continuously modulated channel be reliably compared to the performance of a demod/decoder operating on a packet data/burst channel?
As a check, would the interpolation reliably predict BFO for a T-ch burst from a preceding R-ch burst?
@Victor
Concerning Hishammuddin Hussein, plus ça change.
@Victor et. al.
Seriously, a great report. It will take me several days to digest it. One thing I find a bit strange is the “probability” ordinate. I was expecting a “probability density” ordinate. I am not sure how to get the probabilty that the wreckage is between 34.2S degrees and 34.4S degrees (34.3S +/- 0.1 degree).
@Don
You asked “As a check, would the interpolation reliably predict BFO for a T-ch burst from a preceding R-ch burst?”
The attached table shows 5 pairs of T-ch and R-ch from MH370 on the ground in Kuala Lumpur, adjacent in time, from the same Channel Unit 8. The minimum difference in BFO is 0 Hz and the maximum difference is 3 Hz.
https://www.dropbox.com/s/pfylb0grwzptp8h/Channel%20Unit%208%20T%20vs%20R%20BFOs.png?dl=0
The 29 Channel Unit 6 BFOs at 23:14/15 UTC are all CODEC #3737 and vary between 216 Hz and 222 Hz.
The 51 Channel Unit 6 BFOs at 18:39/40 UTC are either CODEC #3730 or #373E and vary between 86 Hz and 90 Hz.
Variations of 3 Hz, 6Hz and 4 Hz are all within the expected range.
I would characterise the data as reliable and accurate.
@Richard,
Thank you, I’m more than familiar with the observed and recorded data.
It is the process of interpolation, described by DrB, about which I expressed the interest.
@Don
Your “interest” in the process of CU6 interpolation in our paper is actually criticism.
You stated: “I wouldn’t characterise that as “the most accurate means”.”
Your criticism was based on the fact that the CU6 data comes from different CODECs.
Since you are so familiar with the data, then you could have pointed out that the data at 23:14/15 is all from one and the same CODEC and that there was only a small variation in the data within the expected bounds.
Just correcting the record.
@DennisW said: I am not sure how to get the probabilty that the wreckage is between 34.2S degrees and 34.4S degrees (34.3S +/- 0.1 degree).
My co-authors might disagree, but I don’t put a lot of weight on the value of the peak probability at 34.3S latitude. Rather, what is significant are the low probabilities at other latitudes.
I asked the co-authors what they thought the success probability was for A1 or A2. I’ll leave it to them to disclose what they said [if they so desire]. I put the probability of success at around 50% because we don’t know what we don’t know. If the modeling is accurate and the measured data has the errors we assumed, the probability of success would be much higher.
@DennisW
I think the probability for A1 is 90% and A1 + A2 is 97%.
@Richard. Thanks for sticking your neck out. Out of the residual 3%, how much of that is A3 – by implication, how much of it is “none of the above” aka probability that 180S is not the correct solution?
Dr. B: Re your March 10, 2020 at 11:43 am response:
On Page 148, it was stated:
Using R4 as the reference for a BFO Bias of 150.0 Hz, these channel offsets ranged from +1.0 Hz for C6 to -5.0 Hz for T12.
But above, you wrote you found a BFO bias of 148.9 Hz for C6 using a 2nd order interpolation and assuming the R4 bias is 149.86 Hz. To be consistent, shouldn’t “…+1.0 Hz for C6 …” be -1.0 Hz, not +1.0 Hz?
But I believe there may be more than a sign error in the paper. I did exactly what you stated (I used a linear fit of the R4 data) back in 2017. Using that technique, I found the exact same same R4 average (149.86 Hz), but an average of the 40 C6 samples = 146.71 Hz, not 148.9 Hz. See the summary page and page 14 in particular in that 2017 paper: http://bit.ly/2LaHqTq
Dr. B: Correction: Page 148 should read Page 143.
@airlandseaman,
There is no sign error. When you compute a predicted BFO for the phone calls using a 150 Hz BFO bias, the result is about +1 Hz too high, compared to measurements Thus the BFOR, which is predicted minus measured, is + 1Hz for the phone call BFOs when using a 150 Hz bias. The “offset” I use is the correction to be added to the raw BFO so that the predicted BFO, using a 150 Hz bias, equals the measured BFO. A +1 Hz correction puts the 2nd order trendline halfway between the high and low BFO values during the phone call. If you use the mean of the twenty-seven 23:14 BFOs, which I am not sure is more accurate because of the sawtooth errors, the correction is a little larger, about +2.7 Hz. So, in that case, the BFO bias would be about 150 – 2.7 = 147.3 Hz.
@DennisW,
You said: “I am not sure how to get the probability that the wreckage is between 34.2S degrees and 34.4S degrees (34.3S +/- 0.1 degree).”
The route probability is precisely defined in the paper. It represents the percentage of random trials (i.e., using random BTORs and BFORs), that fit no better than the current trial. It is legitimate, in my opinion, to consider the route probability as a relative value of a probability density function for the route probability alone.
The same may not be true of the composite probability we showed. The composite probability in the paper is simply the product of the route, fuel, debris drift, and aerial search probabilities. This product may not be the optimum method of combining those 4 separate statistics. One could use the Fisher method, for instance, and that result would probably be a reasonable estimate of an overall probability density function, and better than the simple product. It is desirable, as your question implies, to obtain a composite probability density function. Work is underway on this question.
@Don Thompson,
You said: “It is the process of interpolation, described by DrB, about which I expressed the interest.”
Do you have any alternate methods to suggest for estimating the frequency offset of the 23:14 phone call BFOs?
The “Combined Overall Probability” graph at the bottom of Figure 5, which is what determines the new search zone, is almost entirely driven by the “Fuel Probability” graph (2nd from top) and the “Aerial Search” graph (4th from the top). In fact, one could have ignored the BTO and BFO data entirely and still arrived at the bottom graph.
However, I am very confused by the Fuel Probability graph (repeated in Figures 15 and D-3). The only section of the paper to describe how this graph was derived appears to be Appendix D.5. Is that correct? In particular, it is stated:
“We did trade studies of SIO Routes over a wide range of LNAV true track angles. The best-fit route at each track angle intersected the 7 th Arc at a particular latitude. We evaluated the probability of each route according to fuel, debris drift, aerial search, and route fitting statistics. Therefore, we can plot any probability measure, or a combination of probabilities, as a function of 7 th Arc latitude. This is a convenient way to display and understand these results.”
So I interpret this graph as being the probability that there was sufficient fuel on board to fly a particular LNAV route, and those LNAV routes are some subset of the thousand or so routes that were part of the grid search. Is that correct? In other words, all other possible autopilot modes (true track, magnetic track, true heading, magnetic heading) are excluded? And since the particular LNAV routes do depend on the BTO and BFO data, we haven’t actually ignored them. Is that correct?
To the authors of the new report – It is a phenomenal effort from all of you and as Victor mentions – it combines everything we have read and some new analysis from the past six years. Thanks for your continued efforts in trying to solve this unparalleled aviation mystery.
Reading this report multiple times would still not suffice as each time you read it something else sticks or resonates with the reader than the previous read.
Just one query – Since this is available as a report format now on this blog, would the link to the research paper also be available on this blog? I guess it is early days but could not find the link to the research paper online yet.
@the authors
I’m also mainly looking at the fuel probability graph at the moment as it is main responsible for the “cut-off” to the south. An additional question: I assume that several routes used to construct it have different 19:41 positions. So, how are then “pre-19:41” and “post-19:41” connected / what was assumed for “pre-19:41” for the different cases?
@paul smithson
Regarding my comment “I think the probability for A1 is 90% and A1 + A2 is 97%.”
You asked “Out of the residual 3%, how much of that is A3”?
My answer is A1 + A2 + A3 is 98.9%.
We have made a number of assumptions and considered a number of sources of error. We have estimated error budgets and these are used in determining a probability estimate, whilst making some more assumptions about the randomness and potential correlations among the error sources. I am mindful of Victor’s comment that “we don’t know, what we don’t know”!
The key assumptions are:
1. Auto-Pilot engaged and LNAV mode selected, therefore navigation errors are negligible.
2. Air conditioning packs switched off for a large part of the flight, therefore an inactive pilot towards the end.
3. An ultimate waypoint of the South Pole was selected and therefore no lateral manoeuvres after 19:41 UTC.
4. LRC Fuel Mode was selected and Flight Level 390 was maintained after 19:41 UTC (no step climbs).
The key error sources are:
1. The available and required fuel, fuel speed modes selected during each leg, flight levels during each leg, the ZFW, the R/L Engine FF ratio, the PDA, Packs On/Off times, Cross-Feed Valves Open/Shut times, Fuel Balancing performed or not, Fuel Tank FQIS sensor accuracy, Engine FF sensor accuracy, …
2. The FMT route timing and distance, descent, turns, climb, R Engine INOP, …
3. GDAS air temperature and wind data accuracy, precision, interpolation, …
4. BTO and BFO accuracy, precision, offset, cabin temperature effect, eclipse effect, variation over time, …
5. End of Flight path, roll, spiral, engine restart, APU fuel, aircraft attitude, …
5. Debris predicted transit times, reporting delays, windage, buoyancy, …
6. Aerial Search estimates, detection rates, debris size, debris number, debris separation, …
@VictorI and All,
It’s clear that many man-years of work went into developing that impressive report.
I think everything is consistent and unbiased up to the 18:40 FMT. The plane appears to be flying between waypoints, even with sudden changes.
I am surprised to now see two 90 degree dogleg turns added that follow radar boundaries. That bakes in the bias of pilot intent to hide the plane, which should not be necessary. You then go back to a single waypoint BEDAX, and with the next point presume that the pilot implemented a suicide plan to the south pole.
(There was a 20 km ice floe much closer to aim for, BTW!).
Passing by the Tee witness sighting is fine, but she said she saw the plane after the gybe, not before. Timing that flyby to the minute confers more accuracy than her recall. (Though she may well have seen the plane at low altitude, and before the event that woke up her crew.) Including waypoint NOPEK right by Tee matches her estimation that the plane made a turn just after it passed.
I prefer a much simpler waypoint route to NOPEK, BEDAX, and then on to ISBIX, which is an exact low altitude match for the 2nd arc BTO, and that waypoint route is exactly tangent to the arc as shown by curve fitting.
In recent comments there has been disparagement about the probability of an arbitrary multiturn route fitting the BTO/BFO vs this suicide path and glide. That may have been asserted about the CAPTIO approach of fitting to BTO+BFO, but it’s not how I arrived at the full waypoint path.
I started with early hydrophone detections of an event near the 7th arc, but too far north for ATSB to consider.
I then used seismometers to confirm that it was directly on the 7th arc at a specific spot.
With IG search projections then heading farther north on the arc, a flyby of Cocos Island seemed feasible.
Using seismometer data, I found good evidence of a close flyover at about the right time.
Later, I checked Christmas Island, and found a weaker but isolated signature of a flyby there, too.
Now it was a matter of connecting the dots. I found intervening waypoints between ISBIX, Cocos, and Christmas Island airports. The timing of the flyovers and BTO points where arcs crossed the path determines the speed of the plane. I ignored the BFO in selecting the waypoints.
The only fudging was picking a waypoint that crossed the last arcs with reasonable speeds.
I then calculated the speed profile and BFOs, finding that the fit was still good.
The BTO tangent curve is unchanged.
What are the odds of that match?
Probably astronomical if it was random, but the path is defined by verifiable evidence.
If the evidence matches up, especially for a very narrow area that has not yet been searched, that seems like a high probability place to look.
I don’t expect to change the momentum of your collected efforts, but as you advise OI and Malaysian authorities, please keep open the possibility of additional low cost search zones. Of course the plane can only be in one place, but I would appreciate any help with FE matches and confirming my BFO calc.
I also thought I had the FE chart downloaded and bookmarked just weeks ago, along with a dropbox doc full of pointers to Victor’s papers. My browser history now has many dropbox 404 errors.
Could you please repost the VI papers link?
Would you be willing to share your fuel model spreadsheet for experimenting with other scenarios?
Thanks for tolerating my 370Location.org scenario and evidence on your site. I do try to behave.
I believe you did say when I arrived that you thought it merited more discussion!
@370location said: I am surprised to now see two 90 degree dogleg turns added that follow radar boundaries. That bakes in the bias of pilot intent to hide the plane, which should not be necessary. You then go back to a single waypoint BEDAX, and with the next point presume that the pilot implemented a suicide plan to the south pole.
The 90-degree turns follow FIR boundaries. If this route was followed, my guess is the pilot skirted Indonesian airspace to avoid both detection and interception until traveling south and away from Sumatra. There was never an intention to reach the South Pole. It was a convenient waypoint to enter that was well beyond the fuel range and would ensure the plane was as far south as possible into the SIO and remained in LNAV mode.
In any event, the route between 18:28 and 19:41 was not used to construct the route between 19:41 and 00:19. It was the opposite. Our intention was to create a feasible path between 18:28 and 19:41 that satisfied the data constraints but also could be logically justified. There is no guarantee that the proposed path between 18:28 and 19:41 is unique.
Passing by the Tee witness sighting is fine, but she said she saw the plane after the gybe, not before.
There are some unexplained circumstances surrounding her statements, and we debated whether to reference the sighting in the report. We decided to not use her sighting to discriminate among paths, but we did point out that the approximate timing and exact location of her sighting match our low altitude fly by of waypoint NOPEK, which is on the FIR boundary. We leave it to others to decide whether or not she saw MH370.
I prefer a much simpler waypoint route to NOPEK, BEDAX, and then on to ISBIX, which is an exact low altitude match for the 2nd arc BTO, and that waypoint route is exactly tangent to the arc as shown by curve fitting.
Exact tangency is not a requirement for a route. What is required is a statistical match to the BTO (and BFO) data. For relatively straight paths of nearly constant speed, the path will be nearly tangent to the 2nd arc because the BTO values reach a minimum value in that time frame.
In recent comments there has been disparagement about the probability of an arbitrary multiturn route fitting the BTO/BFO vs this suicide path and glide. That may have been asserted about the CAPTIO approach of fitting to BTO+BFO, but it’s not how I arrived at the full waypoint path.
I am sorry if I am wrong, but I believe your path requires multiple changes in speed to match the BTO values and you ignored some large BFO errors. That was not our approach.
With IG search projections then heading farther north on the arc, a flyby of Cocos Island seemed feasible. Using seismometer data, I found good evidence of a close flyover at about the right time. Later, I checked Christmas Island, and found a weaker but isolated signature of a flyby there, too.
A flyover of Cocos Island accompanied by unambiguous infrasound or seismometer data would be interesting. Previously, I wrote an article about a possible automated path over Cocos Island, and some of us (notably @David) investigated the infrasound data looking for a match. My recollection is the results were not conclusive.
Frankly, I haven’t fully explored your results. However, I do appreciate your expertise in these matters, and I was hoping that others here would take the time to understand your reports and either support or refute your analyses.
As I said in a previous comment, I cannot profess that there is near certainty that the plane is where we predict. It’s our best estimate based on our predictive models combined with a number of assumptions.
Could you please repost the VI papers link?
Here is a link for some relevant papers. It also appears at the top of the page (“Papers”).
Would you be willing to share your fuel model spreadsheet for experimenting with other scenarios?
At this point, Bobby has the most detailed fuel model. Perhaps he can respond.
@Richard
“My answer is A1 + A2 + A3 is 98.9%.”
That is very compelling.
@DennisW
You stated “ That is very compelling.”
Let us ask your daughter to organise an event in San Francisco at her University.
I will fly over and we can hold a joint presentation.
You can talk about the importance of the BFO,
I will talk about the rest! 😳
@Richard
I have been unable to ellicit any interest at all in MH370 from my daughter or my better half. Both are “coin operated” with respect to getting them to think about anything.
@370Location,
It’s not possible to put everything needed to predict fuel flow into one spreadsheet, because of the need to interpolate the GDAS data base in 4-D and the need for numerous speed and fuel flow tables for different speed settings. My program uses several dozen worksheets, and it is not user friendly. However, Appendix A contains all the equations you need to create a useful fuel model. Tables C-2 and C-3 are spreadsheet tables showing our predicted fuel flows during the entire flight. These may be used to check your calculations.
@Niels,
We fit all the 19:41-00:11 SIO Routes before we attempted to ascertain the 18:22-19:41 FMT Route. In fitting the SIO Route, nothing was assumed prior to 19:41, except that the 19:41 position be reachable from the 18:22 position in the time available. We found this was possible for all the SIO Routes we studied.
After we obtained an excellent SIO Route fit, we next worked on demonstrating the feasibility of a FMT Route that connected seamlessly in time and space at 19:41. We were able to do that for our BEDAX 180 degree route. We have not directly demonstrated the feasibility of connecting a plausible FMT route to all SIO route fits, but I think this is quite likely to be possible. In broad terms, either a descent is needed, or a Holding pattern up to 29 minutes in duration is needed prior to 19:41, to avoid arriving at the 19:41 location too early.
@sk999,
After exploring all lateral navigation methods, we concluded that LNAV was a better fit (i.e., higher in route probability) at all bearings than the other navigation methods. Therefore, the fuel model probability is based just on the LNAV routes, because they were always the superior fit to the satcom data.
@all
So I updated my comments on the MH370 search to include the Iannello et. al. new paper. (Appended at the end of the previous Bayesian commentary). The Cliff notes version is that if one accepts the new search analytics, it is best to search 33S to 35S even if BFO is discarded.
https://docs.google.com/document/d/1ayLc-x_uLo5W5uj_r5QnOhxkXsUGQ0GufY1Flxv5xSo/edit?usp=sharing
@DrB
My question was meant as follow up on @sk999 (I’m sorry, indeed you can read it differently).
In other words: So what would you assume for the fuel remaining at 19:41 (and why so), for the different LNAV routes used for constructing the fuel model probabilities, thinking they would have different 19:41 positions.
DrB said:
“After we obtained an excellent SIO Route fit, we next worked on demonstrating the feasibility of a FMT Route that connected seamlessly in time and space at 19:41. We were able to do that for our BEDAX 180 degree route. We have not directly demonstrated the feasibility of connecting a plausible FMT route to all SIO route fits, but I think this is quite likely to be possible. In broad terms, either a descent is needed, or a Holding pattern up to 29 minutes in duration is needed prior to 19:41, to avoid arriving at the 19:41 location too early.”
This remains the weakest aspect of your case. For 5 years, explaining this gap has required creativity. The time to arrive at 19:41 in your preferred case is driven by the parameters of the route to 180T. So, you are effectively working back from the 7th arc location. I believe that this is a source of confirmation bias, but does not mean that you are wrong.
(I had not intended to make a comment until I have thoroughly assimilated your paper, but decided to make this comment so as to participate in the discussion.)
@Niels,
The available fuel at 19:41 is estimated using nine cases. Three of those are the “no-descent” FMT route with various aircraft configurations. The fuel used in these cases is time-based. That is, we figure the fuel remaining at 19:41. This is virtually independent of the assumed 19:41 location. We know that all LNAV SIO Routes are reachable at their 19:41 locations. So, for all LNAV routes, there is at least one case of estimated available fuel at 19:41 that can match its 19:41 location, although it may fall short of the fuel required at 19:41 to fly to latitudes south of 36S. In addition, many of the LNAV SIO Routes will have a fuel requirement at 19:41 that will match one or more of the “descent” cases of the FMT Route.
@Sid Bennett,
Referring to the time gap between the end of the radar track and the 19:41 position (i.e., the FMT Route), you said: “This remains the weakest aspect of your case. For 5 years, explaining this gap has required creativity. The time to arrive at 19:41 in your preferred case is driven by the parameters of the route to 180T. So, you are effectively working back from the 7th arc location. I believe that this is a source of confirmation bias, but does not mean that you are wrong.”
Our unique solution for the SIO Route is independent of what the aircraft did prior to 19:41, and a definitive solution of what occurred prior to 19:41 is not essential (or even helpful). What we have proved is that our 19:41 location, which is the starting point of our SIO Route, is reachable in 4-D with either of two FMT Routes (“descent” and “no-descent”). Furthermore, either of those FMT Routes provides sufficient fuel to fly our SIO Route and achieve MEFE at 00:17:30.
I don’t see how this can be characterized as a weakness. We have shown two FMT Routes that demonstrate the complete feasibility of the SIO Route in terms of starting location, starting time, starting altitude, starting speed, starting bearing, and endurance. It seems to me this is a great strength which enhances the credibility of our SIO Route.
One statement you made is not quite correct. You said “The time to arrive at 19:41 in your preferred case is driven by the parameters of the route to 180T. So, you are effectively working back from the 7th arc location.”
That statement is untrue for the “no-descent” FMT Routes.
Our goal for both the “descent” and the “no-descent” FMT Routes was to demonstrate the feasibility of our 180 degree SIO Route. We have done that. The “no-descent” FMT Route also demonstrates the feasibility of meeting up with all the LNAV Routes, not just the one at 180 degrees. So, none of the LNAV SIO Routes can be discarded because it is impossible to fly the aircraft between the last radar contact and the 19:41 starting location of a LNAV SIO Route, but some can be eliminated because of a large fuel shortfall at 19:41, and others can be eliminated due to poor fits to the satcom data.
To the Authors,
BRV and Andrew,
QUOTE: “Figure 18 is a plot of Ground Speed Error versus time for … (Trial 854). In this case the GSEs are even smaller.”
Figure 18 is impressive. Pretty good evidence of a good fit.
You should be complimented.
@DrB
Thank you, Bobby, for explaining. The nine cases correspond to fig. 29. I’ll study that part and the appendices first more in detail before further detailed discussion.
A final question for now: what would be the estimated effect on available fuel at 19:41 if the descent to FL100 would have commenced say 15 minutes later?
@Richard, other authors
I’ve ran the FL390 LRC 180degrees route with my tool. I used 72 kg/hour per engine less fuel for packs off and a FFF of 1.015, I hope that is reasonable. The differences seem to be small if I compare to your fig. 35: Less than 5 km for the 00:11 position when starting at the same latitude as you.
https://www.dropbox.com/s/82vxjqqzl9z8uvs/check180degFL390.pdf?dl=0
I have slightly lower temperatures, which I have to check.
I’m currently using 3D interpolation. I do not interpolate for the latitude as we step rather fast through many different latitudes.
Note that the mean BTOR can be easily reduced to virtually zero by shifting the 19:41 some km’s north:
https://www.dropbox.com/s/hnokwd0dfm1r286/check180degFL390_lowmean.pdf?dl=0
oops..run..
Update
The best estimate of the point of impact (BE POI) has been renamed the last estimated position (LEP), which is a more accurate description. The location is unchanged.
@DennisW: That’s an interesting result. Thanks for diving in.
@Niels,
You said: “Note that the mean BTOR can be easily reduced to virtually zero by shifting the 19:41 some km’s north.”
Of course that can be done, but it degrades other statistics. When the route probability is maximized, the mean BTOR is not zero.
You asked: “. . . what would be the estimated effect on available fuel at 19:41 if the descent to FL100 would have commenced say 15 minutes later?
If two engines were in use at Holding speed at FL100, the FF is almost identical to LRC at FL390. So, purely from a time perspective, the fuel burned at low altitude and at high altitude are equal in the same amount of time. There is a small loss in descending and climbing, so the descent route has a bit less available fuel at 19:41 (maybe a couple of hundred kg). That difference does not depend on the length of time spent at low altitude nor on when that occurs. Of course, if one flew at LRC with the descent delayed by 15 minutes, the aircraft would be further south by about 60 NM at the bottom of the descent, which is roughly 20 NM south of NOPEK.
@Victor
Congratulations on introducing LEP
@DrB
Regarding FF FL100 vs FL390: Thank you; I am thinking about a turn south around 18:35 and a descent just after the first phone call.
In my most recent calculations I get best-fit LRC and ECON paths slightly south of S34.5 with FLs in the 330 – 350 range. Would be interesting to see if there could be scenario’s where available fuel would allow such paths.
Bravo pour votre travail, on se rapproche enfin des images satellite que j’ai relevées le 25 mars 2014 lat 42S LON 97, en tenant compte de la dérive de surface vos calculs sont cohérents
@Patrick Tissot: Salut! Ça fait longtemps. Est-ce que vous croyez toujours que les images sont mal localisées?
@Richard et al,
Congratulations on an outstanding piece of work.
I have to say that it is very encouraging to note that my rough and ready speed determination, first hypothesised in 2014, using only very limited data available at the time, is in close agreement with the new report.
In a later paper [April 2015] I tested some issues relating to the final 15 minutes of the flight and concluded that a final turn to the left, developing into a spiral dive seemed most likely. The resulting point of impact could very well lie inside the 7th arc. Victor reviewed some of these issues too, and the Boeing flight sim test results.
Hence I was also very interested in the last 15 minutes of the best-fit SIO route parameters, in table G1 of the report. I note that the required average speed over the final Leg 6 is 363 knots. But the Ground Speed Error is shown as -107 knots.
It seems me that a little more work might clarify that result. The GSE results from the modelled TAS of 483 knots and a modelled GS of 470 knots. But we know that the TAS following the right engine flame out will reduce. Indeed the discussion earlier in the report shows that the left engine will automatically go to full power, but the speed [and altitude] will gradually decrease to just above the stick shaker speed. It should be possible to estimate the deceleration over that leg and hence reduce the apparent GSE.
Actually the result may also help eliminate the possibility of a turn to the right after the left engine fails, as I hypothesised, and improve the probability of a final impact within area A1.
@Niels,
Matching the 18:40 BFOs requires a track near 215 degrees at LRC and FL385, so the route moves westward rather quickly.
Reducing the SIO altitude from FL390 to FL340 increases the FF by 1.2% and reduces the Mach by 3.3%. Range is certainly an issue at such low FLs.
@Brian,
Yes, I agree. It is an impressive piece of work.
I remain skeptical of using BFO as a route qualifier, but the authors provided a “BFO out” option for which I am grateful. It certainly looks like 33S to 35S is the best place to resume a search.
@Dr B. In your Wx interpolations in time and space, can you comment briefly on the time interpolation method? For example, does 1800Z weather pertain from 1800-2100, or for 1800 +/- 1.5 hours? Do you splice the times with hard time boundaries, or blend across the boundaries (eg 2000hrs is 2/3 weighting of 21000 and 1/3 weighting of 1800)?
@paul smithson.
To find the GDAS values, I first do a bilinear interpolation in latitude and longitude between the four corners of the nearest integer coordinates. I do this for each time and at five GDAS standard flight levels in the data base (with at least two higher and two lower). Then I do a bicubic interpolation over time and flight level.
This works well but requires a lot of computations.
Richard does a linear interpolation in all 4 parameters. To save time during runs, he pre-calculates some of the intermediate steps.
We have extensively compared our results. The agreement is generally excellent. I don’t think it matters which of these two methods you use. Both are sufficiently accurate that the dominant error is in the values in the data base, not in the interpolation method.
Thanks Dr B – I’m inclined to agree that “I don’t think it matters which of these two methods you use. Both are sufficiently accurate that the dominant error is in the values in the data base, not in the interpolation method.” But could you also clarify: for 1800 Wx in your GDSS database, is 18.00 the temporal mid point of 16.30 – 19.30, or does 18.00 refer to 18.00 – 21.00 with a mid-point of 19.30?
@paul smithson
You asked “But could you also clarify: for 1800 Wx in your GDSS database, is 18.00 the temporal mid point of 16.30 – 19.30, or does 18.00 refer to 18.00 – 21.00 with a mid-point of 19.30?”
The GDAS data is available every 3 hours from midnight 00:00 UTC each day.
Both Bobby and I use the GDAS data on 7th March 2014 at 15:00 UTC, 18:00 UTC, 21:00 UTC and on 8th March 2014 at 00:00 UTC and 03:00 UTC. We cover the entire solution space of MH370 both spatially and temporally.
So the GDAS data at 19:30 UTC is a temporal interpolation at a given latitude, longitude and altitude, in my case between the data at 18:00 UTC and 21:00 UTC, in Bobby’s case considering the wider trend between the data at 15:00 UTC, 18:00 UTC, 21:00 UTC and 00:00 UTC.
For the MH370 route based on a BEDAX LNAV 180° South Pole at FL390, the wind direction reverses between 22:17 UTC and 22:25 UTC. This is the only critical phase in the temporal interpolation, but since we recalculate all flight parameters every minute, even these 8 minutes are well determined. Figure 17 in the paper shows the SAT, Wind Speed and Wind Direction en-route.
@Richard
Is the ROC at 19:41:03 included in the BFOR calculation in fig. 35 / how much would be the contribution?
@Richard. Thanks for that clarification. I see also that the basic GDAS model is run x4 per day and so the 3-hr interval outputs are presumably an interpolation from the 6-hourly.
Have either you or Bobby, by any chance, had an opportunity to test your route with an alternative weather model wind/temperature field, eg ECMWF or the one that the DSTG used (ACCESS-G)? Of course, no model is going to be perfect and I understand that your error/noise modelling accounts estimates uncertainty in the weather model. Nonetheless, it would be informative to see how the solution path performs under different weather models.
@DrB,
Thank you for the details on your fuel model. I was hoping for a simpler solution, of course. It sounds like recreating your model with GDAS could be a graduate thesis in itself.
The largest uncertainty in FE appears to be the 1.4% 2-sigma error for the initial fuel load. I recall an email discussion with Tom of LANL from 2016 (after I first found a loud southern event) about the possibility that the plane might have had more fuel than indicated. Don had provided info that the crew gets ultrasonic tank level readings, but they have discretion when entering the values that are used by the FMC and reported by ACARS.
Tom ran some estimates on the climbout performance based I think on an assumption of accurate FF. His conclusion was that the initial fuel load was in the ballpark. With improved performance and FF history, I wonder if refining the departure fuel weight is possible, if not already done. I’m assuming that the plane has no load sensors on the gear to measure the true weight and COG, but that it’s all calculated.
@VictorI,
Your Cocos Island scenario is a fascinating read. The big surprise was that the KIAS was reduced to 210 for landing, but the plane never left FL320 and flew on at that KIAS with a ground speed of 354kt. I looked up the YPCC charts and it’s weird that the runway 15 magnetic headings are both 151 and 152, and deviation varies between 2 and 3 deg. I used the distance from the outer approach waypoint and your fuel spreadsheet to figure your flyover time would be 22:18:41 UTC. My detection is centered around 22:22:22 UTC.
I also figured the time to your FL350 7th arc at your groundspeed from my flyover, and get an arrival at 00:21:22 UTC. Using a lower altitude 7th Arc makes it almost right on. BUT, that’s probably to be expected at any flight heading if the speeds are based on the arc timing.
I note that the currents would carry heavy flotsam SSW away from the aerial search coverage around the ULB pings, and the winds going NW would bring lighter debris to where it could have been detected.
There are no good hydrophone detections there, but beam-forming the Pilbara seismic array last year showed a possible arrival at 00:23:30 from bearing 272.8 just N of the ULB ping search (but distance unknown).
Sorry to be so late to reviewing your report!
@Niels
The ROC is not included in the BFOR calculation in Figure 35 at 19:41:03 UTC, which shows a BFOR of -6.5 Hz.
To zeroise the BFOR at 19:41:03 UTC requires a ROC of ca. 320 fpm.
The climb model predicts a ROC of ca. 400 fpm at 19:41:03 UTC.
@paul smithson
We have done spot checks between GDAS and other weather models and are generally satisfied with the GDAS accuracy.
As mentioned in G.4.1 on page 156, we did perform a comprehensive check between the ACARS Position Reports and the GDAS weather model for 57 positions of MH371 during the flight from Beijing to Kuala Lumpur for various altitude between 27,600 feet and 40,000 feet.
We concluded the temperature differences were about 1-2 ° C. The wind differences were about a knot in speed and several degrees in direction.
The average temperature predicted – actual difference over 57 measurements was +0.9 °C.
The average wind speed predicted – actual difference over 57 measurements was -0.7 knots.
The average wind direction predicted – actual difference over 57 measurements was -11.4 °T.
The large wind direction average difference during the MH371 flight is again due to the wind reversing direction between 05:29 UTC and 05:49 UTC, whilst MH371 was over the South China Sea and Vietnam. Removing that 20 minute timespan from the calculation, changes the average difference from -11.4 °T to +2.4 °T.
When passing through the eye of a cyclone or anti-cyclone, the spatial and temporal GDAS accuracy cannot match the accuracy of the actual measurements from an aircraft’s FMC, for a short period of time.
@Richard
Thank you, Richard. I’m currently checking if both the path curvature I typically see in the first hour after 19:41, as well as the 19:41 BFOR can be explained in a certain way. The hypothesis I’m checking is that the climb occurred between 19:41 and 20:41. It would not necessarily mean that the 00:19 position would change, but it’s clear it would impact fuel considerations.
The combination of LRC FL350 with 00:19 position around 35.5S, with a long (over an hour) low flight level (FL100) will not work. The 19:41 position will be too far north to connect the parts.
I’m now looking at FL350 from 19:41 onwards; my best fit LRC path leading to S35.4 has a 19:41 latitude around N1.4, which might be achievable through an early (18:30 – 18:35) turn south.
@DrB might be right that the fuel is an issue for such path: Around 27.9 tonne fuel needed at 19:41.
@Richard et al,
Referring again to table G1 in your report . . where the final leg shows a GSE of -107 knots.
To test the suggestion I made a day or so ago, I have done some elementary calculations to determine if a significant improvement can be made to the Leg 6 GSE by incorporating a deceleration in the TAS following the REFE.
I am not able to determine from DrB’s analysis exactly when the REFE occurred in his most likely scenario, which I think is 7B1, but based on much earlier work we did on fuel flow I will assume that this time is 2 minutes before 00:11 utc.
We also know, based on the sim tests carried out by Mike, that the deceleration immediately following REFE is approximately linear at 19 knots/minute, presumably down to just above stick-shaker speed if the left engine continues to operate. In our case this lower speed may not have been reached before the LEFE occurred.
So, making some broad assumptions, if the REFE occurred at 2 minutes before 00:11 utc, then the TAS at 00:11 is likely to be 445.6 knots [483.6-38]. The average speed for Leg 5 will change only an insignificant amount, so the GSE for this leg remains as in Table G1.
Then, continuing the deceleration through Leg 6, until the LEFE at 00:17:37, the TAS at that time will be 445.6-6.5*19, or 322.1 knots.
If I then assume, because the flight trajectory from that point is indeterminate, that there is no further deceleration, and that the track remains straight, then the new average distance travelled is 52.3 nm, and the average speed is 369.3 knots.
The resulting GSE of -6.2 knots looks like a significant improvement to me.
In this elementary calculation I have not incorporated the wind vector. It is a lot easier for you to do that in your model, but a quick check suggests that this will improve the result even further.
@George G
Many thanks for the corrections you spotted in the paper. The download link in the post has been updated with the correct references on page 36, 122 and 123 as well as a clarification on page 120.
@370location
RE: “…the possibility that the plane might have had more fuel than indicated. Don had provided info that the crew gets ultrasonic tank level readings, but they have discretion when entering the values that are used by the FMC and reported by ACARS.”
The fuel quantity indicating system (FQIS) uses ultrasonic sensors to measure the fuel height at various locations within each fuel tank, and a densitometer in each tank to measure the fuel density. The fuel quantity determined by the FQIS is displayed on EICAS and is also used by the FMC until engine start.
The FMC fuel quantity may be overwritten by the crew, but that is not the normal procedure. Further, if the FQIS is operating normally, a manual entry will be deleted at engine start, at which point the FMC sets its fuel quantity equal to that determined by the FQIS. The FMC then uses fuel flow to determine a calculated fuel remaining.
Given the checks that are performed after refuelling, it’s unlikely the aircraft had more fuel than indicated. An independent check of the fuel quantity is
@Andrew,
Thanks for filling in the details on the fuel measurement procedure. I may have misunderstood how much discretion the crew had. If ground crew were informed of the post-fueling checks, then I suppose there would be a paper trail. It sounds like it would take a manual override after engine start to create altered FMC readings.
I’m not advocating that anyone would have done that, but if other deceptions like radar avoidance are part of the new scenario, then I thought it should be considered.
Your last sentence appears to be truncated, leaving me
@370Location
There certainly is a paper trail after refuelling. The fuel uplift (as recorded by the fuel truck) is added to the fuel quantity before refuel and the result compared to the fuel quantity indicated by the FQIS. Any discrepancy outside the allowed tolerance is investigated, by dipping the tanks if necessary. The figures are recorded on a refuel record document, a copy of which remains with the maintenance engineers when the aircraft departs. Unfortunately, a copy of MH370’s refuel record was not included in the SIR or the leaked RMP documents.
The crew would not normally enter a fuel figure in the FMC unless there were a problem with the FQIS, in which case the fuel on board would need to be manually entered in the FMC.
@Richard
Because of possible fuel issues for LRC paths ending further south, I started looking at ECON mode. I found a potentially interesting path, see link:
https://www.dropbox.com/s/td9aos8g39pxw2d/ECON_FL350_v1.pdf?dl=0
In your “matrix”, have you checked FL350 for ECON_CI52 in the vicinity of 180 degrees?
Could you perhaps run the path with your tool? (I haven’t cross-checked any ECON paths so far)
It might need some minor optimization of the initial position because of small differences between tools.
@DennisW said: One thing I find a bit strange is the “probability” ordinate. I was expecting a “probability density” ordinate.
We agree. This has been changed in the article and in the paper.
@Niels,
Figure 22 shows our best result for a 180 degree path at ECON with CI = 52. It occurs at FL380, but its route probability is only 1/3 of the LRC value
Figure 23 shows that tECON with CI = 52 is the best speed mode for initial bearings from 173.0 to 177.5 degrees.
@Brian Anderson,
I also think a left turn after MEFE is more likely than a right turn. That would favor placing a higher priority on searching the eastern half of Search Area A1 before the western half.
Looking at Figure 29, you will see the predicted REFE and LEFE times for 9 Cases. Generally, when there is no fuel balancing and the cross-feed valves are closed, REFE occurs 6:22 before LEFE. So, if LEFE were at 00:17:30, then REFE would be at 00:11:08. For Case 8, when there is a manual fuel rebalancing, after which the cross-feed valves are closed, REFE is only 2:43 before LEFE. In this case REFE would occur at 00:14:47.
I agree that a significant deceleration would occur during the interval between REFE and LEFE, but that intreval is not likely to be longer than 6:22, and it could have been as short as 2:43. I think the cases with the cross-feed valves opened near the end of the flight are quite unlikely, because the air packs being off after 19:41 (which we believe is quite likely), would render that impossible to perform.
@370Location,
After many calculations and much discussion, we have determined that it is highly likely that the value of ZFW entered by the pilot at the gate was 174.4 tonnes. This is in accordance with standard practice. The reported fuel quantities after that appear to be consistent with the accuracy of the sensors.
@DennisW,
See the new Appendix J for a description of the PDF calculation.
@Andrew
@370Location
Fuel density also would be important to know, but as far as I know we have no reported data for it. Unless someone thinks some of the FQIS data such as fuel height has been reported in the ACARS or engine reports. So far nothing on fuel density or other qualities.
@Richard
You said: “Many thanks for the corrections you spotted in the paper.”
Not a problem from this end. I was getting slightly confused concerning some of the referenced Scenario numbers on Page 123. Please see my updated comment concerning Scenario 6A.
Unfortunately my previous query re Scenario 6D referenced on Page has snowballed. In particular this now concerns Scenario 7B1. Compare the text on Page 123 with the content of Table D-4.
@George G
You would not believe, how many times this paper has been proof read, by how many people.
The problem is some corrections have consequences, that are not readily evident elsewhere in the paper.
Please take a look at the latest download.
@TBill
The FQIS calculates volume from multiple sensors (each tank) as well as density (each tank) and temperature (one tank only), but reports fuel weight via ACARS as TOTFW for each tank.
@Richard
It is virtually impossible to get things all correct even after multiple passes. I had a running $50 bet with my staff that when they produced a first draft of a new product manual that I could find 50 mistakes in a day read. I never had to pay up, and I am not counting things like typos. I also liked to go to shipping from time to time, grab a product packaged and “ready” to go, and take it to my office while pretending to be a customer. More often than not I could find something to complain about including a product that was defective in some manner.
@George G,
You said: “Figure 18 is impressive. Pretty good evidence of a good fit.”
I, too, was surprised by how small the GSEs were for the best fit. Initially, I was seeing 3-5 kts with less-than optimum fits and with crudely estimated GDAS weather parameters. It’s hard to know independently what the GDAS accuracy really is when averaged over an hour and about 500 NM. As it turns out, part of the few knots of GSE was due to an initially inadequate GDAS interpolation method, and part was due to imperfect route optimization. Of course, these go together, in the sense that one cannot fully optimize the route until one has an accurate GDAS interpolation method with adequate sampling along the route. Improvements in the GDAS interpolation accuracy and sampling were key in achieving enhanced route optimization.
Richard said:
March 14, 2020 at 12:01 pm
@George G
“You would not believe, how many times this paper has been proof read, by how many people.”
Answer: Yes I probably can
“The problem is some corrections have consequences, that are not readily evident elsewhere in the paper.”
Answer: I’m beginning to think that is and was what lead to part of my initial confusion.
“Please take a look at the latest download.”
Answer: Yes, I have been doing that, and I have been trying to reconcile my confusion and after a (short) sleep and other matters I hope to return to continue and when I have reconciled my confusion concerning “7B1” and “6D”, then I will attempt to be clear in a single comment.
In the meantime, would you please kindly review my updated comment on Scenario 6A, the one with the highest fuel probability with the bleed air ON. It may make sense.
@DennisW
I offered my kids a bottle of champagne for the first one to find our deliberate mistake!
That would have been easy picking ….
@DrB
In fig. G9 the ECON 180 degrees route FL380 seems to have a probability quite close to the LRC route.
In any case: thank you. I failed to get a good fit for FL380. I then spotted a problem in my M(FL, weight) 2D function for ECON. It is a recent implementation which, as mentioned, has not been cross checked yet vs. another tool.
I’ll come back to my 7:37 am posting later.
@DrB
I found the problem in the M(Fl, weight) function and can indeed find a reasonable fit for FL380, ECON_CI52, 180 degrees with a RMS BTOR of 42 microseconds and a 00:11 lat of S33.21. Could you please share the details of your particular path calculation for me to compare/cross check in detail?
@George G
You must be losing patience with me and yet another cut and paste error!
The paragraph now reads “The highest fuel probability with the bleed air on during the SIO Route, allowing pilot survival until MEFE, is Scenario 6A. It has the bleed air off for two hours after diversion, the right engine is off for an hour prior to 19:41, and the cross-feed valves are always closed. The fuel probability of Scenario 6A is only 21%. Therefore, we can say that the probability of having a functioning pilot at MEFE is significantly less (by about 4X) than the probability of having an incapacitated pilot at MEFE.”
@DrB, Richard,
Thank you for directing me to Figure 29.
My aim, in testing the deceleration issue, was to see if including that in the the best fit route parameters [Table G1], resulted in an improvement in the GSE. It does, and to quite a significant degree. Hence it also ought to help in discriminating between routes, and enhancing the probability of the preferred route.
@Richard
😊
@Brian Anderson,
You said: “My aim, in testing the deceleration issue, was to see if including that in the the best fit route parameters [Table G1], resulted in an improvement in the GSE. It does, and to quite a significant degree. Hence it also ought to help in discriminating between routes, and enhancing the probability of the preferred route.”
We do not use the GSE from 00:11 to 00:19 as a figure of merit in fitting SIO routes. Once a route was selected, we thought it might assist in determining which direction the initial turn might have taken. However, there seemed to be too many unknown factors to make a definite selection. It might also allow one to determine whether it was more likely that REFE was at 11:08 or at 14:47. That appears possible only if some turning (or not) scenario is assumed, and this may render all conclusions suspect.
@Authors and All,
One could also suppose that additional fueling details weren’t included in the investigation reports because there was no discrepancy with the ACARS.
Thank you for carefully considering the accuracy of the initial fuel weight.
@370Location
The Malaysian SIR states there was a discrepancy between the estimated take off fuel of 49,100 kg and the ACARS transmitted take off fuel of 49,200 kg (page 51 section 1.6.6).
All the more reason to include a copy of the Fuel Log and Refuel Record in the SIR.
We used the ACARS TOTFW at 17:06:43 UTC as our baseline.
Also I thought check of jet fuel quality was supposed to be one of the first steps after an accident.
Since flight duration is very important, we should have basic jet fuel analysis, which probably exists somewhere. If there is a detailed data download for each flight in the archives, perhaps the prior day MH370 flight, if the FQIS data is downloaded, we could determine approx density for both Beijing and KLIA jet fuels. Also of course there may be lab records.
If the new Malaysia government is going to facilitate search, I believe this is one detail that should be further examined. Not that I expect any earth shattering discovery, but who knows, just crash analysis 101.
@TBill: The heat value of the fuel (per unit mass) should be fairly independent of the density. As Richard says, the FQIS accurately calculates the fuel mass in each tank using both volume and density measurements. The flowmeters also measure mass flow, not volumetric flow. It is extremely unlikely that the diversion occurred due to fuel contamination. What benefit is there to further investigate the fuel quality?
@Victor
I think mainly energy content but boiling range and other parameters could be helpful. The normal reason for immediate checking jet fuel is to make sure the other flights taking off are not getting bad jet fuel, which is rare but nonetheless important to rule out fuel quality as accident cause.
In this case mainly secondary interest as energy content is important. I am not an energy content expert but in years past USA jet fuels were heavier because the refineries tended to max out gasoline. Presumably Malaysia/China jet fuel energy content could be lower, due to paraffinic crude sources etc, but I have no info on typical KLIA jet fuels at all.
In the complete lack of info, I recently estimated jet fuel qualities and did some vaporization calcs based on that.
https://twitter.com/HDTBill/status/1222935727492751365?s=20
@TBill: Again, the heat energy per unit mass is not likely to vary much, even if the density does.
In Appendix J, Bobby Ulich implicitly presumes that the fuel constraint (Figure 5, 2nd panel) is statistically independent of the route model (Figure 5, top panel.) However, given the way that the fuel constraint is constructed, that is simply not true – the fuel probability is derived entirely from those LNAV routes in the top panel that best fit the data. My understanding is that the LNAV routes are constructed by first finding the best fits to the data (BTO, BFO and other constraints), one route per heading, and then the fuel endurance is determined for that route after the fact. If that is not correct, then ignore the rest of this post.
However, if that is the case, then there is an insidious bias built into the fuel constraint. Consider an LNAV route that terminates at 37S. In my model calculations (not necessarily matching anyone elses, but good enough for the present purpose) the best constant mach route that fits the BTO and BFO data is at FL410, mach 0.846, and, at 19:41, passes latitude 0.03 degrees. However, it runs out of fuel at 00:01, sixteen minutes too early. The fuel constraint in Fig 5 likewise rates the probability of this route being viable as less than 10%. However, if one dropped the speed to mach 0.835, the altitude to FL400, and shifted the 19:41 latiude South to -0.358 degrees, the fit to the data is slightly worse (BTO rms increases from 28 to 36 microsec) but still acceptable, and the fuel now lasts 16 minutes longer due to the lower speed. The distance from the crossing of the 1st arc to the 19:41 point is small enough that there is plenty of time for the aircraft to have reached this position with an eary FMT.
What this says is that fuel performance should be an integral part of the figure of merit and not tacked on later. Small degradations in the quality of the BTO fit can be traded for improvements in fuel efficiency. These tradeoffs will not be evident when BTO rms (and the other figures of merit)
are used standalone.
Does this make sense?
@sk999,
You said: “In Appendix J, Bobby Ulich implicitly presumes that the fuel constraint (Figure 5, 2nd panel) is statistically independent of the route model (Figure 5, top panel.) However, given the way that the fuel constraint is constructed, that is simply not true – the fuel probability is derived entirely from those LNAV routes in the top panel that best fit the data. My understanding is that the LNAV routes are constructed by first finding the best fits to the data (BTO, BFO and other constraints), one route per heading, and then the fuel endurance is determined for that route after the fact. If that is not correct, then ignore the rest of this post.”
Perhaps you intended something different than how I am interpreting what you wrote. First, the fuel probability is not “derived entirely from those LNAV routes in the top panel.” The emphasis here is on “entirely”. One cannot determine a fuel probability with only a calculation of “required” fuel at 19:41, which depends on the SIO Route and also on the post-19:41 aircraft configuration. You also need estimates of the “available” fuel at 19:41 for various FMT routes and pre-19:41 aircraft configurations. What we have done is to produce a matrix of 36 combinations of available and required fuel at 19:41. From that matrix we select the maximum fuel probability. Thus, for each LNAV route, we pick the best possible case and option.
It is correct that we have (1) optimized the route probability at each initial bearing, and then (2) assessed its fuel probability. We did not fit the route by maximizing the product of the route and fuel probabilities. In fact, when we found the route probability curve, we had not yet finalized our FMT Route and our method of computing the available fuel. So, we were not concurrently calculating the fuel probability. That was done later.
Maximizing the product of the route and fuel probabilities MIGHT very slightly change the shape of the composite PDF. For LEPs north of 34.3 S, the effect will be negligible. For LEPs south of about 37 S, the effect will be negligible. But what about LEPs between 34.3S and 37S? Consider first the region between 34.3S and 35.5 S. Here both probability curves have similar large slopes, declining rapidly with increasing S latitude. I would not expect this region to be changed noticeably by a different method of optimization. If the two probabilities are anti-correlated, as one might expect, then one rising and one falling is unlikely to change the product significantly. The last region is from 35.5 S to 37 S. Here the route probability is high and slowly declining. The fuel probability here is quite low (< 15%).I would not expect it to be possible for the fuel probability to be increased by a factor 2-3X or more without a large reduction in the route probability. So, here again, I would not expect a different optimization procedure to produce a significantly different composite PDF.
I would also caution against drawing conclusions about the acceptability (i.e., probability) of any route based on a single FOM like RMS BTOR. Other factors must also be considered, especially the correlation coefficients and the GSEs. In addition, any route fit that does not use numerous samples of 4-D interpolated GDAS temperature and wind data along each leg will suffer large errors in predicted ground speed, rendering the fit useless.
One final point is that an assumption of "statistical independence" of the fuel probability from the route probability is not required to derive the same formula for the composite PDF. In fact if one assumes the fuel probability is conditional upon the route being probable, one obtains the same product of probabilities. Or, one could assume the route probability is dependent on there being sufficient fuel (otherwise the route is not flyable). So, whether they are independent, or one is conditional upon the other, the formula is the same product of the two probabilities.
@Dr B, Richard, Victor, Andrew. Having so far got to your Appendix D I attach another contribution on your paper to there. Despite its nature as a critique I join others in congratulating you all on the paper and its clarity.
https://www.dropbox.com/s/t0bedutgz7w4hof/Comments%20on%20the%20BRVA%20paper%2016th%20March%2C%202020.docx?dl=0
Some results from over the weekend:
https://www.dropbox.com/s/pcaajw97ohnp19c/LRCandECON_paths_around_180degrees_v3.pdf?dl=0
A thought: what looks like a peak when scanning parameters one by one, might be a ridge/crest in parameter space. So it could be important to vary parameters in combination (for example bearing in combination with FL).
@DrB, Richard
I do not fully understand how your path generators/fitters operate, but a question regarding the GS based on lat/lon: how do you exactly calculate this, at the WGS84 surface or above?
Every time I compare my distance traveled with yours I have a few km extra over the total 4k km.
@Niels,
The average leg ground speed derived from the lat/lons is simply the distance traveled divided by the elapsed time. I use the full Vincenty method for calculating distance, which is good to about a mm. I also make a modification of the Earth parameters to give, to a very good approximation, the correct distance at the geometric altitude. This last step is necessary to achieve the required accuracy.
Victor, Richard, and I have compared our range calculations. They always agree within a fraction of the length of the aircraft.
The predicted leg-averaged ground speed is found from the Mach, SAT, track, and wind. The Mach is converted to KTAS, and the vector sum of the KTAS in the heading direction and the wind “to” vector gives the ground speed vector in the track direction. This ground speed estimate is then averaged over numerous points along each leg.
The ground speeds calculated by the two methods must agree within about 1 kt for the True Route. This is essential. Ground speed errors (GSEs) > 1 kt indicate a route error.
When fitting an arbitrary route, it is always possible to find handshake locations which satisfy the condition that the GSEs must be smaller than 1 knot. The second test is whether or not the satcom and other statistics are acceptable.
I will repeat to you the same advice I gave to @sk999: “I would also caution against drawing conclusions about the acceptability (i.e., probability) of any route based on a single FOM like RMS BTOR. Other factors must also be considered, especially the correlation coefficients and the GSEs. In addition, any route fit that does not use numerous samples of 4-D interpolated GDAS temperature and wind data along each leg will suffer large errors in predicted ground speed, rendering the fit useless.”
So, in order fopr a route to be “acceptable” as a True Route solution, it must first have GSEs < 1 knot, and secondly it must have multiple (9) statistics which are consistent with the expected values for the True Route within the expected noise levels.
Of course, just as it is always possible to satisfy ONLY the GSE requirement, it is always possible to satisfy ONLY the RMS/STDEV BTOR requirement. In many cases it is also possible to satisfy ONLY the multiple statistics when ignoring the GSEs. However, the TRUE Route must simultaneously satisfy the GSEs and the multiple statistics used in the route probability. We believe the very sharp peak in Figure 19, which is the highest route probability, demonstrates the True Route was at exactly 180 degrees true bearing.
You said: "So it could be important to vary parameters in combination (for example bearing in combination with FL)."
Our Figure 23 proves this is the case. For each bearing, we found the best combination of speed setting and Flight Level.
@DrB
Thanks for explaining. Although the range errors I see are 1 ppt or below I realize it’s too much for doing the extended FOM; it is one of the reasons I’m trying to find the cause.
Regarding the GSE: in the vector addition procedure that I apply (with 3D interpolation applied every 10s time step) it would always be zero following your definition, so that’s good 🙂
@DrB
“Our Figure 23 proves this is the case. For each bearing, we found the best combination of speed setting and Flight Level”
It would be interesting to make a 3D plot for fig. 23, with the route probability on the z-axis. Maybe just for LRC. And then compare to fig. 19.
@DrB et al. I have made some minor amendments to my comments.
@David,
Our responses to your critique of our most recent paper are available HERE .
We appreciate your taking the time to ask questions and make suggestions for improvements.
DrB et al. My thanks for those responses. Altogether not very fruitful for the collective effort entailed.
My comments on what you have said are below, though I seek no further response.
https://www.dropbox.com/s/f54wv1b07p86j73/Response%20to%20BRVA%20comments%20on%20my%20critique%2018th%20March%2C%202020.docx?dl=0
@All, @David
I have made the following changes in the paper available in the download link in the article above:
1. Page 20 clarification as per response document to @David, regarding fuel reduction with air conditioning packs switched off. Many thanks @David for pointing this out.
2. Page 32 and Table E-1 correction of the typo @David kindly pointed out, regarding the time the power was restored to the SDU.
3. Page 119 changed “7 cases in Table D-1” to “9 cases in Table D-1”.
4. Page 119 correction of the typo @David kindly pointed out, regarding Option B2.
@David,
With regard to the lateral offset, the MH370 FL was already offset by at least 500 feet from the traffic in both directions on N571. So, it was not necessary to perform a lateral offset to avoid a collision. The lateral offset would assist in avoiding any visual detection by other N571 air traffic, both before and during the descent.
With regard to reaching the LEP with a functioning pilot, we think that is unlikely, based solely on our fuel model predictions. However, if our fuel model in fact has an error outside our estimated accuracy, then perhaps the LEP could be reached. We allow for this possibility by providing search areas A2 and A3 at a low priority.
@Dr B. With reference to your post above, would it not be useful to specify how much of A1 actually remains to be searched? By my reckoning, it’s about 20% of it (the inner-most strip). Plus any confirmed data-holidays. Or are we saying that we are so utterly convinced of the path that the whole of A1 should be searched again before proceeding to A2 and A3?
With respect to the debris, I recall that there were numerous potential debris signings. But when they were investigated by surface vessels nothing was found. Do you consider this data potentially useful in conjunction with the other indicators?
@Richard. Thank you for the amendments.
@DrB. My thanks for those further explanations.
Your Fig A -3 remains controversial. I attach the previous TM page to illustrate why I persist in my belief that those two graphs do not relate directly. It describes how schedules 1,2 & 3 are set by cabin altitude. Schedule 4 is set by altitude. They separate the two.
https://www.dropbox.com/s/4qsys3lwx0qtsh0/Pack%20airflow%20scheduling.png?dl=0
@paul smithson.
My personal opinion is that the entire A1 should be scanned anew before moving on to A2 and A3. First, cover the data holidays. Second, revisit all areas with suspect data and difficult terrain. Third, if necessary, re-scan the remainder so new data are obtained for the entire A1.
Ocean Infinity’s recent experience with initially missing the ARA San Juan due to a human classification error should have taught us a valuable lesson. That submarine was eventually located very close to its planned course and within the uncertainty of the hydroacoustic location error ellipse.
@DrB
ARA San Juan is a poor example as I have previously pointed out. It came to rest on the seafloor largely intact. The debris from MH370 is highly fragmented with many pieces literally acting like specular reflectors. IMO, the MH370 debris field will be much harder to miss than the San Juan.
If one uses the Metron estimate of detection probability of 90% you derive about a probability of finding the wreckage in A1 of about 13%
@DennisW: IMO, the MH370 debris field will be much harder to miss than the San Juan.
The San Juan was not “missed”. The contact was detected and incorrectly classified.
In addition to the parts of A1 where we have either no or bad data because of terrain avoidance or shadows, we also have other parts of A1 of questionable data quality due to imprecise positioning of the GO Phoenix towfish. That’s why I’ve been a strong advocate of a thorough review of the existing data instead of assigning arbitrary numbers to the detection probability.
@Victor
“missed” and “misclassified” amount to the same thing in my vernacular.
The fact remains that MH370 should have a sizable debris field. Link below to AF447 wreckage.
https://docs.google.com/document/d/13uvE68f2YS6q70jfWdtiwx-NHxLwHChesiyBjWFRGvI/edit?usp=sharing
Oh, THANK YOU, David !
Below is what I had written last night, and I was about to calculate whether or not the higher than 22, 000 feet altitude section of the lower part of Figure A-3 was for a constant volumetric flow, then …. SO, I have.
My writing started out:
DrB, David,
A little over three days ago I told Richard that “I will attempt to be clear in a single comment”.
Unfortunately that single comment has developed into an “Addendum Report” titled “Case ID and Resolution, and Options”.
Mainly it concerns Appendix D and fuel probability. It now looks like I won’t complete it even tonight.
David’s comments discuss some related aspects.
Bleed Air:
David, like you I thought the approach taken by BRVA to calculate the packs-off fuel savings “novel” (your terminology).
But my approach to that was along the lines of: “So what ? It makes allowances for the effect of Bleed-Air On or Off in a manner seemingly suitable for our purposes and provides for a basic comparison”.
David, you say: “Whereas you have applied “Airplane Altitude in Feet” to flow schedules 1-3 I believe the top graph in your Fig A-3 is unrelated to the bottom and those schedules are dependent just on cabin altitude. Schedule 4 alone varies with the aircraft altitude.” I fully agree here with your opinion, yet DrB clearly contradicts this: “Our understanding, after discussion” etc.
Note that Schedules 1, 2 and 3 show a reduction in MASS flow with increase in CABIN altitude. At “first glance” the schedules look to be scheduling constant VOLUMETRIC flow. A simple check of the mass flow ratios between that indicated on Figure A-3 for 8000 feet cabin altitude and that indicated at sea level for Schedule 2 satisfactorily confirms this. Using the pencil and ruler and paper printout method for Schedule 2 the ratio of mass flow at 8000 feet to that at sea level is 75.9%. ( 245 / 323 ) whereas the standard atmosphere pressure ratio is 75.9%. Satisfactory agreement for the purposes intended with the method used.
[Perhaps it might be appropriate to schedule the same volumetric flow within the cabin so the flow velocities within the cabin around the human passengers do not change significantly as cabin altitude varies.]
I do not know just what Schedule 4 is intended to show, but it might even be the Outflow Valve Control Schedule ?
The constant mass flow at aircraft altitudes below 20,000 feet may simply indicate those are altitudes where a sea level, or comfortably near sea level, CABIN altitude may be achievable. THAT is WITHOUT exceeding the 8.6 psid limit. The outside standard pressure at 22,400 feet altitude is nominally 6.1 psia (Thank you Messrs P&W) which is 8.6 psi below standard sea level atmospheric pressure.
In more detail DrB’s comment on Figure A-3 reads: “Our understanding is the cabin altitude and airplane altitude scales are related. The maximum cabin altitude of 8,000 ft provides a pressure differential of 8.6 psi at the aircraft’s certified maximum altitude of 43,100 ft.” The latter sentence is mathematically correct. But how are the upper and lower sections of Figure A-3 related ?
Does the lower chart of Figure A-3 shows an attempt to maintain cabin pressure at sea level, or comfortably near sea level, for approximately the first half of the ascent to cruise, followed by a transition period and then operation close to the 8.6 psid structural limit, or some cabin pressure below but close.
At 22,000 feet altitude the standard atmospheric pressure is 8.5 psi below standard sea level pressure.
At 22,400 feet altitude the standard atmospheric pressure is 8.6 psi below standard sea level pressure.
The aircraft MUST have a lower cabin pressure at higher altitudes.
IF, as DrB’s comment implies, the cabin altitude progressively reduces from sea level through to 8,000 as the aircraft climbs from sea level through to 43,000 feet, then the cabin pressure when the aircraft reaches 22,000 feet altitude will be equivalent to the pressure corresponding to 4,093 feet altitude. This is ….
__________________________________________________
AND Then I was going through the procedure of calculating whether the outflow valves began to choke at around 20,000 feet and whether the schedule was for a progressive increase in pressure differential from approximately 6.4 psid (at 22,000 feet through a maximum of 8.6 psid at 43,100 (say 43,000) feet. (Also at a constant volumetric flow rate.)
[the “approximately 6.4 psid” is the difference between the standard atmospheric pressure of 12.65 psia at 4093 feet and 6.21 psia at 22,000 feet]
My estimate from Figure A-3, using the pencil and paper printout method, of mass flow at 22,000 feet was 173 lb/min and at 43,000 feet was 153 lb/min. The cabin altitude at the latter is 8,000 feet, 10.92 psia. Calculating (173/153)x(10.92) gives 12.35 psia which equates to the standard atmospheric pressure at about 4750 feet.
SO, for the intent of the purpose of the training manual (as represented by Figure A-3), this is not too far off 4,093 feet.
__________________________________________________
@DennisW,
You said: “IMO, the MH370 debris field will be much harder to miss than the San Juan.”
I disagree. The MH370 debris field is likely to have more pieces on the bottom, all of which are smaller than the several chunks of the ARA San Juan hull. This will make it undoubtedly more difficult to detect, because the maximum acoustic signal reflected from each piece will be much smaller. In addition, the height of the MH370 debris from the surrounding terrain is much less, and it will be more difficult to detect the shadows caused by the opaque proud debris. The ability to discriminate (i.e., to classify) MH370 debris from the natural roughness of the terrain will depend on the density and size of the natural features, boulders, etc. That will vary from place to place on the sea bottom. Not all sea bottom is flat and featureless, and where there are natural features about a meter or two in size, the search will require significantly better resolution in order to discriminate targets effectively.
Correction:
Using the pencil and ruler and paper printout method for Schedule 2 the ratio of mass flow at 8000 feet to that at sea level is 75.9%. ( 245 / 323 )
whereas the standard atmosphere pressure ratio is 74.3%.
Satisfactory agreement for the purposes intended with the method used.
74.3% = 10.92 psia (at 8,000 feet) divided by 14.70 psia
@DrB
The ATSB does not appear to share your view.
https://docs.google.com/document/d/1m6-an5v44EzDPomtUrcShYJA0mwkMetuj13cDSvATGM/edit?usp=sharing
@DennisW,
Which view is that? The ATSB graphic simply proves they quit before they finished the task at hand. Why didn’t they get high-quality data for 100% of the search zone? In this endeavor, close is not good enough. In addition, our search area is larger and contains unsearched territory.
The first thing I would have done is to put test targets on the bottom in the search area, but not tell the search crew where they were, just that they are some number of them deployed in the search area. Then you have a controlled experiment with quality checks on the whole process. If the search crew can demonstrate they have covered the whole area with quality data, and if they find ALL the test targets, and if all other detected objects are demonstrated not to be aircraft debris, then you can prove you have conducted an effective search and ruled out the presence of the target of the search, with a high probability.
Calibration targets near port are also useful to avoid a long round trip just to find out you have technical problems. However, that does not test the search effectiveness end to end. Only known targets at unknown locations in the search area can do that.
I am generally a fan of ATSB, but, in the underwater search, they came up empty. To be fair, this was outside their normal realm. I have also spent 20 years finding meter-sized objects in the sea and on the sea bottom for the U.S. Navy and others agencies. You can only clear an area of targets with a rigorously controlled and constantly validated system. We used to drop targets into the sea so we could make a return pass and verify it was automatically detected and properly classified with a CFAR sensor system I designed and built. ATSB could have done the same thing. Proving something is NOT there is actually quite a difficult task.
@DrB
Some 97%+ of the A1 area is classified as “high probability” by the ATSB meaning a greater than 95% detection probability.
I respect the analytics you and your collaborators have done, but I think you are beating on a dead horse relative to convincing anyone to search A1 again.
I also disagree with your earlier comments relative to the debris field, size of wreckage, terrain… You obviously disregarded the sonar scans of AF447. They were literally a blizzard of returns.
@DrB
Said another way, it take takes about 10 minutes of analytics to show that your thousand+ hours of analytics are very very questionable.
Give it up.
@George G. Yes the page I posted at 2:33 notes that schedules 1-3 provide air at constant volume, mass flow therefore reducing with cabin pressure decrease.
Regarding your comment, “I do not know just what Schedule 4 is intended to show, but it might even be the Outflow Valve Control Schedule “, cabin pressure is independent of the airflow delivery, being controlled by the outflow valves. I gather schedule 4 is used in the descent. Maybe that is stated is in the BRVA paper though I cannot locate it.
The paper does note that schedule 3 is used when one engine is providing the bleed air for both packs, at page 78 paragraph 12.
You ask, “But how are the upper and lower sections of Figure A-3 related ?” If they are directly related as per the BRVA Fig A-3 then with both the abscissae being linear and the end point of 8,000 ft cabin altitude being at 43,000 ft aircraft altitude, cabin altitude rises at a constant 1,860 ft per 10,000 ft increase of aircraft altitude, or 0.186:1.
Also, cabin air flow rate, linear with both abscissae, will fall from about 323 lb/min at sea level to 238 at 43,000 ft, that is by a constant 19.76 lb/min per 10,000 ft increase in aircraft altitude.
If on the other hand they are not directly related, then they will need to be elsewhere in a table. There is a trade-off between cabin altitude being low, to provide more comfort, and the cost of doing that. The lower it is held the higher the airflow (from the top graph) so the higher the fuel cost. Though the cabin altitude reaches both its maximum and minimum limit of 8,000 ft at 43,000 ft, beneath that I speculate that airlines might have flexibility, like they do with the cruise cost index.
I do not think that the designers of the outflow valves would envisage choking. At low altitude there will be little pressure differential yet they discharge up to 323 lb/min scheduled flow under schedule 1 minimum and that can rise to 390 at the schedule 1 maximum should the aircraft take more passengers. On top of a discharge approaching that the outflow valves may be designed to cope with another 268 lb/min, that is should the pilots forget to turn on the recirculating fans for some reason, though there pressure relief valves also.
On the pressure ratio of your ‘correction’ being about equal to the mass flow ratio, Boyle with his Law might give a nod to that.
@DrB. About targets, my reservations about those have been that while supposed to replicate the volume of a wrecked engine, some looked to be flat sided steel, ie of sonar reflectivity that might be quite unrepresentative.
These test targets themselves could have been calibrated against a junked wrecked real article. As I have mentioned before, the modified flaperon tested by the CSIRO drifted quite differently from their earlier replica and also the French CFD model.
Then there was the flat hard bottom of the test site.
Did you utilise realistic shapes and materials as targets for calibration in your searches?
@Andrew. The ‘Thrust Derate Switch’ in the climb EHM. I do not suppose it is relevant but in case it is do you know what it is for please? It appears to be all-over-the-place.
https://www.dropbox.com/s/wz4bn3wpe2uja6h/Thrust%20Derate%20Switch%2C%20EHM%20climb%20report.png?dl=0
@David
There is an error in the Malaysian SIR – Appendix 1.6B – EHM Climb Report for the Thrust Derate Switch.
In the ACARS data the Thrust Derate Switch Status Word is only one byte, not two as they incorrectly show in the SIR. They are repeating the last digit of the EPR Actual – Right data in the previous data item, as an analysis of the raw data below shows.
For MH370 the Thrust Derate Switch Status Word ACARS data is HEX “8” for all 3 data entries and for MH371 the Thrust Derate Switch Status Word ACARS data is HEX “C” for all 3 data entries.
Here is a link to the relevant part of the ACARS data for MH371 and MH370:
https://www.dropbox.com/s/3o1nhr4junlsgws/EHM%20Climb%20Reports%20MH371%20and%20MH370%20Data.png?dl=0
Here is a link to the relevant part of the the raw SU Log for MH371 and MH370:
https://www.dropbox.com/s/t503kcniihg2yp8/EHM%20Climb%20Reports%20MH371%20and%20MH370%20Raw.png?dl=0
@David,
Targets intended to test search effectiveness, not just basic sensor function, must be realistic. We used two types. The crude (and cheap) disposable targets were used to test sensor function. We knew where they were, so you look at those at the start of every sortie. The realistic targets generally were inert actual devices. In this case one could use actual pieces of aircraft wreckage – engine cores, main landing gear, etc., or even crushed small automobiles. Sure, it costs money to put these out, but a “blind” experiment is the best means I know of to demonstrate actual search effectiveness.
@DennisW,
You said: “Said another way, it take takes about 10 minutes of analytics to show that your thousand+ hours of analytics are very very questionable.”
No amount of analytics can supply data that were never taken. That includes the data holidays in the previously searched areas and the new unsearched areas we are recommending.
So, the current MH370 coverage is less than 100%. I will also point out that the coverage in the ARA San Juan search was 100%, and yet they still missed it.
In addition, the effectiveness of the ATSB-reported “high confidence” areas cannot be proven with the data at hand. Things could go wrong which are not apparent in the data stream. Actually finding test targets at previously unknown locations is by far the best proof of effectiveness. Analytics can only go so far, and it won’t test everything.
David,
I can assure you the outflow valves will be choked in the second stage of Schedule 4 flow.
At aircraft altitudes above 22,000 feet the ratio of cabin pressure to outside pressure ensures this.
Example: 30,000 feet, 4.37 psia; Estimated Cabin Altitude 5581 feet, 11.97 psia;
Ratio: Cabin Pressure to Outside = 2.74 > 1.89; Outside to Cabin = 0.365 < 0.528
And below 20,000 feet they should not be.
The transition region in between will depend on the actual cabin pressure schedule when passing through/between 20,000 and 22,000 feet.
Andrew, We need your help, or that of some of your colleagues, in reconciling the following:
I interpret the upper chart of Figure A-3 (transposed from the Training Manual, Page 37 of 21-51-00) as being the TOTAL air flow through the air conditioning packs, INCLUDING Recirculated Air.
Subsequent to David's putting up a link to the previous Page 36 (of 21-51-00) I now interpret the lower chart Schedule to be the air THAT THE ENGINE/S supply to the air conditioning system. QUOTE: "The minimum flow to pressurize the airplane and to operate the air cycle machine."
Does this give more information :
1. Four Recirculating Fans make up the difference between Schedule 1 (Min) and Schedule 4;
This is 240-157=83 lb/min at 39,000 feet "read" off the charts
2. Loss of one Recirculating Fan incurs a make-up loss of 83/4=21 lb/min;
3. Fuel Flow penalty for loss of that one fan: 0.3%
4. Using the average value, the FF increases by 1.3% with four inoperative recirculation fans. Quoted from the BRVA Report Paragraph 7 of Section A.11.
Can we interpret that 83 lb/min Engine Bleed Air Flow means 1.3% Fuel Flow at cruise ?
In other words the loss of recirculated air is made-up for by bleeding more off the engine ?
If we can make this assumption, Then I propose that you can allocate normal (Schedule 4) Engine Bleed cost as being 1.3% x 157/83 = 2.5% of Cruise Fuel Flow.
Hence doing away with the cabin air conditioning provides us with an additional 2.5% Fuel Available in comparison to the 1.16% derived in Paragraph 11 of Section A.11. If we interpret the charts as I do.
And to add confusion, Schedule 3 is below Schedule 1 (Min) by an amount of 79 lb/min, which is what what one engine normally provides.
Are you able to find out the information. I have no access to manuals or other relevant information here.
Whilst writing the above I have been more and more "certain" that the upper chart of Figure A-3 refers to Total Air Flow passing through the air conditioning packs, including the recirculating flow.
Hoping you can confirm/deny, or have means to determine, as making my assumption affects a critical factor.
@DennisW
You stated “The ATSB does not appear to share your view.” and point to the ATSB report dated 3rd October 2017 Figure 73.
You also stated “Some 97%+ of the A1 area is classified as “high probability” by the ATSB meaning a greater than 95% detection probability.”
A 10 minute analysis shows, that both your statements are simply not true and misleading.
Overlaying Figure 51 from our paper showing our Recommended Search Area A1 depicted in green, on the ATSB Figure 73 from their report dated 3rd October 2017, shows that only 34.2% was previously covered by the ATSB.
28.4% of our search area A1 area was covered at a high confidence of 97.8% by ATSB (depicted in yellow).
5.8% of our search area A1 area was covered at a high confidence of 91.5% by ATSB (depicted in orange).
65.8% of our search area was not covered at all by the ATSB and the rest to a confidence level of 96.7%.
https://www.dropbox.com/s/3gzjwktmdpjhc2k/Search%20Area%20Coverage.png?dl=0
A zoom in on our recommended search area reveals, that even in the area previously searched by ATSB, there a large number of shadow zones (depicted in blue), a few equipment failures (depicted in magenta) and a few low
probability detection areas (depicted in green).
https://www.dropbox.com/s/gqf7lsquwidm1vw/Search%20Area%20Coverage%20Zoom.png?dl=0
As we point out in our paper in Figure 48, Ocean Infinity covered a further area beyond the ATSB area, but still only between 25 NM and 32 NM from the 7th Arc. We are recommending 37 NM either side of the 7th Arc.
Ocean Infinity did not cover the original ATSB area a second time.
ATSB and Ocean Infinity did not cover all our recommended search area A1.
Our recommended search areas A2 and A3 have also not been covered.
@David
@George G
RE: “Your Fig A -3 remains controversial. I attach the previous TM page to illustrate why I persist in my belief that those two graphs do not relate directly. It describes how schedules 1,2 & 3 are set by cabin altitude. Schedule 4 is set by altitude. They separate the two.”
We do not dispute the mass air flow for schedules 1, 2 & 3 is related to cabin altitude and the mass air flow for schedule 4 is related to aircraft altitude. That much is evident from the charts and the text.
The question is whether the cabin altitude scale is related to the airplane altitude scale. I had a long talk with one of our Boeing technical training instructors about this topic. These guys are specialists and they are very knowledgeable. I was told the two scales are related. The relationship is dictated by the pressurisation schedule, which controls the cabin altitude linearly with airplane altitude, so that the cabin reaches a maximum of 8,000 ft at the aircraft’s maximum certified altitude of 43,100 ft. At that point the cabin also reaches its maximum differential pressure of 8.6 psi.
We have used a methodology to estimate the fuel flow changes based on the best available information. It may not be perfect, but it’s all we can do with the available information.
RE: “I do not know just what Schedule 4 is intended to show, but it might even be the Outflow Valve Control Schedule ?”
Schedule 1 is the usual flow schedule and is the relevant schedule for our purposes. The other schedules provide less air to the packs and are used when necessary to reduce the engine bleed air load, or to make more air available to other systems. For example, schedule 2 is used during take-off (for 10 minutes); and during descent or when there is a single bleed source with two engines operating, AND the APU does not supply air. Schedule 4 is used when a variety of conditions apply, including engine start, the first two minutes of take-off, descent with a single bleed source and wing anti-ice on, amongst others. There is a logic diagram in section 21-51-00, page 39 of the 777 Training Manual if you care to check. As stated in the text: “Flow schedule 4 gives the minimum flow to pressurize the airplane and to operate the air cycle machine.”
@David
RE: “The ‘Thrust Derate Switch’ in the climb EHM. I do not suppose it is relevant but in case it is do you know what it is for please?”
Richard has already explained that the data for the Thrust Derate Switch in Appendix 1.6B of the SIR is incorrect. As for its purpose, I don’t know. The engines have several climb thrust settings that are automatically selected by the FMC, depending on the take-off thrust setting. The climb thrust settings are CLB, CLB 1 or CLB 2, where CLB is the rated climb thrust; CLB 1 is a 10% derate of CLB thrust to 10,000 ft, increasing linearly to CLB thrust at 30,000 ft; and CLB 2 is a 20% derate of CLB thrust to 10,000 ft, increasing linearly to CLB thrust at 30,000 ft. The Thrust Derate Switch might indicate which climb thrust setting was in use.
@Richard. Your point is made that ATSB search “effectiveness” estimates pertain to the stuff that was seached under their watch, not OI. Are you of the view that OI’ search technology is inferior to the preceding searches? If not, the broad conclusion would still stand.
I previously (twice) asked for an estimate of how much of A1 has not been searched. This seems to me to be rather important, unless you advocate disregarding null sub-sea search result altogether for the purpose of predicting aircraft location.
I interpret your comment above to mean that unsearched area comprises a 7NM strip on one side and 5NM strip on the other, total width 12NM, out of A1 total width 54NM. By that rough estimate, about 78% of A1 has already been searched. Is that about right?
@DrB
In reference to your response to @David, why would the bleed air be off for the trip south, whereas I think you are suggesting the strategy is probably other than fuel conservation.
@PaulS
Here is a search area graphic courtesy LabRatSR (Kevin Rupp) on Reddit. This graphic may be slightly outdated as far as 34.4S “hot spot” vs. 34.2S. In the Magenta you see GoPheonix coverage areas, whereas the darker purple represents OI extent of search. As shown, and if I recall, when OI originally searched 34S there was a preference for the searching outside beyond Arc7 rather than inside Arc7. So if the aircraft was uncontrolled and flying circles it could conceivably have gone inside Arc7 into an unsearched portion of A1 zone, in addition to any data gap/obstructed areas.
https://i.imgur.com/hQLaacc.jpg
Thanks, Tbill.
@paul smithson
You asked “ Are you of the view that OI search technology is inferior to the preceding searches?”
I think OI has great technology and as I stated in my recent video to the NOK, the OI technology gets better all the time.
My earlier comment was in answer to @DennisW and I pointed out, that each of our Recommended Search Areas A1, A2 and A3 have not been searched fully by either ATSB or OI.
If you insist, I will calculate the exact percentages for each area.
But, it is already clear, that job is not complete.
@Richard. The point that I am making is that your reasoning (to search A1 regardless) appears to rank the criteria used in filtering your search zone more highly than the null result of the undersea search. I would have placed the latter right at the top of my criteria – meaning that if an area has been searched it should be excluded from the recommended search zone. The only exception being data holidays or any other demonstrable reason to believe that the search “null result” is unreliable. If you counter this by saying … well there’s a 5% chance that it was missed, then my point still stands. Except the null search result should be given 95% weighting rather than 100%.
@paul smithson
I am just following the data.
I disagree that because an area was searched, it should be excluded.
Bobby has tried to make this point twice:
(1) ARA San Juan.
(2) Blind tests in the Search Area.
Please do not presume, what the results of my future analysis (not yet published) might be.
Like everyone else here, I am working on this subject on my own unpaid time, not your demands.
@richard. enough, already.
@paul smithson
Thank you!
@TBill,
You asked: “In reference to your response to @David, why would the bleed air be off for the trip south, whereas I think you are suggesting the strategy is probably other than fuel conservation.”
Possibly the bleed air was turned off a second time to depressurize the aircraft and commit suicide.
@paul smithson
Our Recommended Search Area A1 was searched 34.16% by ATSB and 79.97% by ATSB and OI.
Our Recommended Search Area A2 was searched 4.98% by ATSB and 6.02% by ATSB and OI.
Our Recommended Search Area A3 was searched 6.04% by ATSB and 9.49% by ATSB and OI.
https://www.dropbox.com/s/4qsz0f2ilggx33q/Search%20Area%20Coverage%20ATSB%20and%20OI.png?dl=0
It is the original 34.16% of A1, that concerns me, more than the additional 45.81% of A1 or even the remaining 20.03% of A1.
I believe MH370 was more likely missed in A1 in the original ATSB search.
@Richard. Thanks for the clarification.
@sk999,
You previously said: “What this says is that fuel performance should be an integral part of the figure of merit and not tacked on later. Small degradations in the quality of the BTO fit can be traded for improvements in fuel efficiency. These tradeoffs will not be evident when BTO rms (and the other figures of merit) are used standalone.”
To which I replied: “Maximizing the product of the route and fuel probabilities MIGHT very slightly change the shape of the composite PDF.” and ” I would not expect a different optimization procedure to produce a significantly different composite PDF.”
I have done a comparison of fitting the route by (a) maximizing the route probability and (b) by maximizing the product of the route and fuel probabilities. The results are available HERE .
Figure 1 is the product of the route and fuel probabilities plotted versus 19:41 bearing. It demonstrates that the two fitting methods produce nearly identical results, as I had predicted. The differences are less than a few tenths of a percent.
Figure 2 compares the resulting route probability using the two fitting methods. Again, the differences are quite small – a few tenths of a percent.
Figure 3 is like the first figure but plotted versus S latitude of the LEP instead of bearing. Note the rapid decline in fuel probability as the LEP moves west and south. It is important to appreciate that the LRC speed schedule slows down quite a bit (from M0.84 to less than M0.80) as the aircraft gets lighter, and this cuts the fuel flow late in the flight. However, the fixed-Mach speed schedules at 0.84 and 0.85 don’t slow down as the plane gets lighter, so the fuel flow reduction is less late in the flight. That effect contributes to the rapid increase in the 19:41 fuel shortfall past 36 S.
These figures demonstrate the following:
1. The best overall probability occurs at 180 degrees bearing, ending on the 7th Arc at a LEP of 34.3 degrees S.
2. The fuel is sufficient at 180 degrees, within the estimated 1-sigma model error.
3. Bearings greater than 180 degrees require higher KTAS and therefore higher fuel flows.
4. The fuel probability declines very rapidly at bearings greater than 180 degrees.
5. At bearings of 186 degrees and larger the fuel probability is essentially zero. This corresponds to LEPs south of 37 degrees S.
@Richard. The Thrust Derate Switch data being all over the place.
Thank you for that explanation. I do not know what it does but at least it is not erratic.
@George G. Outflow valve choking. I think we have different interpretations as to what ‘choking’ means. For my part, wide open, flow rate is unresponsive to pressure differential.
With the differential at altitude being high and flow less, the outflow valves need to be open much less. As I look at it while they are restricting flow the valves are not choked.
@George G. My second line should read please.
“For my part, wide open, flow rate is unresponsive to increased pressure differential.”
@David
RE: ” Your Fig A -3 remains controversial. I attach the previous TM page to illustrate why I persist in my belief that those two graphs do not relate directly. It describes how schedules 1,2 & 3 are set by cabin altitude. Schedule 4 is set by altitude. They separate the two.”
It is patently obvious from the charts and the text that mass air flow for schedules 1, 2 & 3 is related to cabin altitude and that mass air flow for schedule 4 is related to airplane altitude. We do not disagree. The question is – how is cabin altitude related to airplane altitude?
I spoke with one of our Boeing technical training instructors about this topic. They are specialists and they are very knowledgeable. I was told the cabin altitude and airplane altitude scales in the chart are related. The relationship is determined by the pressurisation schedule, which controls the cabin altitude linearly with airplane altitude, to ensure the cabin reaches a maximum of 8,000 ft at the aircraft’s maximum certified altitude of 43,100 ft.
The methodology we used to estimate the packs off fuel flow is based on the best available information. It may not be perfect, but it’s all we can do with the available information.
RE: ” The ‘Thrust Derate Switch’ in the climb EHM. I do not suppose it is relevant but in case it is do you know what it is for please? It appears to be all-over-the-place.”
Richard showed that Appendix 1.6B is wrong and that the Thrust Derate Switch did not change during the climb. The FMC automatically selects one of several climb thrust settings (CLB, CLB 1, or CLB 2) depending on the take-off thrust setting. CLB is the full rated climb thrust, while CLB 1 and CLB 2 are de-rated climb thrust settings that begin to wash out when the aircraft climbs above 10,000 ft. The three thrust settings are equal above 30,000 ft. I’m guessing, but I assume the Thrust Derate Switch shows which climb thrust setting was in use.
@George G
RE: ”I do not know just what Schedule 4 is intended to show, but it might even be the Outflow Valve Control Schedule ?”
Flow schedule 1 is the usual flow schedule and is the relevant schedule for our purposes. Schedules 2, 3 & 4 provide less air to the packs for one or more of the following conditions and are not relevant in this case:
· The amount of bleed air available is less than usual.
· More than the usual number of bleed air user systems are on.
· Takeoff or single engine operation.
Schedule 4 provides the least flow to the packs and is in effect when a variety of conditions are met, including engine start, wing anti-ice It provides the minimum flow required to pressurise the aircraft. The logic diagram for the pack flow schedules is on page 39 of section 21-51-00 of the 777 Training Manual.
RE: ”Whilst writing the above I have been more and more ‘certain’ that the upper chart of Figure A-3 refers to Total Air Flow passing through the air conditioning packs, including the recirculating flow.
Hoping you can confirm/deny, or have means to determine, as making my assumption affects a critical factor.”
Cabin air is NOT recirculated through the packs, which are always supplied by ‘fresh’ bleed air taken from the pneumatic system, ie the engines or APU. Recirculated cabin air is fed back into the distribution ducts AFTER the packs.
David,
@George G. My second line should read please.
“For my part, wide open, flow rate is unresponsive to increased pressure differential.”
Choking has a very specific meaning.
Flow goes sonic at the throat.
Flow through the nozzle (valve) is then only dependent on pressure at the inlet, the inlet fluid temperature, and the area.
In the case of a pressurised and temperature controlled aircraft cabin the only variables we are interested in are the pressure and area. Temperature is controlled within a reasonably small range.
Flow through the valve can be controlled by varying the area.
Pressure control is actioned by balancing the flow into the cabin (controlled by another valve, or valves, for the air from the engine compressors) and the outflow control valve/s.
For air the critical ratio of the downstream pressure to the upstream pressure at which the flow in the throat of the nozzle becomes sonic is 0.528.
Or alternatively, more sensibly or easier to comprehend in my view, the critical ratio of the upstream pressure to the downstream pressure above which the system upstream of the throat “couldn’t care less about what is going on downstream” is 1.89, the reciprocal of .528.
@David said: I think we have different interpretations as to what ‘choking’ means. For my part, wide open, flow rate is unresponsive to pressure differential.
More accurately, when the flow is choked, the flowrate is independent of the back pressure. For air, this occurs when the pressure ratio exceeds 1.893. Increasing the upstream pressure will increase the mass flowrate.
With the differential at altitude being high and flow less, the outflow valves need to be open much less. As I look at it while they are restricting flow the valves are not choked.
You cannot look at a valve and determine if the flow is choked. The flowrate would be proportional to the upstream pressure and the flow area. Changing the position of the louvers effectively changes the flow area, and hence the flow rate.
Flow through the valve can be controlled by varying the area.
Pressure control is actioned by balancing the flow into the cabin (controlled by another valve, or valves, for the air from the engine compressors) and the flow out of the cabin by controlling the area of the outflow control valve/s.
Andrew,
Thank you very much for your answer/s to my query re Air Pack Scheduling.
In particular, thank you for detailing the purpose of, or reason for, all 4 schedules, AND also detailing that “Cabin air is NOT recirculated through the packs, which are always supplied by ‘fresh’ bleed air taken from the pneumatic system, ie the engines or APU. Recirculated cabin air is fed back into the distribution ducts AFTER the packs.”
Re: Choked or Sonic Flow
Here is the calculator I use and with 7.5-in orifice diameter to approximate both outflow valves 100% open:
https://www.tlv.com/global/US/calculator/air-flow-rate-through-orifice.html
@Andrew, George G, Victor. I stand corrected, thank you.
@DrB
Could you perhaps share all route probabilities for best fit (bearing&FL) LRC routes used in fig. 23 ? So relating to the orange dots in that figure.
DrB said:
March 19, 2020 at 6:00 pm
“The best overall probability occurs at 180 degrees bearing” and “The fuel is sufficient at 180 degrees, within the estimated 1-sigma model error.”
Your Figures 1,2,3 only served to highlight a matter which has been niggling me for some time (months):
You chose to include the data point for 176 degrees LNAV Bearing, 31.9 degrees South LEP Latitude (intersection with Arc 7).
Refer to Figure 15 of “The Final Resting Place”.
This is “Figure 15 – Combined Overall Probability vs Last Estimated Position Latitude” for the purposes of clarity.
“Figure 5 – Summary of Results” is the same chart for the record for anyone else reading this.
Please note that were the consideration of the “Probability of the Aerial Search Not detecting the Floating Debris Field” removed from the considerations which are used to derive the final “Probability Density Function of Being the Correct Route”,
then the result would be noticeability different.
Part of what has been niggling me is both Richard and yourself are adamant that the 180 degree flight south is the one and only solution, yet I’m not too sure that you have satisfactorily demonstrated discrimination between one candidate flight path south and another. I have no doubt that all your work over the last year or two has made that discrimination, but is it really evident ?.
In Section G.5 of “The Final Resting Place”, when discussing Route Parameter Sensitivity you state:
QUOTE:
We also explored other regions of Interest using constant track and constant heading navigation.
None of these came close to matching the route probability of the LNAV 180° route.
END Quote.
So, please consider the following as a test case.
Concerning your use of the “Probability of the Aerial Search Not Detecting the Floating Debris Field”. I ask did it become necessary to use this to weed out (discriminate) one potential path from another ?
Or are you simply putting the icing on the cake ?
Consider your recent use of the data point for 176 degrees LNAV Bearing, 31.9 degrees South LEP Latitude (intersection with Arc 7).
Were it not for the use of “Probability of the Aerial Search Not Detecting the Floating Debris Field” then your Combined Probability for this data point would be much greater.
The product of the remaining three probabilities would be 0.54. I have not made any attempt to normalise this estimate.
For the “180 Degree Bedax Route (LRC at FL390)” the corresponding number would be 0.79.
The simple difference in these numbers does clearly indicate preference for the route you have determined as THE ONE AND ONLY route over the 176 degree route, but the question still stands: Did it become necessary to use Probability of the Aerial Search Not Detecting the Floating Debris Field to weed out (discriminate) one potential path from another ? Or are you simply putting the icing on the cake ?
With respect to the use of this method it does seem a little contrary that you have been providing argument for consideration that the aircraft wreckage on the sea floor may have been missed during previous searches (which argument I have no argument with) and that basically [in my terms] one can never be certain of where something is if you can’t or haven’t yet detected (found) it.
This approach conflicts somewhat with ruling out an area (on the sea surface) because nothing was seen there.
As part of preparation for the requested test case:
Refer to Figure 73 of the ATSB Report “operational-search-for-mh370_final_3oct2017” for which Richard recently provided a link.
[Comment-27393 March 19, 2020 at 8:52 am]
The 31.9 degrees South Latitude intersection with Arc 7 has some interesting underwater topography (bathymetry if you wish).
Refer to Figure G-8 (and/or Figure 23) of “The Final Resting Place”. The fit of the 176 degree route is certainly not as “nice” a fit as is the fit of the 180 degree route and LRC at FL390, but is it statistically close to the Flight Plan ECON which you have shown (also at FL390) ?.
Refer to Figure G-9, your Speed Setting Sensitivity Study. Here you have tabled (i.e. plotted) Flight Plan ECON at FL380. I’m sure I don’t quite understand why the results differ ?
BUT, perhaps the following sentence answers that.
QUOTE:
To study the speed setting further, we performed additional route fits at 180 ° with the complete
variety of speed settings, allowing the flight level to be optimised for each speed setting. The result
is shown in Figure G-9.
END Quote.
If there were to be conducted Sensitivity Studies done for the 176 Degree ECON FL390 Route what would be the results ?
Or have you already done this which I guess you have ?
If so would they placate Doubting George’s like myself ?
Concerning your “19:41 Initial Bearing Sensitivity Study” you state: “We believe this narrow central peak at exactly 180.00 ° proves this was the MH370 LNAV bearing.” Please note that a large contributor to this being a narrow peak is the use of the Probability of the Aerial Search Not Detecting the Floating Debris Field method.
https://www.dropbox.com/s/sxx5650dapcd79x/Product%20of%20the%20Probabilities%20of%20Route%20Fuel%20Drift%20Models.docx?dl=0
@Niels,
You asked: “Could you perhaps share all route probabilities for best fit (bearing&FL) LRC routes used in fig. 23 ?”
I have made a table, and it is available HERE .
@All,
Bill posted an image of the OI Seabed Constructor track.
Courtesy of SeisIntel, which specializes in tracking seismic surveys and mapping their coverage, here is a .kmz file:
https://www.dropbox.com/s/wh9fb7zkdrtw249/180611-SeisIntel-tracks-Ocean-Infinity-Seabed-Constructor-2018–18AU_01148XX1X.kmz
They also made a tracking demo before the OI survey was complete:
https://portal.seisintel.com/resources/demo/Seabed_Constructor_20180413.mp4
For more details, see: https://370location.org/?s=SeisIntel
The OI coverage swath in the .kmz that I have been using is 150km wide near 34S.
I assume that their technology is more advanced than what ATSB got, with multiple passes over the A1 area.
(Even if it took two tries with ARA San Juan).
I no longer consider my candidates in areas that OI searched as priority sites, even though there is still acoustic evidence to pursue if future searches turn up empty.
The ATSB and GeoScience Australia set up a site to display their scanning data on the web:
https://www.ga.gov.au/about/projects/marine/mh370-data-release
Their interface was hard to reference to my candidates, so to visualize the ATSB seafloor coverage I cobbled together a Google Earth network interface to the online ga.gov.au arcgis datafiles. I shared it with Don about a year ago, but was worried that a public release might overload their servers. I doubt that is a major concern now, but please don’t enable all eleven layers at once:
https://www.dropbox.com/s/rhckh5ec7z5hnvl/190404-Geoscience-Australia-MH370-Survey-Data-Overlays.kmz
What I see for the new IG candidate site is very good coverage, on a relatively flat seabed.
p.s. When talking about the one True Path, I wish that could be qualified as fitted to a straight heading, with the acknowledgement that waypoint or more complex paths could provide good fits.
Also, “following the data” would hopefully include three items of acoustic evidence that were not in the SIR.
@DrB
Thank you, Bobby. I made a plot of both fig. 19 and values from the table you provided (in steps of 0.25 degrees) related to fig. 23 (LRC). They perfectly overlap, probably because the optimal FLs near 180 degrees bearing are very close to FL390. I find the relative high probabilities in the S35.5 – S36.0 range worth a closer look. They are “lost” in the combined probability because of the sharp drop in your “fuel/endurance” probability.
https://www.dropbox.com/s/vtocr1lcprx5mrz/Figs19and23.pdf?dl=0
@George G,
You asked: “Did it become necessary to use Probability of the Aerial Search Not Detecting the Floating Debris Field to weed out (discriminate) one potential path from another ? Or are you simply putting the icing on the cake ?”
Our identification of the True Route does not depend on the aerial search probability, so I would say it was more of the latter (icing on the cake).
You also asked: “Refer to Figure G-8 (and/or Figure 23) of “The Final Resting Place”. The fit of the 176 degree route is certainly not as “nice” a fit as is the fit of the 180 degree route and LRC at FL390, but is it statistically close to the Flight Plan ECON which you have shown (also at FL390) ?”
Figures G-8/23 do not indicate anything at all about the “nicety” of the fit (other than the fact that the best fit at each bearing is a flyable speed setting and altitude). It simply illustrates how the optimum speed setting and altitude vary across the range of possible bearings.
You asked: “Refer to Figure G-9, your Speed Setting Sensitivity Study. Here you have tabled (i.e. plotted) Flight Plan ECON at FL380. I’m sure I don’t quite understand why the results differ ?”
The results don’t “differ”. Figure G-8 shows the optimum speed setting, altitude, average air speed, and average ground speed at each bearing. It shows that at 180 degrees, the best speed setting is LRC and the the best flight level is FL390. Figure G-9 is a separate study, at 180 degrees only. It shows how the route probability varies with speed setting, when the flight level is optimized separately at each speed setting. It also shows that LRC at FL390 is the best speed/altitude combination for 180 degrees initial bearing at 19:41. Figures G-8 and G-9 are consistent with one another.
You also asked: “If there were to be conducted Sensitivity Studies done for the 176 Degree ECON FL390 Route what would be the results ?”
We have not done as many speed combinations at all bearings as we did at 180 degrees in Figure G-9 (which was for illustrative purposes). Clearly, at each bearing there is a value of average KTAS which fits best, and there are usually only a couple of speed settings at high altitude which can provide that true air speed. So, with some practice, it is straightforward to find the best speed/altitude combination by running two or three test cases (i.e., try several speed settings and let the altitude be optimized in each test case). Even when straightforward, it is not quick. Each trial run requires 1-2 hours of work. So, we are talking about 4 or more hours per bearing, with more than 100 bearings. Figure 8 represents a huge amount of time and effort, because the speed and altitude were individually optimized, by trial and error, at each bearing, as they must be to obtain reliable comparisons.
You said: “Concerning your “19:41 Initial Bearing Sensitivity Study” you state: “We believe this narrow central peak at exactly 180.00 ° proves this was the MH370 LNAV bearing.” Please note that a large contributor to this being a narrow peak is the use of the Probability of the Aerial Search Not Detecting the Floating Debris Field method.”
We were referring the the sharp peak in route probability in Figure G7. This has nothing to do with the fuel or aerial search or debris drift probabilities. We believe this unique and extremely sharp peak in route probability is the “fingerprint” of the True Route. It is also apparent that the other probabilities, when considered separately from the route probability, indicate a narrow region at 180 degrees. Thus, the two independent results (route probability and the product of fuel, debris drift, and aerial search probabilities) consistently agree on 180 degrees.
The PDF without considering the route probability is available HERE .
@DrB,
Thank you for your reply.
( Your PDF without considering the route probability clearly shows high dependence on reliance that the aerial search was sure to find signs of debris in the rough seas below. )
I am highly inclined to consider reliance on the route probability combined with the available-fuel to required-fuel comparisons providing limits on reasonable endurance as the main determinants as to where to search in future.
@Richard. In case this has not been brought up before, the Table H-2 3rd “Reporting Date” years look to be based on 2010 rather than 2014.
“….3rd column…” that is.
@370Location said: What I see for the new IG candidate site is very good coverage, on a relatively flat seabed.
That’s simply not true. Please re-read the section from the last article (or Section 8.3 of the report) entitled “Terrain Near the LEP”.
There were definitely holes in the GO Phoenix coverage, some of which were partially covered by Seabed Constructor. Also, the tracks of Seabed Constructor only give a rough notion of the seabed scanned. I’ve relied on the work of Richard Cole to better estimate the path of the AUVs.
@David
The error in Table H-2 has been fixed.
Many thanks for spotting that error.
@all
More blathering as a result of having too much time on my hands “sheltering in place” in commiefornia.
https://docs.google.com/document/d/1S0MAb5aL_mLv-wbSSiaV6saZumqb6_kivMKLJf4lmV0/edit?usp=sharing
@VictorI,
What I meant was that to my untrained eye, it APPEARS from the scans to be well covered.
If you will load up the .kmz I provided, zoom to 34.25S and enable the “sidescan sonar 2014-2015 2k” layer, you will see some holes. Then enable “Fugro Deep Tow Sonar 5m 2k” and “AUV sidescan SONAR 1k”. They went back and covered those gaps.
There remain a few small dropout areas less than 250x750m, which are on smooth seafloor sections. I suspect that someone decided that the time spent revisiting those would not be fruitful.
Visually, the limitation seems to be the mismatched contast of the towed sidescan vs the array that fills the gap below the towfish. I suspect that the computational photography tools used for panoramic stitching could have improved that a lot, without introducing artifacts. But, then again, doctors don’t trust them for enhancing X-Rays.
I must admit that I have no experience with seafloor recovery operations, and defer to true experts.
FYI, in my own research area, I’ve come up with a method of using the CTBTO hydrophone triads to analyze signals below 4 Hz with relatively good bearing discrimination. (Not using wave correlation, but phase differential correlation, similar to instantaneous frequency coherence but without angular unwrapping noise). I believe I am seeing reflections of various events as they traverse the Antarctic coastline, the 90 Degree East ridge, and Broken Ridge. Unlike the proposed Acoustic Gravity Waves proposed by Kadri for finding MH370 at these frequencies, I believe what’s going on is that VLF waves around 1-3 Hz travel farther outside the SOFAR channel, especially in warmer waters. This technique should also work with the restricted data from French OHASISBIO SWAMS triad array near Amsterdam Island, which has wider hydrophone spacing.
@370Location: I am fully aware of the Geoscience Australia data, which I access via their WMS as layers with Google Earth. The steep slopes I reference were covered neither by the GO Phoenix towfish, nor by the AUV excursions. How much of the southern slope was covered by Seabed Constructor and its team of AUVs remains unclear, and cannot be inferred by the path you supplied.
What I have been calling for (both publicly and privately) is an expert review of the existing data in the vicinity of the LEP to assess data gaps and the quality of the existing data, so we are not relying on perceptions from untrained eyes to make decisions.
Authors,
The word “parameter” is used extensively but sometimes inconsistently in the report.
Page 7 introduces “… seven parameters that determine a possible MH370 flight path …” Later there is reference to “route parameters” – presumably these are one and the same?
Page 24 introduces “… flight parameters …” which seem to be the same as the route parameters. On p. 165, there is the phrase “Route Flight Parameters,” which also seem to mean the same thing. However, on p. 81, the term “flight parameter” is used in the disucssion of radar and fuels models, and in this case it seems to refer to the instantaneous state of the aircraft.
Finally, on p. 12, there is the statement that BTOs have random read noise which is uncorrelated with all other “parameters”. Normally, one talks about correlations amongst measurement errors in the data or between those errors and independent variables such as time, not between errors and, say, the route parameters (although one could do so, I suppose). What is intended in this sentence?
I am baffled by Section G.5 – Route Parameter Sensitivity Studies. All of the “best estimate” route parameters are correlated amongst themselves, some quite highly. Yet the only correlation that is discsussed in this section is that between air speed setting and flight level (since it is the combination that determines the ground speed.) Why are other correlations ignored? I have never seen anyone rely on figures such are shown in G-5 to G-7 to study sensitivities when the parameters are correlated. Instead, one normally employs a Fisher information matrix type calculation. If one wants to demonstrate the sensitivity to a particular parameter, that is normally done by “marginalizing” over all of the hidden parameters. You can’t just keep them fixed. Figure G-5 to G-7 give the illusion that the route parameters are tightly constrained, whereas the reality is that they are not, or at least not as tightly as these figures seem to indicate.
@Richard,
I have been considering one of the conflicts in Appendix D between Table D-1 and Tables D-3 and D-4 to be simple text or transposition errors in Tables D-3 and D-4.
For the Pre-19:41 Case 7 Bleed-Air-Off duration, Table D-1 (and Figure 29) and all text mentions within Appendix D have the duration for Case 7 as 1.96 or two hours.
Tables D-3 and D-4 have the Pre-19:41 Bleed-Air-Off duration for Case 7 as 1.1 hours.
I have been considering the use of “1.1” in D-3 and D-4 to be the error. For the Fuel Shortfall of Table D-3 for Scenario 7B1 of only 95 kg (and the probability of 82% in Table D-4) the “1.96 hours” of Table D-1 has to be correct.
I was writing the following:
“Scenario 7B1 differs from Scenario 9B1 only in that the Pre-19:41 Air Packs Off Period is almost 55 minutes (54 mins 50 secs) longer. The tabled difference in Fuel Available is 58 kg. This difference takes the aircraft closer to the estimated time at MEFE by ….” when I guffawed and then wrote:
“… BUT IF HE WAS AT FL385 (or 390) FOR 2 HOURS WITHOUT PRESSURISATION THEN HE WOULD BE NOT IN A GOOD CONDITION BY THE … WHY EVEN ATTEMPT TO CALCULATE ..”
The implication is that if Table D-1 is correct concerning the Bleed Off time Pre-19:41 being 2 hours, then why would the pilot even bother re-starting the air supply for another measly 17 minutes, only to turn it back off again (as proposed by Case 7 and Scenario 7B1) ?
Kate Tee may have seen the aircraft after all.
A hypothesis, as you and your co-authors discuss in your report, is that the pilot shut off the air to the cabin and ascended to (probably) the highest level he could take the aircraft given the aircraft weight at the time. Afterwards, descending to a reasonably low level for a time, say 10,000 feet, makes even more sense if his intent was to proceed until he could send the aircraft on it’s way south. His survival was simply necessary so long as he could negotiate through or past “obstacles”, re-start the engine he had earlier shutdown, for whatever reason, re-balance the fuel in the tanks, and start the aircraft on it’s ascent to a pre-programmed high altitude route. His presence at the top of the climb was not required.
A person planning such a course of action might have quite valid reasons for running simulations before conducting the final flight.
Richard, I suggest you not bother to update the report at this time. I would, however, like someone to produce a set of back-up calculations of the fuel implications of my proposed variation on your FMT Route.
The links should be self-explanatory.
https://www.dropbox.com/s/qgy9wv8v9abne4w/Table%20D-1%20Case%207.pdf?dl=0
https://www.dropbox.com/s/apmp67axny1o8nf/Scenarios.pdf?dl=0
@George
(1) Table D-1 Error and Typo
Thank you for picking up the error in Table D-1 Case 7.
We will change “End of Lateral Offset” to “Cruise at FL385 continues”.
There is another typo, which you did not pick up in Table D-1 Case 6.
We will change “Start of climb o FL385” to “Start of climb to FL385”
(2) Table D-1 Clarification
We will change Table D-1 by adding an option column.
In general 9 Cases/Options are covered in Table D-1 versus 27 Cases/Options in Table D-3 and D-4.
There are no general “transposition errors” between Table D-1 and Table D-3 and Table D-4.
(3) Table D-3 Typo
We will change the typo in the pre-19:41 case 7 bleed air off from “1.1” to “2.0” in Table D-3.
(4) Option B2
An active pilot is needed to function for the 17 minutes to balance the tanks in all options B2.
(5) Case/Option 7B1 vs 9B1
You point out that the difference between 7B1 and 9B1 is 58 kg of fuel. The difference between the two scenarios is that 7B1 has the bleed air off pre-19:41 for 1.96 hours, whereas 9B1 has the bleed air off pre-19:41 for 1.06 hours.
You ask why bother to even calculate case 9B1.
In our view 7B1 and 9B1 are reasonable scenarios to run, as they are the closest to zero fuel shortfall.
We will change D.4.6 from “In Scenario 7B1 the pre-19:41 bleed air off time is consistent with the cabin being depressurised from turn-back to the end of the traverse at 19:24.” to “In Scenario 7B1 the pre-19:41 bleed air off time is consistent with the cabin being depressurised from turn-back to circa 19:24.”
(6) What-If Case/Option 10B3
You suggest a variant 10B3. This differs from Case 8 by having the bleed air off after 17:26 for the whole flight. You have not considered engine restart and fuel balancing requires an active pilot.
We are not a “what if” scenario service provider to the MH370 community.
If a new scenario or variant make sense and we wish to check it out, then we will.
@Richard
Thank you.
10B3 : Point taken, thank you.
You say: “You ask why bother to even calculate case 9B1.”
Sorry, that came across wrong. I was asking myself why calculate the expiration time of 7B1 compared to 9B1 if for 7B1 the pilot or person in the pilot’s seat was expected to last for two hours. Seemed unlikely.
The green box in Figure 51 defines search area A1; this area extends for about 1 degree of latitude, -33.75 to -34.75, when measured along the 7th arc. The box is based on the premise that the LEP is a single point rather than a range of latitudes. However, the bottom panel of Fig 5 shows that there is, indeed, a range in possible latitudes for the LEP. Suppose I convolve that distribution with a boxcar in latitude of width 1 degree, then compute what fraction of the probability is inside the green box. It is only 48%. If I use the probability distribution function that excludes the aerial search results, the fraction of probability in the green box drdops to 35%. The search will need to be extended considerably outward in latitude from the green box in order to achieve coverage of 90% or more.
@sk999,
A “parameter” is defined as a constant, a variable, or a statistic, depending on the context in which it is used. Within its definition, it is not used inconsistently in our paper.
In general, there are seven flight parameters which determine the aircraft trajectory in four dimensions. More particularly, the trajectory during a particular “route” is determined by the “route flight parameters”. This is not a complicated concept.
In addition, it is obvious that instantaneous values of the flight parameters define the “instantaneous state of the aircraft”. There is nothing inconsistent about doing this, either.
The meaning of the statement that the BTO read noise is independent of all parameters besides itself (i.e., all “other” parameters) is obvious. This means the correlation coefficients with all other parameters will have an expected value of zero. This includes the satellite data, the weather data, and the route parameters. This property of the BTO read noise allows one to add multiple statistics to figuring the route probability. Without doing this, unique features like that shown in Figure 19 would be undetectable.
You said: “I am baffled by Section G.5 – Route Parameter Sensitivity Studies. All of the “best estimate” route parameters are correlated amongst themselves, some quite highly. Yet the only correlation that is discsussed in this section is that between air speed setting and flight level (since it is the combination that determines the ground speed.) Why are other correlations ignored?”
There is nothing baffling about it. They are only “correlated” by the (one) data set being fitted. The route parameters are all independent variables which may be set individually by the pilot. The only thing that will “correlate” them is a route fit to a particular set of satellite data, and that correlation will vary from route to route and from data set to data set. The concept of sensitivity studies by adjusting one variable at a time is not a new concept. It is quite useful, whether or not the variables are “correlated” by the data set being fitted. The degree of “independence” of each variable is graphically displayed by the sensitivity studies, wherein one variable is allowed to change while all others are fixed. This is plainly stated, and it should not mislead anyone. Within small ranges, they are essentially independent, but over larger ranges they may not be. These graphs immediately identify which variables are the most critical in optimizing the fit to the data, and what ranges of values can provide an acceptable fit. Correlations among the flight parameters for the MH370 data set were not pursued beyond what we did because they are not predictable and therefore add nothing to finding the best-fit route for the one data set we have. Some of the best-fit route parameters vary systematically with bearing because of the geometry of the problem, and it makes sense in this case to methodically step through the full range of bearings one trial at a time. This assures optimized route fits and illustrates the variations of air speed and fuel for LEPs along the seventh arc. At a fixed bearing, the only remaining significant trade-off among the other fitted route parameters is the one between altitude and flight level, and we devoted a huge amount of time (and two figures in the paper) to understanding this dependence and, in fact, finding the optimum combinations.
You are welcome to try any technique you want, but we don’t see any benefit to doing more complex information studies when we only have one data set. We don’t think there is additional useful information to be had, and therefore what we did is sufficient for the problem at hand.
@George G,
The myriad variations of aircraft configuration we used in the tables in Appendix D were intended to explore the a wide range of fuel options. You have suggested a new “descent” case with right engine shutdown, wherein the bleed air was off from 17:26 onward, and was never turned back on. It is very similar to 8B2, the only exception being the bleed air being off from 18:29 to 19:41. That would save another 80 kg or so in fuel. Based on inputs from our pilot co-author, we think the fuel re-balancing would not begin until the right engine was re-started at the end of the traverse circa 19:24 and just before the climb began. We figured that from 19:24 to roughly 19:41 the left engine would be drawing fuel from the right tank. Near the top of the climb, the tanks would be balanced, and the cross-feed valves would be closed. A difficulty arises during the climb from 19:24 to circa 19:41, if the bleed air were off. We can see that perhaps at FL100 the bleed air could be off but the pilot could breathe more or less normally anyway because of the low altitude. During the climb from FL100 to FL390 the cabin pressure would drop quickly, and the breathing would become labored again, even with the positive pressure oxygen mask. Perhaps that was endured, but it could have been avoided by simply closing the outflow valves and turning the bleed air back on, at least until the level cruise was established at FL390. Your scenario is possible, but we really don’t know what happened.
@SK999
My take on the probability of the wreckage being in A1.
https://docs.google.com/document/d/1S0MAb5aL_mLv-wbSSiaV6saZumqb6_kivMKLJf4lmV0/edit?usp=sharing
@Dennis. And that number doesn’t take into account that the unsearched portion of A1 (the strip most distant from the arc) is also the least likely.
@Paul
I did not weight the probabilty by distance from the arc. I debated it, but did not feel comfortable with a model for that. I do agree that closer to the arc is more likely.
Bobby Ulich,
Parameters are correlated when computing contours of constant chi square (or whatever your figure of merit) in the multi-dimensional parameter space. The correlations are expressed (at least in a linear approximation) by the covariance matrix, which is the inverse of the Fisher matrix (if I have my terminology straight). The square roots of the diagonal elements are the 1-sigma uncertainties in the parameter estimates, properly marginalized. The correlations are not dependent upon the actual measurements, only their statistical errors.
Figure G-5 implies that the start longitude has an uncertainty of about 0.08 degrees 1-sigma; the actual uncertainty is about 0.4 degrees 1-sigma. Figure G-6 implies that the start latitude is known with an accuracy of about 0.1 degrees 1-sigma. The actual value is about 1.2 degrees 1-sigma. Figure G-7, initial bearing, does not have enough dynamic range to estimate the initial bearing uncertainty (although you state that the peak is less than 0.1 degrees wide) but I find that the uncertainty is 2.2 degrees 1-sigma. Of course, none of this really matters. All that matters is the uncertainty in the final latitude along the 7th arc. I find an uncertainty in this latitude of 1.2 degrees 1-sigma. To check this, I ran 1000 simulations where I assumed that the true route was the one derived in the report and generated 1000 sets of random errors to be added to the true BTO and BFO values, then solved for the maximum likelihood route (LNAV mode only). The scatter in the final latitude was 1.1 degrees 1-sigma.
For the record, my maximum likelihood LNAV route using the actual data is essentially the same as the route given in the report, passing very close to BEDAX.
@sk999
“.. then solved for the maximum likelihood route (LNAV mode only)”
Is that with a certain speed setting constraint / only LRC?
@DrB
Thank you.
As I understand it the pilot or person in the pilot’s seat did not to have survive to the top of the climb in a functioning condition.
All that was required was to restart the engine so the climb could be initiated and then re-balance the fuel tanking.
It was also necessary to ensure the Autopilot was be set to climb to FL390 on a pre-determined (simple 180) course.
Your pilot co-author may wish to confirm/deny this.
@sk999. If they were giving out prizes for the most erudite contribution to this blog, then I think yours takes the biscuit. For the rest of us mere mortals (to borrow a phrase from Mick Gilbert) its a bit like a dog watching TV. Chapeaux.
… also necessary to ensure the Autopilot was set to climb to FL390 …
Niels,
I have been using constant Mach, not LRC. For the particular LNAV routes in question, the differences are small, although I am not prepared to say that they are negligible.
@sk999
I have now done both and can say the difference is (as we say) “in the noise”.
I have now updated the paper in the download link in the article above:
1. New Section 8.8 Search Area Coverage.
2. Revised Appendix D with corrected Table D-1, D-3 and D-4.
3. Typo in Appendix F.3 “19:01:03” changed to “19:41:03″.
4. New Appendix G.10 Alternative Objective Function for Route Fitting.
5. New Appendix J.1 Alternative Composite Probability Density Function.
@sk999
You stated “I have been using constant Mach, not LRC. For the particular LNAV routes in question, the differences are small, although I am not prepared to say that they are negligible.”
@Sid Bennett
You stated “I have now done both and can say the difference is (as we say) “in the noise””.
Sid, it is important to appreciate that the LRC speed schedule (used at 180 ° bearing) slows down considerably (from M0.84 to less than M0.80) as the aircraft gets lighter due to fuel consumption, and this reduces the fuel flow late in the flight. However, the fixed-Mach speed schedules at 0.84 and 0.85 don’t slow down as the aircraft gets lighter, so in these cases the fuel flow reduction is less late in the flight.
This effect contributes to the rapid increase in the 19:41 fuel shortfall past 36 °S, because the larger ranges to those locations on the 7th Arc require higher air speeds than LRC. These higher speeds require more fuel, especially so nearing fuel exhaustion.
@Sid Bennett,
The difference in Mach between LRC and M0.84 depends on both weight and Flight Level.
For example, at FL390, the difference is quite small. At 220 tonnes, LRC is M0.840 and at 180 tonnes it is M0.839. So, at FL390 the difference between LRC and M0.84 is small in both air speed and in fuel flow.
At FL350, the story is quite different. Here at 220 tonnes, LRC is M0.840, but at 180 tonnes it is only M0.796. So, at FL350 there is a significant difference in air speed and fuel flow between LRC and M0.84 late in the flight as the weight drops below 210 tonnes.
The 186-degree LNAV route is best fit at FL360 and M0.84. At FL360 the LRC Mach drops from M0.841 at 220 tonnes to M0.810 at 180 tonnes. Therefore, there is a significant difference in air speed and fuel flow between LRC and M0.84 for bearings > 180 degrees when the optimum altitude drops below FL390 down to circa FL350-360.
At 180 degrees, the difference between LRC and M0.84 is small in KTAS and in required fuel. This is demonstrated by our Figure 22, which shows that M0.84 is not far below LRC in route probability.
Richard is correct when he points out the fuel required increases for LEPs past 36 degrees S, because those routes must be flown below FL390, where LRC drops below M0.84 when the weight falls below 200 tonnes. This occurs several minutes after 19:41, so virtually all of the SIO Route is affected.
@sk999,
You said: “For the record, my maximum likelihood LNAV route using the actual data is essentially the same as the route given in the report, passing very close to BEDAX.”
It is good to hear your best route agrees with ours. What is your FOM for determining “maximum likelihood”? Are you using our route probability or something else? If something else, does it include fuel or debris drift or aerial search contributions?
@DrB
Why do you say those (further westerly) routes have to be flown below FL390? just curious.
@sk999,
Does your “maximum” likelihood FOM take into account 4-D interpolated GDAS weather along the route, and have you applied any conditions on the GSEs?
@Authors
I’m still struggling with the GSE concept. For the model ground speed it is mentioned in fig. 35:
“ = Magnitude of vector sum of model TAS (in heading direction) + GDAS wind vector in “To” direction”
What is exactly the “To” direction here?
@Niels: Meteorologists (and aviators) refer to wind direction by where the wind is coming from. We analysts tend to think in terms of the wind vector, i.e., where the wind is blowing towards. To avoid confusion, we sometimes specify whether we are talking about the “from” (meteorological/aviation) direction or the “to” (vector) direction. They are 180 degrees apart.
@DrB
you said:
“Richard is correct when he points out the fuel required increases for LEPs past 36 degrees S, because those routes must be flown below FL390, where LRC drops below M0.84 when the weight falls below 200 tonnes. This occurs several minutes after 19:41, so virtually all of the SIO Route is affected.”
you also said :
“For example, at FL390, the difference is quite small. At 220 tonnes, LRC is M0.840 and at 180 tonnes it is M0.839. So, at FL390 the difference between LRC and M0.84 is small in both air speed and in fuel flow.”
In comparing paths at about FL390, the difference between the two is no difference M.001). Further, I have seen no cogent argument against using FL390 and LRC or CM on the entire route after the FMT.
@TBill,
You asked: “Why do you say those (further westerly) routes have to be flown below FL390? just curious.”
The more westerly the route, the longer is the range.
The longer the ranger, the higher is the KTAS with fixed handshake times.
The higher the KTAS, the higher is the Mach for a given Flight Level.
When the higher Mach is less fuel efficient, then the higher KTAS can be achieved at the same Mach by flying at a lower altitude, where the air is warmer and the Local Sound Speed is higher.
It turns out that once you get past 180 degrees bearing, it requires less fuel to descend several thousand feet to gain the extra KTAS than to stay circa FL390 and fly at a higher Mach.
Routes even further to the west require M0.85, and at decreasing altitudes.
This is illustrated in Figure 23, which displays the optimum combinations of Mach and Flight Level.
Bobby Ulich,
My best fit route does a full nonlinear least squares fit to the BTOR rms, the BFOR rms, and (new to the party), the fuel exhaustion time. My fuel model for this round of fits uses approximations that I made incorportating Boeing’s performance data from the SIR, appendix 1.6E. I note that the fuel burn from these approximations are not entirely consistent with the previous tables that you unearthed up, so caveat emptor.
The adjustable parameters are the start longitude, latitude, Mach, flight level, initial heading, BFO offset, and three wind speed offsets for the last 3 legs. (I assume that the offset for the first leg is accounted for in the initial Mach setting.) These last 3 are, I believe, entirely equivalent to your GSEs.
I have LRC fits that are just as nice as the the constant Mach fits but they run out of fuel too early. However, these were run before I included the fuel exhaustion time constraint, and I haven’t tried rerunning them with the constraint.
My 00:11 position (without any accounting for early right engine fuel exhaustion) for the maximum likelihood route is latitude 33.15S, 93.98E. That is about 16 nm NE of your Figure 16 position. Pressure altitude is FL402. Mach 0.8344. BTOR rms is 36 microsec (you have 34). BFOR rms (after accounting for the BFO bias offset) is 1.7 hz. I think this should be compared to your stdev, which is 2.0 (and I don’t account for n v. n-1). Heading at 19:41 is 179.6 deg. Fuel exhaustion is 0:17:00. The wind speed offsets are all less than 1 knot.
And yes, I do full 4-d interpolation in the GDAS tables (linear only).
@VictorI
Regarding groundspeed calculation
Thank you for clarifying. I’m doing the “reverse” vector calculation as I have a GS available (and bearing), and use this together with wind data to calculate TAS. If this TAS deviates from the targeted TAS, feedback control modifies GS. Initially I had this control loop implemented to follow the BFO curve.
I’m currently comparing my results in detail with your fig. 35. It appears largest deviations develop going from TAS to GS. Possibly through the read-out of wind data (interpolation method?). I have moved to 4D (linear) interpolation, though interpolation for latitude seems less essential for the mainly southerly tracks.
@Sid Bennett,
You said: “In comparing paths at about FL390, the difference between the two is no difference M.001). Further, I have seen no cogent argument against using FL390 and LRC or CM on the entire route after the FMT.”
Our Figure 22 shows the SIO route probability is higher for LRC than M0.84, by about 8%. The fuel required is virtually identical. So, there’s not a large difference after 19:41, but the route probability does favor LRC after 19:10 (as we have predicted for the FMT). There is evidence that the altitude was low circa 18:54, which conflicts with a FMT happening before then.
@sk999,
I have some questions related to your calculations of fuel exhaustion time (MEFE).
1. Are you assuming the bleed air is on or off after 19:41?
2. What FFFs are you assuming for L and R engines?
3. What fuel tank difference are you assuming at 19:41?
4. Are you correcting for single-engine INOP FF for some minutes before MEFE?
5. Are you assuming the fuel cross-feed valves are closed or opened near MEFE?
Other questions are:
6. Why are you using RMS BFOR as a fitting FOM instead of the 1-hour BFOR differences?
7. Are you assuming the Mach is unchanged throughout the whole SIO Route (for non-LRC routes)? If not, how do you allow it to change?
I would also remark that you cannot fly a B777 at M0.8344. The only available speed modes I am aware of being used generally are ECON, MRC, LRC, and fixed Machs in 0.01 increments. So, it would be better to only allow flyable Machs in your fits. The Mach speed setting is not arbitrarily adjustable.
Bobby Ulich,
I am considering none of the effects you mentioned w.r.t fuel consumption. I am only taking the numbers straight out of Appendix 1.6E (which claim to account for the PDA of this particular aircraft) and applying TAT corrections only.
Take differences of 1-hour BTORs? If I understand you correctly, then the differences would have correlated errors that need to be removed, and in doing so you would end up back with the original BTORs by themselves.
Mach is constant. The quantization of Mach is worth noting – thanks. At the high Mach end of the performance charts, small changes (even 0.01) have a significant impact on fuel consumption. Flight level is another troublesome parameter – the least squares fitter will merrily send the plane to unachievable altitudes. All of the adjustable parameter have both priors and constraints, so that is how some degree of control is achieved, but it is partly art and far from perfect.
@sk999, @DrB: The Mach resolution of the MCP speed is 0.001, not 0.01.
Victor,
Thanks. The Qatar FCOM says:
The display range is:
• 100 – 399 KIAS
• .400 – .950 Mach.
So the implication is 3-digits for either mode of speed indication – thus a resolution of 1 knot for indicated air speed or .001 for Mach.
I do not own a 777-200ER, so can’t immediately check and verify.
Victor,
Apologies if the last line of my previous post appeared out of line. Not intended to be so.
@victor
Is this discussion really going anywhere?
The fact remains that the probabuity of the wreckage being in A1 is around 0.3. Do you really expect OI (or anyone else) to search at that probilitity level?
@sk999
@DrB
@Victor
RE: “So the implication is 3-digits for either mode of speed indication – thus a resolution of 1 knot for indicated air speed or .001 for Mach.”
It is possible to select speeds in increments of 1 knot or M0.001, via the MCP or the FMC. However, pilots normally select Mach speeds in increments of M0.01, eg M0.82, M0.83, M0.84, etc.
@DennisW
You asked “Do you really expect OI (or anyone else) to search at that probability level?”
Yes!
OI, ATSB, the NOK and the former Malaysian Government have told us that they are taking our latest paper seriously.
We shared our paper with OI in advance of publishing, at their request. OI are wanting to search again, including our recommended search area A1. OI are willing to review the previous search data from A1. OI have appointed a project manager, who is collaborating with us.
The former Malaysian Minister of Transport promises to visit his successor, following the change of Government in Malaysia and push the case to resume the search and point out the findings from our latest paper. Anthony Loke (former Malaysian Minister of Transport) was present at the 6th remembrance event organised by the NOK and watched the video presenting our findings, which was prepared at the request of the NOK.
When you ask “Is this discussion really going anywhere?”
My answer is, that there are a lot of analysts from the MH370 community, contributing to this blog, who are taking the discussion seriously, running their own models, asking pertinent questions, contributing their relevant expertise and clarifications and all supporting the goal of helping to solve the world’s greatest aviation mystery. Please continue to contribute to the discussion.
@DennisW said: The fact remains that the probabuity of the wreckage being in A1 is around 0.3.
The data in the vicinity of the LEP should to be reviewed. We need input from experts to determine if the data holes and the quality of the data merit another search in that vicinity.
@DrB
“There is evidence that the altitude was low circa 18:54, which conflicts with a FMT happening before then.”
OK I’ll bite. What is the evidence?
Kate Tee might have seen the Singapore AWACS/radar aircraft. Also she saw an aircraft smoking for some reason. PS- Thank you for FL390 explanation.
@George G
RE: “As I understand it the pilot or person in the pilot’s seat did not to have survive to the top of the climb in a functioning condition. All that was required was to restart the engine so the climb could be initiated and then re-balance the fuel tanking. It was also necessary to ensure the Autopilot was be set to climb to FL390 on a pre-determined (simple 180) course.”
Having initiated the climb, the pilot could certainly set the autopilot to climb to FL390 on a pre-determined course; however, fuel balancing requires a conscious pilot to start the process and to stop it once the tanks are balanced.
Fuel balancing is achieved by first opening a cross-feed valve and then switching off the boost pumps in the tank with the lower fuel quantity. Fuel from the opposite wing tank is then used by the operating engine(s). Fuel is not transferred between the tanks and the time it takes to balance the tanks is entirely dependent on the fuel flow of the operating engine(s). When the fuel tanks are balanced, the process is stopped by selecting the boost pumps on and then closing the cross-feed valve.
In scenario 8B2, we assumed the pilot commenced fuel balancing when the aircraft commenced its climb. Given the two-engine fuel flow during the climb, the fuel imbalance would have been corrected at about the time the aircraft reached FL390. The pilot would need to be conscious at that time to reconfigure the fuel system and stop the fuel balancing.
@DrB
” There is evidence that the altitude was low circa 18:54, which conflicts with a FMT happening before then.”
What is said evidence of low altitude?
In defense of @sk999 (who needs no defense) only if our temperature models of the atmosphere are exactly correct is an 0.84 Mach model really 0.84 Mach.
Thank you for the above FL390 explanation of fuel consumption.
@TBill,
You said: “only if our temperature models of the atmosphere are exactly correct is an 0.84 Mach model really 0.84 Mach.”
The GDAS temperatures appear to be accurate to better than 0.5 C, based on comparisons with radiosonde data and our flight model fits. That temperature error corresponds to 0.001 Mach. So, M0.84 should appear to be between M0.839 and M0.841 due to temperature error alone. M0.8344 is 4 times farther away from M0.83 than can be explained by temperature error.
The Kate Tee sighting is evidence of MH370 being at a low altitude circa 18:54. You can decide for yourself how credible it is. I am convinced she saw an aircraft at an unusually low altitude, and this could have been MH370. As far as I know, reports of other planes being at that location at that time are just rumors and suppositions, unaccompanied by data.
@sk999,
You said: “Take differences of 1-hour BTORs? If I understand you correctly, then the differences would have correlated errors that need to be removed, and in doing so you would end up back with the original BTORs by themselves.”
You may have mis-read my comment. I referred to BFORs, not BTORs. Yes, the BFORs are indeed correlated, as a result of OCXO drift. That correlation is mostly removed by taking the 1-hour differences. So, one can use a random number generator to create sets of (uncorrelated) 1-hour BFOR deviations (not to create sets of uncorrelated BFORs, which don’t mimic the real case).
There are two ways in which inserting random BTORs and random BFOR differences can be helpful in understanding the precision of route fitting.
The first thing one can do (and which we both have already done) is to find the best-fitting set of route parameters using the actual BTO/BFO data. Our 7th Arc locations are quite close. That best fit gives you a value for the Figure of Merit (FOM) which is optimized using an Optimization Function (OF). In my case, the FOM is the route probability (or the product of the route and the fuel probabilities). My OF, which is to be minimized, is simply OF = 1 – FOM. So, minimizing the OF maximizes the FOM.
Your OF is some (weighted?) combination of RMS BTORs, BFORs, and a MEFE time error. I will note that minimizing these parameters is, in general, not optimum. One should instead try to make them match their expected error statistics (mean, standard deviation, etc.). It would be helpful in understanding your results to show the exact equation you use for the OF.
The next logical step is to hold the route parameters fixed, and vary the BTORs and delta BFORS using random values with the appropriate statistics. Then one observes the variation in the FOM. In my case, it should have a mean of 50% and a standard deviation of 29% (when using just the route probability for the FOM). It does match that. This result confirms that my probability calculations behave as expected. However, it does not, by itself, tell me anything about the precision or accuracy of the route parameters. That can be done in a next step by observing the route parameter sensitivity curves. How fast the FOM falls off away from the peak value tells me how sensitive the route fit is to that parameter. This sensitivity is related to the precision and the accuracy of the route fit. That relationship depends on the FOM being used.
My FOM involves 9 or 10 statistics, whereas yours uses only 3. Therefore, comparing the sensitivity results must be done with caution, because comparing sensitivities based on different FOMs is comparing apples to oranges. In general, the sensitivity of a given route parameter to the FOM will depend on the FOM. Using more statistics in the FOM leads to better discrimination of the route parameters (and therefore better rejection of non-True Routes). That is, an expanded FOM becomes more sensitive to each route parameter. We see that occurring when comparing your “sensitivities” to mine. I am not surprised my FOM leads to greater sensitivity, and therefore smaller allowable ranges, for each of the route parameters. That is to be expected as a direct result of my using more statistics in the FOM.
The second thing one can do is to actually fit the route parameters to each set of random BTORs and delta BFORs. You have already done this. I have not, because of the slowness of my route fitting method. In this case, we are primarily interested in just one parameter based on the route fit – the 7th Arc latitude. The sensitivities of the other route parameters are interesting to know, but they don’t directly affect a search area recommendation. Your result for the variation of the LEP latitude seems reasonable for the FOM you are using, but I would expect the more complex FOM I am using to have a smaller variation in the LEP latitude. The point is that you can’t legitimately apply individual route parameter sensitivities based on one FOM to the fits based on a different FOM, other than to say the your 3-parameter FOM sensitivities will represent an upper limit on my 10-parameter FOM sensitivities.
@Richard
You said in response to my search expectation query:
“Yes!
OI, ATSB, the NOK and the former Malaysian Government have told us that they are taking our latest paper seriously.”
I too take it seriously, very seriously. Does that mean that I would make a funding decision involving several million USD based on the paper? That is the question I am asking this group and myself. At this moment I do not have an answer.
@DennisW said: Does that mean that I would make a funding decision involving several million USD based on the paper? That is the question I am asking this group and myself. At this moment I do not have an answer.
There is no answer at this point.
We have provided a new methodology to discriminate paths that incorporates a very accurate route reconstruction model along with statistical metrics related to the randomness of the implied measurement errors associated with each reconstructed path. This has led to a fairly small recommended search area. We’ve also provided extensive documentation of all methods and assumptions so that the report can be peer-reviewed.
We’ve also called for a review of all existing and missing seabed data in the vicinity of the LEP.
Most of us believe it is unlikely that Malaysia will read the report and independently call for a new search. There is a higher probability that OI will approach Malaysia, along with the NOK, and negotiate the conditions for a new search. So the possibility of a new search at this point really rests with OI’s assessment of risk and reward.
I expect that within the coming months, OI will be gathering more inputs, and will have a better estimate of whether it’s possible the debris field is in A1 (or A2). Until then, we just have to wait. Any pronouncements of what OI will or will not do is premature.
@Victor
Thx. That is my take on it as well.
@Andrew
Thank you.
You said: “Given the two-engine fuel flow during the climb, the fuel imbalance would have been corrected at about the time the aircraft reached FL390.”
This, the time to balance taking about the same as the climb, explains why in the report you considered that the pilot may have chosen to restore the aircraft pressurisation to normal during the climb.
You said: The pilot would need to be conscious at that time to reconfigure the fuel system and stop the fuel balancing. (Agreed, no argument,)
But, please, let’s consider:
We have a person who previously endured a hypothesised period of just over an hour (63 minutes) at FL390 and survived by using “a large supply of supplemental oxygen and a mask which is effective” [Section D.4.6].
The pilot and aircraft then descended to 10,000 feet, the descent taking virtually a quarter of an hour and flew at 10,000 feet for 40 minutes.
It is considered reasonable that the pilot continued to use oxygen during the descent, and possibly continued to do so whilst at 10,000 feet.
Would that person need to restore the aircraft pressurisation to normal during the climb (17½ minutes) and completion of the fuel balancing (say 20 minutes altogether) ONLY to then switch it off again. ?
@Sk999 Can say what the start time, start location and FL are you using for your simulation?
@VictorI Getting significant figures right (of the decimal point 😉 ) has been my problem since being an undergraduate.
>>>>
Some of us have found that setting a fixed FL and varying the M was a convenient approach to absorbing any small errors in the met model so as to see if the error on a route minimizes and to make quantitative comparisons. That does not mean that the simulation exactly duplicates the physical environment at that time. For the nonce (Br.) all of my comments, except when stated, refer to LRC. The difference with respect to constant M, at FL390, is nil.
@DrB
The statement that the FMT occurred later than circa 18:54 conflicts with your Fig 3 where the path at 18:43 is 180T. Moreover, this line of argument presumes that your path from NILAM to IGOGU is accepted (including the descent). So far as I am aware, there is no evidentiary basis for that assumption during the period from 18:22 to at least the FMT.
@Sid Bennett,
You said: “The statement that the FMT occurred later than circa 18:54 conflicts with your Fig 3 where the path at 18:43 is 180T. Moreover, this line of argument presumes that your path from NILAM to IGOGU is accepted (including the descent). So far as I am aware, there is no evidentiary basis for that assumption during the period from 18:22 to at least the FMT.”
There is no conflict. We believe it is most likely that the FMT occurred circa 19:10. There were probably two turns after 18:43. See the Events Table E-1. Just because the track was at 180 degrees at 18:43 does not mean the FMT occurred before then.
The evidentiary basis is that our FMT Route is consistent with the radar track, with the Kate Tee sighting, and with the practice shown earlier in the flight to turn at and to follow FIR boundaries. This includes the path from IGOGU to NOPEK, which is a FIR boundary. Our FMT Route also arrives at the best-fit 19:41 location on time and at the correct track with no Holding Pattern. If you have an alternate FMT Route that does the same things, please show it.
@DrB
Only if the (initial) FMT at IGOGU is to 180 is it on a FIR boundary. The second turn along a FIR boundary is arbitrary.
For 5 years, the term FMT has been understood to be “Final Major Turn”. Re-purposing it creates confusion. I suggest that you find another neologism for your zigzag path.
Prior to the FMT, the only coincidence noted with FIR boundaries is that at IGARI when the plane first diverted. But it does not follow the convoluted FIR boundary over land. The route seems to me to be direct Penang. It is well off any published air route.
I have not followed the Kate Tee conversation for years, but if this is the newly applied evidence, we need to return to the previous discussions to see why it was previously discounted.
As to an alternate route, I proposed 186 at 18:39:30, LRC @ FL390 (no further maneuvers). I have published my example spread sheet. It does not run out of fuel providing that you do not attempt to join it to your post 19:41 route starting point.
I have also recomputed the paths surrounding the 186 path, increasing the BFO_sd value from 1.0 to 2.0Hz to be consistent with your model and of course this improves the fit.
I am in the process of digitizing you Fig. 17 so that I can compare the temps, wind direction and speed that I use for plausibility.
@DennisW
You asked “Does that mean that I would make a funding decision involving several million USD based on the paper?”
OI, prior to their previous search in 2018, invited us to London on 7th/8th December 2017 for a conference before spending several million USD on a further underwater search for MH370, on a no risk basis for the Malaysian Government. Unfortunately, that search was unsuccessful.
If OI return to the underwater search and this time find MH370, then they will have demonstrated to the world, that they are the unrivalled leaders in the seabed search and salvage business in a multi billion dollar market. The deep sea mining business alone is set to grow to $15.3B by 2030.
Why wouldn’t you make the funding decision?
@Richard
My comfort zone for taking on financial risk is low. I think OI is already highly regarded in the search and salvage business, and taking unnecessary risk might not be in their best interest.
@Richard
Also, when I looked at the OI/Malaysia previous agreement I concluded that OI’s expenses were not tax deductible if they did not find the wreckage.
@DrB
Bobby and team, congratulations on the extraordinarily comprehensive effort.
Re: ‘… with the practice shown earlier in the flight to turn at and to follow FIR boundaries.‘
You’re on very shaky ground with that claim. The aircraft most assuredly did not follow a FIR boundary earlier in the flight. As Sid has noted subsequent to the turnback the aircraft tracked pretty much directly towards Penang. That track was roughly coincidental with what was then a published and well trafficked airway, B219. As has been noted any number of times, B219 (being straight) crossed the Golok River (being serpentine) and therefore the Thai-Malaysian FIR boundary at four places. However, there was never any confusion as to responsibility for traffic on B219; it fell under Malaysia’s ATC Sector 5 Area of Responsibility.
The contention that an aircraft would deliberately track along FIR boundaries to avoid attention is frankly somewhat flawed. To avoid attention you would seek to do what is usual or normal; you would avoid doing the unusual or abnormal. It is not usual or normal for air traffic to track along FIR boundaries; doing so would only serve to draw rather than avoid attention.
Separately, in the paper you make the unconditionally declarative statements ‘The Indonesian Military Radar at Sabang was not operational on 7th March 2014‘ (p.5) and ‘The Indonesian military radar at Sabang was not operational on the night of 7th/8th March 2014.‘ (p.18). How do you know that?
You refer to the possibility of radar detection on p.5 but address it in more detail on p.34 where you state,
‘If unexpectedly, a radar detection was made by Sabang, then MH370 would be deemed as no threat, by following the FIR boundaries and turning due west away from Sabang and Indonesian airspace, at the critical point of possible detection.‘
Surely, this misses the point. If radar detection was made by Satrad 233 Sabang then the entire south-west-south sequence from ANOKO to south of BEDAX would have been observed. The target may not have been deemed a threat but that utterly bizarre manoeuvring would have been at the very least noteworthy, particularly to the military.
And that manoeuvring, all performed under the potentially watchful gaze of a military radar station, is the key element of the old switcheroo from an otherwise unremarkable transit north-west along the Strait of Malacca to the final, ostensibly deceptive track into the Southern Indian Ocean. It’s somewhat akin to a bank robber planning to switch get away cars just outside a police station.
@DennisW. In your 11th March “Additional Commentary” on search probability you found the probability of a find in the A1 searched and unsearched areas was 31%. On 19th March on lifting the search detection probability from its previous 0.8 to 0.9 you arrived at 22.4% probability of a find in those areas.
In the attached I describe another approach using those most recent 0.6 & 0.9 probabilities. That comes up with 39%.
Also, if a priori probabilities of 0.95 & 0.95 were assumed, representative of the ATSB figures, the a posteriori probability of it being in that total area would be about a half, the other half lying outside. The probability of it being in that particualr A1 searched area would be about 8%, though if a high weighting were given to that area it might rise to 80%. Again this is using the ATSB probabilities.
https://www.dropbox.com/s/0srojs876gbpc9w/Bayesian%20search%20probabilities.docx?dl=0
@Richard, DennisW. Enter stage left Covid-19. Ships (and I might add submarines) will need to be careful in screening and what ifs.
Bobby Ulilch,
I stand corrected – difference of BFORs. You state, “Yes, the BFORs are indeed correlated, as a result of OCXO drift. That correlation is mostly removed by taking the 1-hour differences.” That depends on the type of drift. A step-function in the bias offset would, indeed, be largely removed, and that is one application where I have seen differencing is used. A linear drift would result in a constant, non-zero mean value for the differences and so would not be removed. A quadratic drift (such as is introduced by routes that end at the northern limit of the ATSB search zones) would result in a linear drift in the differences. I actually looked at that case some 3-4 years ago. However, differencing also introduces correlations between successive differences due to read noise (+contribution in the 1st difference, -contribution in the 2nd.) As they say, pick your poison.
“Your OF is some (weighted?) combination of RMS BTORs, BFORs, and a MEFE time error.” Weighted – yes. Can’t combine them sensibly otherwise.
“The next logical step is to hold the route parameters fixed, and vary the BTORs and delta BFORS using random values with the appropriate statistics. Then one observes the variation in the FOM.” Actually, the next logical step is to run a maximum likelihood analysis, just like what was done in the report, and determines the final latitude. But you do note that later in your comment.
“Therefore, comparing the sensitivity results must be done with caution, because comparing sensitivities based on different FOMs is comparing apples to oranges.” Agreed in general. But the tall pole is and alway will be the BTORs. They are the best route discriminant. But I haven’t looked in detail at all the other statistics you include. If you have others that are materially useful (and not just repetitive of what we already have), I would be interested to know which ones.
“The second thing one can do is to actually fit the route parameters to each set of random BTORs and delta BFORs. You have already done this. I have not, because of the slowness of my route fitting method.” That is what I bring to the table. I gather that your algorithms are implemented in Excel. I am amazed at what folks are able to accomplish with that tool, but at some point you hit a wall. My algorithms are implemented in code. Getting the algorithms correct is all important, but once you do, code is easy to run fast and in parallel.
“Your result for the variation of the LEP latitude seems reasonable for the FOM you are using, but I would expect the more complex FOM I am using to have a smaller variation in the LEP latitude.” Agreed. But by how much?
@Dennis W. Two changes please. 3rd line should conclude, “….22.4% probability of the wreckage being in those areas.”
3rd para second line should read, “….in that total ATSB area…”
@Sid Bennett,
You said: “For 5 years, the term FMT has been understood to be “Final Major Turn”. Re-purposing it creates confusion. I suggest that you find another neologism for your zigzag path..”
We are not re-purposing it. You are very confused.
The FMT is the LAST major turn made by MH370. We follow that meaning exactly, as the last turn in our proposed route is a 90 degree left turn at 19:10 at 6.0N 93.8E That puts MH370 on a 180 degree true track through BEDAX and then toward the South Pole.
You also said: “Prior to the FMT, the only coincidence noted with FIR boundaries is that at IGARI when the plane first diverted. But it does not follow the convoluted FIR boundary over land. The route seems to me to be direct Penang. It is well off any published air route.”
The diversion and turnback occurred exactly at the FIR boundary, as shown in our Figure 2. The path back to Penang does not follow the (wiggly) FIR boundary exactly, but it does follow it in an average sense when over land and then leaves it when nearing Penang.
You also said: “As to an alternate route, I proposed 186 at 18:39:30, LRC @ FL390 (no further maneuvers). I have published my example spread sheet. It does not run out of fuel providing that you do not attempt to join it to your post 19:41 route starting point.”
Your route turning once to 186 degrees does not match the 18:40 BFOs at LRC. In addition, there is insufficient fuel to fly a 186 degree route, ending near 37.5S, as we have demonstrated in great detail in our paper. The fuel probability is 0%. You cannot get an acceptable fit to the satellite and GDAS data with LRC at FL390 at 186 degrees. A higher air speed is needed at and after 19:41. The best combination is M0.84 at FL350. The significantly higher FF needed to fly significantly faster than LRC at FL350 (as I discussed previously) makes it impossible to achieve MEFE at 00:17:30.
You are beating a dead horse.
@sk999,
You said: “But I haven’t looked in detail at all the other statistics you include. If you have others that are materially useful (and not just repetitive of what we already have), I would be interested to know which ones.”
You will find a list of what we use in Appendix G.1. They all appear to be useful.
Also: ““Your result for the variation of the LEP latitude seems reasonable for the FOM you are using, but I would expect the more complex FOM I am using to have a smaller variation in the LEP latitude.” Agreed. But by how much?”
I’m working on running a limited number of random trials to get a handle on the dispersion of LEP latitudes with my FOM. I now have random BTO and BFO generators in my program that I can switch in to use instead of the satcom data. I have also verified that the statistics and route probability estimate they produce match the expected values (mean, standard deviation, etc.).
I will ask again, what is your equation for the FOM used in your fits?
@DennisW. My regrets. One correction made also to the dropbox expansion, at its para 5.
@David
All good.
@Mick Gilbert said: The contention that an aircraft would deliberately track along FIR boundaries to avoid attention is frankly somewhat flawed.
I’ll let the other co-authors speak for themselves, but my opinion is that MH370’s path was selected to minimize the occurrence of military interception, in addition to providing deception for the final trajectory.
Over the Malay peninsula, it flew at maximum speed as it tracked an inbound path towards Penang Airport that would have been similar to what would be needed for an instrument approach to Penang’s RWY 04, and therefore deemed “friendly” by military radar operators. The active runway at the time was RWY 22, but the approach to that runway would have come much closer to Butterworth, and would therefore be more likely deemed hostile.
Over the Malacca Strait, the plane remained in Malaysian airspace until it reached the boundary between Malaysian and Indian airspace at IGOGU, and turned south. It then traversed the Indian-Malaysian boundary, posing no threat to the Andaman and Nicobar Islands, and then west along the Indonesian-Indian boundary, posing no threat to Sumatra, before turning south and crossing into Indonesian airspace, but on a non-threatening, southern trajectory away from Indonesia.
The low altitude around Sumatra made radar detection difficult, which both minimized the probability of an interception, and also helped to hide the final southern trajectory to the SIO.
@Mick Gilbert
I agree with Victor’s assessment. It was all about deception and avoidance of interception.
Here are a few more detail points in response to your comments.
(1) Diversion at the FIR boundary between Kuala Lumpur (Singapore) and Ho Chi Minh.
You say we are on shaky ground with our claim concerning FIR boundaries, but the Malaysian SIR documents the confusion caused between the Vietnam and Malaysian ATC in full detail. That part of the plan worked very well.
(2) Turnback over Malaysia along the FIR boundary between Kuala Lumpur and Bangkok.
You say the aircraft “most assuredly did not follow a FIR boundary earlier in the flight.” I agree that MH370 followed close to the former flight route B219. I apologise that we did not include this flight route in Figure 2, but we used the current SkyVector chart and the flight route is no longer in use. B219 was used between 2011 and 2017 initially for flights between Kota Bharu (VKB) and Penang (VPG) and later also for en-route traffic to Penang from Vietnam, Hong Kong and China.
Here is a link to the old SkyVector chart from 2015, that shows flight route B219. As you can see it follows the FIR boundary between Kuala Lumpur and Bangkok. To state otherwise, as you do, is misleading.
https://www.dropbox.com/s/vk48a14qup2olyl/Malaysia%20Airspace.png?dl=0
(3) Malaysian Military Radar.
The Malaysian Military Radar data has not been published. But the DSTG were given the data and state that MH370 was tracked every 10 seconds from 16:42:27 UTC to 18:01:49 UTC. The Malaysian Military were aware, if they were watching, that MH370 diverted and crossed Malaysia, but they claim that they did not try to intercept MH370. That part of the plan worked as well.
(4) Indonesian Radar at Sabang.
Regarding the operational status of Sabang radar, you ask “How do you know that?” The answer is that it was confidential information under a private non-disclosure agreement from an official source. We know that Sabang was not operational and there is circumstantial evidence, that ZS knew that fact as well.
You further state “The target may not have been deemed a threat but that utterly bizarre manoeuvring would have been at the very least noteworthy, particularly to the military.” The first problem with that statement is, that the Indonesian military were not watching. The second problem is that the route is not “utterly bizarre”, it fits the timing and BTO at the 2nd Arc, it fits the fuel used, it fits the BFO data during the first call and all without a holding pattern. Please show me your FMT route that fits the BTO, timing, fuel and BFO data!
Bobby Ulich,
The figure of merit (actually, chi square) that goes into the least squares is the weighted sum squares of the BTOR and BFOR, with weights of 29 microsec and 2.8 hz respectively, plus the time of fuel exhaustion (I’ve been using 17:00). Iniitially I used an rms scatter on that time of 3 minutes (to account for all the possibilities that you have enumerated) but then found I could reduce it to 1 minute and still find a good solution. Additionally, for each adjustable parameter in the fit, I add a term that is effectively a prior “measurement” of that parameter with its own weight. The prior “measurements” for the route parameters, which are the starting values for the least squares, come from a previous grid search of those parameters and are simply there to keep the least squares fitter from sending them off to nonsensical values. The weights are kept loose (e.g., the starting longitude is 93.3 degrees, with a “standard deviation” of 30 degrees.) The one exception to diffuse priors is the flight level (which I parametrize as the index of the pressure altitude in the GDAS table) which is assigned a small standard deviation to keep it from reaching unphysical values. (The starting value is about FL400). The wind speed error parameters are given priors of 0 with a standard deviation of 2 knots.
I do not include either the mean of the BTOR or the mean of the BFOR as statistics in the FOM. The offset bias of the BTOs is known from the value when the plane was at the gate in KL and is thought to be stable for a flight, so there is no reason to allow it to float. The offset bias of the BFOs is accounted for by including it as yet another parameter in the fit with a prior given by the value at the gate in KL and with a standard deviation of 2.3 hz. This latter is derived by examining the in-flight shifts in the BFO bias for both the MH371 and Mumbai flights, where we have gate values both before and after the flights.
@sk999
I would not reference the Mumbai flight as an example of the advisability of using BFO as a flight path metric.
@sk999,
Thanks, Steve, for the explanation of your FOM for route fitting.
I do a similar thing in EXCEL as your “prior measurements”. For instance, the EXCEL nonlinear minimization algorithm often starts with a 10% step in non-zero parameters. Sometimes that is far enough that one of the calculations blows up. So, for a number of the sensitive parameters (FL, longitude, etc.) I fit a delta to a nominal value. This keeps the calculations valid and without errors, so it can converge. By the way, the EXCEL nonlinear minimization routine is finicky and very slow to converge. That’s the kindest thing I can say about it. Usually I can can get there faster by running several fits of parameter subsets. You really can’t just tell it to adjust all the parameters and walk away. It’ll never get there in many cases. It seems to get stuck, perhaps at a shallow local minimum, but sometimes it is clearly not at any minimum, local or global. It just stps converging. Usually I can see which parameter is off, and a manual iteration gets it moving again. So, I have to run each fit in multiple stages, and this is time consuming for me to do. It usually takes several hours per trial. If I could start over, I wouldn’t use EXCEL, although I have to say it is very handy for doing the simple subroutines, but poor for fitting 10 or more parameters.
@sk999: Have you looked at the correlation factor of the BTORs to see if there is a trend near the peak and away from the peak?
@Richard
Re: Sabang- A person on Reddit is trying to say there is also civil radar at Sabang that would pick up approx. 60-nmile radius…I gave up arguing with the guy. I realize they may have other radars (WITT etc) but we do not think they were up and running, right?
@DrB
I am preparing a summary of the my current position and hope to complete it in a few days or less.
I do not have to accept your premise that the route to 180T identified as starting at 19:22 (your table G-1) is the only such route that can be found. I assure you there is a similar route starting at 19:22 (at a different lat/long of course)that reaches the 186T intersection with the 6th arc. Moreover, it joins exactly to a LRC route at 186 starting at IGOGU at 18:30:30. My horse lives!
When we discussed this some months ago, the problem was that I did not care what the FL was, and adjusted the M for minimum error. The that the intersection of the path with the 6th arc is required at 00:11 is a defacto constraint on maximum range as we know that the fuel is exhausted prior to 00:19. This determines the ground speed. Having been criticized for not having used a fuel model per se, I ran cases for Barry’s LRC fuel model and found that somewhere between 390 and 410 would give the appropriate ground speed and endurance.
I have provided bits and pieces of this before, but I see that it is necessary to provide a more extensive discussion and I am preparing that.
With respect to the radar data. Richard says that Indonesian radars were inoperative and that a private source indicated that ZS knew it.
If the Indonesian radars were operating during the times in question, the plane would have been observed over the Straits of Molocca. No such observation was reported. So we should not expect any detections at a later time, unless the Indonesian radar data was entirely suppressed.
Sid
“With respect to the radar data. Richard says that Indonesian radars were inoperative and that a private source indicated that ZS knew it.”
Richard did not say that.
@Sid Bennett,
You said: “I do not have to accept your premise that the route to 180T identified as starting at 19:22 (your table G-1) is the only such route that can be found. I assure you there is a similar route starting at 19:22 (at a different lat/long of course)that reaches the 186T intersection with the 6th arc. Moreover, it joins exactly to a LRC route at 186 starting at IGOGU at 18:30:30. My horse lives!”
I never said our FMT Route was the ONLY route to get to the 19:41 position for the SIO Route.
However, I have been unable to find any route which turns directly off N571 (offset or not) to 186T and matches the necessary (to match the 19:41 to 00:11 satcom data) 19:41 location at 186T without additional turns or a holding pattern in between. You are welcome to try.
Please provide the positions and altitudes versus time to back up your claim. While you are at it, please show how the 18:40 BFOs are also matched by your route.
@Mick Gilbert, @Sid Bennett, @DennisW, @TBill
Indonesian Radar
What we can say is that we have talked with a former official who was part of the MH370 investigation, who believes the Indonesian radar records were blank, because the radar was not operating, when MH370 passed near Sumatra.
@DrB
Richard did say “Regarding the operational status of Sabang radar, you ask ‘How do you know that?’ The answer is that it was confidential information under a private non-disclosure agreement from an official source. We know that Sabang was not operational and there is circumstantial evidence, that ZS knew that fact as well.”
If I quote, I quote. If I paraphrase, I paraphrase.
For the nonce, since it suites my view, and since I respect Richard’s need for protection of confidential information, I take the statements as factual.
@DrB said:
“Please provide the positions and altitudes versus time to back up your claim. While you are at it, please show how the 18:40 BFOs are also matched by your route.”
I have shared versions of this spread sheet before with Richard and others. However, there are multiple modes of operation of which this is the LRC at 39000ft, starting at 18:22 with a PDA=1.0. It is not intended to be used without some understanding of one or two quirks when actually using the spread sheet, which have been left in for code stability purposes and which I work around.
https://www.dropbox.com/scl/fi/s4i4rjhpqn4dzv6mhzvv0/186BSMv7-10-4-1-rFMT186LRCtest1.0pct-PDAadjFMT1_work-copy.xlsx?dl=0&rlkey=1ook1t4tojttpc22u3ry6w92d
Your paper strongly implies that there is only one last leg from 19:22 that, when joined to the path at an earlier time, meets the fuel criteria and the error criteria for a plausible route.
I cannot agree with you based on the spread sheet referenced above.
@Sid Bennett
You state: “I have shared versions of this spread sheet before with Richard and others.”
That statement is true, but misleading. I have not seen this version of your spreadsheet before and it is quite different.
I have already responded to you in private and on this blog with my critique of previous versions of your spread sheet. I will now respond to the latest version of your spreadsheet.
You incorrectly set the PDA to 1.0% and the ZFW to 174,000 kg. You do not account for the fact that the right engine uses 1.5% more fuel than the left engine.
You show fuel exhaustion at 00:12:15 UTC and not 00:17:30 UTC, demonstrating that there is insufficient fuel for your proposed flight path, even with your incorrect settings.
Correcting the PDA to 1.5% and the ZFW to 174,369 kg in your model, results in fuel exhaustion at 00:09:15 UTC, which is an even worse fuel shortfall of 741 kg, according to your own calculations.
Bobby, Victor and I have each built models independently of each other. Our 3 models agrees very very (repeat intentional) closely with each other. These models have been validated with a number of test cases. Bobby and Victor have both previously pointed out to you, that there is insufficient fuel to reach your end point of 37.67°S 88.98°E. Your own model shows you there is insufficient fuel to reach your end point.
In addition, your model is inaccurate and inadequate for the purpose:
1. Your model only includes the weather data to the nearest integer latitude and longitude and does not interpolate to the exact latitude and longitude.
2. Your model does not interpolate the GDAS data for time between 15:00, 18:00, 21:00, 00:00 and 03:00 UTC and only considers GDAS data at 00:00 UTC.
Our models perform a quadrilinear interpolation in 4D on the GDAS data.
Our models do not assume any particular start time, start latitude, start longitude, altitude, navigation mode, speed mode or Initial bearing. We have tested all combinations.
We have simulated over 2,300 different flight paths and the LNAV180 LRC FL390 is unique.
You are stuck on one flight path based on an inadequate model, which even according to your own model does not have sufficient fuel.
To use @DennisW terminology “you are beating on a dead horse”.
CORRECTION:
@Sid Bennett
Your model includes the weather data to the nearest integer latitude and longitude and now includes a linear interpolation to the exact latitude and longitude, but only at each pressure altitude from 150 hPa, 200 hPa and 250 hPa and only at 00:00 UTC.
@Richard
As I mentioned yesterday, I am preparing a paper which tries to place the studies I have done in context. I am responding to you now so that the readers of the blog may better follow the arguments when reading it.
Richard said ,and my responses are interspersed [ ]:
@Sid Bennett
You state: “I have shared versions of this spread sheet before with Richard and others.”
That statement is true, but misleading. I have not seen this version of your spreadsheet before and it is quite different.
[On March 16, 2020 I posted the link to the spread sheet using the LRC and PDA =1.0 to the IG mailing list. All of the authors of your paper are included.]
I have already responded to you in private and on this blog with my critique of previous versions of your spread sheet. I will now respond to the latest version of your spreadsheet.
[Ultimately I concluded that you would not appreciate the results computed at a constant M, so I finally performed the computations for LRC referred to above, even though the granularity of ground speed would be greater. Fortunately the 39kft altitude (about 200hPa) the ground speed at M=.84 turns out to be satisfactory.]
You incorrectly set the PDA to 1.0% and the ZFW to 174,000 kg. You do not account for the fact that the right engine uses 1.5% more fuel than the left engine.
[Well, if the right engine uses 1.5% more fuel, what does the left engine use? I believe our PDA is for both engines. It is a little less precise than your model.]
You show fuel exhaustion at 00:12:15 UTC and not 00:17:30 UTC, demonstrating that there is insufficient fuel for your proposed flight path, even with your incorrect settings.
Correcting the PDA to 1.5% and the ZFW to 174,369 kg in your model, results in fuel exhaustion at 00:09:15 UTC, which is an even worse fuel shortfall of 741 kg, according to your own calculations.
Bobby, Victor and I have each built models independently of each other. Our 3 models agrees very very (repeat intentional) closely with each other. [And therefore redundant. The use of multiple models serves as a check on a possible computational error but does not improve the accuracy if the models are substantially the same.] These models have been validated with a number of test cases. Bobby and Victor have both previously pointed out to you, that there is insufficient fuel to reach your end point of 37.67°S 88.98°E. Your own model shows you there is insufficient fuel to reach your end point.
[In Fig. 29 of your paper ,case 9, for example, you state the predicted fuel at 19:41 as 26,507kg. At cell R11 of the main tab of the spread sheet, the FOB is 26,591. Starting with the ZFW as a standard of comparison is not as precise as your computed FOB for the various cases.]
In addition, your model is inaccurate and inadequate for the purpose:
1. Your model only includes the weather data to the nearest integer latitude and longitude and does not interpolate to the exact latitude and longitude.[In a later post you acknowledge that Barry’s spread sheet does do interpolation. So far as I am aware, it has had this capability for years.]
2. Your model does not interpolate the GDAS data for time between 15:00, 18:00, 21:00, 00:00 and 03:00 UTC and only considers GDAS data at 00:00 UTC.
[I have prepared a comparison of the winds and temperature that you use in Fig. 17 with the spread sheet data and show the comparison in a document availible here:
https://www.dropbox.com/s/s093bjfzoh4fvlb/comparison%20with%20Fig.%2017_032620.pdf?dl=0
Note that since the 186T path is further South than the 180T path at 19:40, the plane experiences the effect of the environment at a later time for the 180T case.]
Our models perform a quadrilinear interpolation in 4D on the GDAS data.
Our models do not assume any particular start time, start latitude, start longitude, altitude, navigation mode, speed mode or Initial bearing. We have tested all combinations.
[Nor did ours assume a particular location except for the position of the plane at 18:22]. The path is the result of hundreds (probably thousands..I never counted) of trial paths so as the refine the current path estimate.
We have simulated over 2,300 different flight paths and the LNAV180 LRC FL390 is unique.
You are stuck on one flight path based on an inadequate model, which even according to your own model does not have sufficient fuel.
To use @DennisW terminology “you are beating on a dead horse”.
I expect to post a draft of my findings in several days.
@Sid Bennett said: Well, if the right engine uses 1.5% more fuel, what does the left engine use? I believe our PDA is for both engines. It is a little less precise than your model.
2.25% for the right and 0.75% for the left would be a good place to start. The average PDA would be 1.5% and the difference would be 1.5%.
@VictorI
A quick adjustment of the PDA to 1.5% changes the FOB estimate at 00:11 from +125kg to -65kg. Such precision would seem to be unnecessary unless we were using the results to inform our understanding of the behavior after fuel exhaustion.
@Sid Bennett: You were discarding 0.5% of fuel flow because you didn’t understand how the average PDA for the two engines could be 1.5% coincident with a difference of 1.5%. Now you say a refinement of 0.5% is “unnecessary” instead of accepting the correction.
A wise man once told me that there is no use in trying to persuade somebody that doesn’t want to be persuaded.
@Sid Bennett
Fuel exhaustion was at 00:17:30 UTC and not 00:11:00 UTC.
A quick adjustment of the PDA to 1.5% changes the FOB estimate at 00:17:30 UTC according to your spreadsheet from -548 kg to -741 kg.
We discarded all flight paths with a fuel shortfall of greater than the 2σ fuel prediction error, which is 427 kg (please see Appendix D and Table D-2 in our paper).
@VictorI
Sorry if I read your post too literally. But in order to be exactly comparable, isn’t the use of 1.5% for both engines a reasonable estimate.
The fuel consumption at 00:11 is about 107kg/min with both engines. You estimate the maximum continuous thrust of the left engine at 74kg/min (para A.12).
If I had anticipated this attack on the details of the fuel model, I would have run the model at 41kft and somewhere around 185.8T and had about 90 kg fuel remaining at 00:11. So, the additional 6 minutes of fuel to get to 00:17 would be about 370kg and we would predict a shortfall of about 280kg.
You are insisting that all of the parameters match those which you use in order to be credible. I realize that you have devoted an enormous effort to the paper, and it provides me with a wealth of detailed information to better place my study in context.
If you really are open to the possibility that there is more than one plausible path, you should look at this more carefully. You have all of the parameters that I use and the only question seems to be the altitude of the flight if it indeed was at a fixed FL. You should compute it yourself.
I am lazy, Did you consider the discrepancy total arising from using a fixed passenger weight? 🙂
@Sid. I have a lot of sympathy with the your affinity for paths towards the southern end. What I cannot understand is why you have settled on 186 in particular. As IG, ATSB, DSTG showed way-back-when, there is a whole spectrum of more or less equally good paths from a BTO fit perspective. I also don’t understand why you favour a theory that ends up in a zone that has been thoroughly searched.
@paul
You might well ask the same question of the boosters of 180T or other areas that have been suggested. ATSB/DSTG defined the search area statistically, whereas Richard I and some others of the have studied discrete plausible paths.
I did not settle on 186 in particular. The spread sh3eet did after a consensus was reached that the plane flew on N571 until it turned south. The spread sheet indicated that the turn needed to occur between 18:35 and 18:40. Using that result, the solution space of times and azimuths were computed to determine the path and FMT time with the least error.
I realize now that using a constant M at an arbitrary altitude solely to obtain the required TAS did not satisfy others, but the selection of a reasonable altitude (e.g., 39kft made the difference between LRC and M=.84 to obtain that TAS minimal.
A number of other paths have been suggested and I have studied fragments thereof, just as Richard did in his broad survey. But the proponents of the other paths have not been able to make a convincing argument starting at 18:22.
Implied in my stubbornness is a belief that the crash site lies further from the 7th arc than has been searched. I have held this view for a long time and argued it on the IG mailing list years ago. I may be wrong, but then again….
Do you have a particular path to suggest? If it is reasonably doable with Barry’s spread sheet I will try it.
I have spent the day answering comments on this blog rather than working on my paper, but will attempt to proceed as rapidly as possible.
You may well ask why I am making my comments now. I made them before, but I did not have the wealth of detail that the recent paper provided. What was it they used to say in English classes? “compare and contrast”.
If I have made an error or unfounded assumption, let me know. If there are two plausible paths to the 7th arc, there may be more.
@DennisW. Your, “..all good..”.
Thanks and I note that you have adjusted your March 21st probability of the wreckage now being in A1 area from 31% to 46%.
That was drawn from the probability of it being in the search area of 0.6 and the probability of it being found if there of 0.8, 80% of the search area being searched.
A continuing problem with that is that solution overlooks the remaining area, with a prior probability of 1 – 0.6 = 0.4. A posteriori that would become 0.4/(1 – 0.6*0.8) = 77%. That plus 46% makes a total post probability of greater than 100%, at 123%.
After further head scratching, herewith I believe is a satisfactory solution. I use your 21st March probabilities.
Points:
• As you had them, prior, the probability of it being in the searched area of 80% of A1 was: 0.8*0.6 = 0.48; in the 20% unsearched A1 area a quarter of that at 0.12, those two adding to the 0.6 probability in total.
• Outside A1, the remaining unsearched area had the remaining prior probability of 0.4 as above.
• Post, the probability that of it now being in the 80% searched area still would be: 0.48*(1 – 0.8)/(1 – 0.48*0.8) = 0.15584
• The prospect of it being in the 20% unsearched area would be; 0.12/(1 – 0.48*0.8) = 0.19480
• The prospect of it being in the remainder of the unsearched area would be; 0.4/(1 – 0.48*0.8) = 0.64935
• 0.15584+ 0.19480 + 0.64935 = 0.99999.
• QED?
In summary, the new search prospects for the different areas are:
• The 80% of A1 searched area, 16%.
• The unsearched A1 area, 19%.
• All the area outside A1, 65%.
So, an A1 search probability of 35%.
Even so, I am confused. As I understand it you established a 60% probability for A1 from your histogram of Dr B’s route then as I see it you calculate what the probability would be that the wreckage was there after a search, as if Dr B’s probability applied before the last search.
@Sid. There are a great many plausible paths to the 7th arc – and that is the nub of the problem! We have a positive embarassment of solutions.
Since you ask, my preference is similar to yours but based on an earlier FMT. Depending on exactly when and where, you end up somewhere between 39.3S and 39.8S when you reach the 7th arc. I have come to the view that neither debris drift models nor BFO preclude a solution this far south.
Fuel inadequacy (using Dr B’s model) is a greater challenge – there seems to be an unbridgeable shortfall. I am currently chewing this aspect over to see whether I can come up with any possible explanation (apart from a straight-line drift-down, which I guess might do it).
@David
Yes, I am assuming DrB’s et. al. probability does not include adjustments for previous searches.
@DennisW. Then your (and my calcs) are looking at the probability that the wreckage is in the A1 area should a further search there fail.
@David
I am not sure about you statement. My probability calculation is for the probability of finding the wreckage should a new search be undertaken.
@DennisW. On second thoughts I withdraw it.
35% I believe.
@paul
If you take an approach such as DSTG did, there are certainly many paths, but most of them are not coincident with any physical path. If you have a proposed path with a specific turn to the SIO, I will try to simulate it.
As for the fuel model, I contend that the difference between my calculation and one which DrB would have made for the same route is minimal. I explained that previously today. The spreadsheet fuel model assumes that the two engines have the same PDA. The fuel consumption after about 00:11+ is shown for two engines and my post adjusted it for one engine at max continuous power.
My preference for 186 and a single FMT goes back to the original IG calculation of a recommended hot spot and my earlier calculations were a part of the ensemble used.
@paul
If you have a specific path that you are interested in, I will attempt to simulate it with the same spreadsheet.
@David
We have had a long history of analytical predictions – some six years worth now. The latest is indeed a Herculean effort, but it is hard to ignore history. Especially for an old guy like me.
Having said that, my inclination is to continue the search North along the 7th arc from 25S.
I have read some compelling arguments for a more Southerly location, but they are difficult to entertain considering fuel range.
@Sid, that is kind of you to offer but no need. I am also using Barry Martin’s model but have adapted it to operate in 5 second steps with time-interpolated Wx for specific flight levels, plus some other minor tweaks.
@ paul smithson
I was looking for your old report – had a copy but can’t find it in my computer. Do you have a link please.
@DennisW. Mr Bayes can help with a couple more questions.
As previously, using your 0.8 probability that the wreckage would have been found if in the area of the previous search, the probability of it being found in a search now of A1 would be 35% by my estimate. But supposing that 0.8 were 0.95, ie indicative of what the ATSB expected, what difference would that make?
By my estimate (workings available) the 35% would drop to 26%.
Also, if a search of A1 were conducted now with that same 0.95 prospect but unsuccessfully, the probability of the wreckage being in A1 remaining your estimate of 0.6, what would be the likelihood that it would be in A2 or A3?
The likelihood of it being outside A1 would be 98%. Were then it assumed that the prospect of it being in A2 or A3, rather than elsewhere, is 90%, that translates to an 88% probability of it being in one or the other.
However I think you would take issue with that assumption.
Again, in the above there is neither weighting nor consideration of probability density (ie per unit area) but these simple formulae and analyses do add some insight all the same I think, thank you.
@David
I am not ready to embrace a terminus very far from the 7th arc. The data simply does not support that conclusion. I regard it as a creation by the authors of the latest report to justify (the wreckage not being found) and expand their terminal predictions.
I used 80% detection probability as a conservative number to recognize Victor’s claims of terrain masking.
@ Dr B.
https://mh370.radiantphysics.com/2017/02/16/more-analyses-of-mh370-data/#comment-213
In the post referenced above, you introduced the requirement to compensate for temperature in calculation of fuel flow at the rate of +3% per 10C TAT and that this is a matter of physics rather than specific engine design. Could you please provide a citation for this?
In the same post, you go on to note that the combined effect of the temperature adjustment and PDA renders latitudes 37S-38S unreachable. In fact at this point you concluded that endurance to 00:17:29 was impossible except at best holding speed, although your figure also suggests that MRC at FL390 could get you there for a PDA of 1.5%.
However, in ATSB’s “MH370 – Flight path analysis update, Oct.2014” p9/15 Figure 2 indicates that the MRC boundary intersects the 7th arc at 38S. Similarly, in “MH370 – Definition of underwater search areas Dec. 2015 pp20-21/28 we are told that (assuming constant altitude MRC, BTO-compliant path models, prevailing winds, historic engine efficiencies) “The Boeing analysis gave a series of ranges and time intervals for different cruise altitudes. It was noted that a constant altitude of FL350 or higher gave sufficient range to reach the region on the arc corresponding to the DST Group analysis.”
Regrettably, we can’t see the details of the Boeing models and predictions. However, considering the remarks above, it is clear that their model must be several percentage points different in predicted fuel flow.
I realise that since then you have put in many more hours on refinement and validation of the fuel model. But as far as I’m aware, this fundamental difference in predicted endurance/range capability remains. How could this difference be accounted for?
@Sid Bennett
You shared your worksheet MAIN on:
March 25, 2020 at 3:40 pm.
Your fuel usage shows remarkable agreement with that of the BRVA report.
Remarkable in that your estimate FOB [RR] at 19:41:30 at Line#337 is tabled as: 26536 kg. Compare this with 26565 kg at 19:41:21 for Case 7 and Scenario 7B1 of the BRVA report, which produces the best (lowest) fuel shortfall of the Scenarios of that report. Refer Table D-3.
You run out of fuel just after 00:12:15. Refer MAIN Line#1420 87135 (secs) FOB [RR] at Column#GJ where just 5 kg is remaining. Compare this with Scenario 7B1 of the BRVA report, where the time at MEFE is approximately 00:16:32 (my estimate, not tabled in the report).
Even more remarkable that there is reasonable agreement between your fuel usage and the BRVA report considering that for the PDA for 9M-MRO you have only assumed 1.0%. Refer MAIN Cell FY16.
The word that Mick Gilbert used concerning the BRVA report, “comprehensive” is perhaps an understatement. The amount of gathering together of threads of information to produce the analysis and report is impressive. Concerning fuel usage by the aircraft, the reported use of historic records of previous flights and the initial part of Flight MH370 would seem unarguable. The use of 1.5% PDA (the two engines combined) seems unarguable.
Taking your tabled fuel flows or fuel tankage and applying the 1.5% PDA in lieu of 1% implies the following:
1. Initial fuel at time reported by the last ACARS message: 43,800 kg at 17:06:43
UTC; (for reference only, you have rounded this to 17:07)
2. Your estimate of fuel remaining at 19:41:30: 26536 kg;
3: Difference: 17264 kg consumed since time reported by last ACARS;
4: 17264 x 1.015 / 1.01 = 17349 so the revised estimate of fuel remaining at 19:41:30 is 26451;
5: Yes the revision only amounts to 85 kg equivalent to about 48 seconds flight time.
Applying similar arithmetic to consumption of the fuel remaining, or to all of the fuel consumed since 17:07, the overall reduction in endurance is approximately (just over) two minutes. This revised estimate for your analysis has the engine running out of fuel within a minute of, but before, the time of the sixth “arc” transmission.
@George G
Fuel exhaustion was at 00:17:30 UTC. Sid’s model shows a fuel shortfall of 741 kg (GJ1441), when you set the PDA to 1.5% (FY16) and the ZFW to 174,369 kg (GA6).
As I mentioned previously, we discarded all flight paths with a fuel shortfall of greater than the 2σ fuel prediction error, which is 427 kg (please see Appendix D and Table D-2 in our paper), with which you are intimately familiar, having spotted a number of typos!
@GeorgeG
Thank you for the careful assessment of the fuel modeling. Make a copy of the spread sheet as a working copy and change the PBA to 1.5 if you wish.
Yes, the correspondence with the UGIB paper is close (Do the authors prefer BRVA? If so I will alter my reference.). The only thing that has changed from the spread sheet that I have been using for years is to change from constant M to LRU and altitude from 350 to 390.
I don’t want to comment in detail as I am devoting my effort to the paper I mentioned previously.
I am computing the last leg of the 180T path so as to compare the two starting at 19:22). If they compare closely, the other last leg fuel models in UGIB can be adopted.
Our fuel model assumes that the two engines operate at the same PDA and would run out of fuel at the same time, without fuel balancing of some kind. In practice, taking account of the difference in PDAs, once the first engine fuel is exhausted, the fuel consumption of the second engine increases somewhat, but the overall time to complete fuel exhaustion increases.
Also, and I don’t know if it is significant, but the one engine could run out shortly before 00:11 without impairing the 6th arc ping.
Back to work on the paper….
@paul smithson,
You said: “I realise that since then you have put in many more hours on refinement and validation of the fuel model. But as far as I’m aware, this fundamental difference in predicted endurance/range capability remains. How could this difference be accounted for?”
I suspect that part of this difference lies in the assumed route between 17:07 and 19:41. After 19:41, we are using a Boeing LRC fuel flow table with the standard correction for TAT. So, it’s hard to see how our fuel flow calculations can be far off the mark. However, we have found, fairly recently, that the actual air speed after the turnback and until reaching Penang, was M0.87. This is based on our analysis of the civilian radar data. As far as I know, nothing like this air speed was assumed in Boeing’s calculations of the fuel available at 19:41. Therefore, the substantially higher fuel flows required crossing Malaysia will reduce the fuel we calculate as being available at 19:41, and this will noticeably reduce the range and therefore the latitude limit on the 7th Arc. Since no details sufficient to independently calculate the fuel following Boeing’s assumptions were given, it is impossible to compare their fuel at various points along the route.
In addition, Boeing’s fuel modeling was intended to bound the range problem. That’s why Boeing used MRC. Our goal is different – we predict the fuel required to achieve a best-fit route. West of 34S the air speed needed to match the satellite data is LRC and higher. That means that the there is at least a 1% lower SAR in our LRC (and higher) air speed than the MRC air speed in Boeing’s assumption. I am not ctiticizing the MRC choice back then. That was the appropriate choice to bound the problem when they had not yet assessed the probability that MRC could match the satcom data. Now we have determined that much higher speeds than MRC are required to the west of circa 180 degrees track.
So, our available fuel calculations at 19:41 are roughly 1% lower than Boeing’s, and our required fuel at 19:41 is at least 1-2% higher than Boeing’s because you can’t fit the satcom data there at MRC; it requires LRC and higher air speeds. So, there is at least a total 2-3% reduction in range in our fuel calculations compared to Boeing’s, with about a third of that occurring between 17:30 and 18:00 and the rest occurring after 19:41. In both both cases the cause is the need for higher FF because of the higher Mach needed to fit the civilian radar data and the satcom data.
You also said: “In the post referenced above, you introduced the requirement to compensate for temperature in calculation of fuel flow at the rate of +3% per 10C TAT and that this is a matter of physics rather than specific engine design. Could you please provide a citation for this?”
You can look at HERE ( or go to https://en.wikipedia.org/wiki/Thermal_efficiency ) for the equation for the Carnot efficiency of a heat engine, which is equal to [ T(H) – T(C) ] / T(H). Here T(H) is the temperature of the heat into the mechanical engine. For a turbofan engine this is the temperature of the air/fuel mixture after it is burned. T(C) is the environmental temperature into which the heat from the engine is exhausted (i.e., the air temperature). Now T(H) must be limited by the engine design and metallurgy to fixed value to maintain engine life. So, the engine efficiency (how much work it can do with the heat available) is proportional to a constant minus the air temperature. So, when the air temperature rises, the engine efficiency drops, and the lower efficiency must be compensated by a higher fuel flow to provide the required thrust. So higher air temperature causes higher required fuel flow. It seems intuitive that a heat engine is more efficient when the difference between the internal and external temperatures is greater. Warmer outside air reduces this temperature difference, and this reduces the engine’s efficiency, which must be made up by higher fuel flow to provide the required thrust.
You also said: “In the same post, you go on to note that the combined effect of the temperature adjustment and PDA renders latitudes 37S-38S unreachable. In fact at this point you concluded that endurance to 00:17:29 was impossible except at best holding speed, although your figure also suggests that MRC at FL390 could get you there for a PDA of 1.5%.”
That post was 3 years ago, and since then I have made many improvements in fuel modeling. I am still in agreement with the fact that there is insufficient fuel to reach 37S-38S, although the underlying reasons have changed somewhat.
Dr B. Thanks for the detailed response. From the above, it appears that you are saying the engine burns 3%/10C TAT more fuel to produce the same thrust (TSFC).
But are there not other variables at play here? With increased temperature we also get a (linear) reduction in air density. Drag, in turn, has a linear relationship to pressure (for a given Reynolds number). To make matters more complicated, I gather that the Reynolds number also changes with temperature.
On top of all this (for the purpose of kg/NM rather than kg/minute calculations), we have the change in local speed of sound with the sqrt of temperature, leading to higher TAS for given Mach, and drag being proportional to square of the speed. All of this is well outside my comfort zone and I am quite unsure how all of these factors combine together.
But, in short, if temperature changes are we not going to have a different thrust requirement? In which case it would not be correct to simply apply a TSFC correction factor for temperature while ignoring its effect on drag.
Above should read …Drag, in turn, has a linear relationship to pressure *density*
@DrB/Richard/Victor,
Philosophical musings.
I find the current situation very interesting relative to methodology. I have spent a quite bit of time over years reading about the “frequentist” approach to PDF versus “Bayesian”. In most cases the approaches converge, but the real statistical purists (savants) caution that they are quite different, and answer fundamentally different questions. I am not smart enough to follow their arguments and nuances.
I would characterize the recent paper as a frequentist approach as opposed to the DSTG Bayesian approach – both impressive pieces of work. However, the results truly are very different. Frankly, it would have never occurred to me to use a frequentist approach to the MH370 terminal PDF.
Anyway, good stuff, and very thought provoking.
@paul smithson: You are making this all too complicated. The 3% per 10K TAT increase in fuel flow (recommended by Boeing) includes the effect of density and viscosity changes from the standard atmosphere on both thrust and drag (including the Reynolds number effect). It is true that mileage decreases less than 3% per 10K TAT because TAS increases with temperature. But since we calculate TAS (using the OAT) and endurance (using the fuel flow), mileage is implicitly included in the analysis.
@victor. What I am trying to understand is what your “temperature-adjusted fuel flow” actually applies to. Is it TSFC? Mach? TAS?
The compensation makes an adjustment on the thrust side of things but that same temperature change also makes a difference to drag – and hence to thrust requirement to maintain a given speed.
@paul smithson: The LRC (and holding) tables list the value of fuel flow and Mach number(or IAS) for a given weight and pressure altitude. The 3% per 10K TAT deviation corrects the fuel flow when the OAT (and hence the TAT) deviates from the ISA temperature. That fuel flow deviation is due to changes in both TSFC and drag. The TAS of course will change for the same Mach number due to the temperature offset from ISA.
I suspect the response is “it simply increases LRC fuel flow, in kg/minute, period”.
But if that statement refers to LRC speed mode and the LRC selects mach according to weight/altitude, and that optimal mach will be affected by density/drag… you’ll see what I’m getting at.
So, do you think an LRC table for ISA+10 would look identical, except for the increased fuel flow 3%? Would the Mach/weight/FL relationships remain the same?
“except for the increased fuel flow 3%” – understood that this is per 10C TAT, not ISA delta
@paul smithson,
Yes, at non-ISA SATs, the LRC fuel flow table (for a given FL and weight), with 3% added per +10C in TAT, would be the only change. This corrects for both the TSFC and for the changed drag. The desired LRC Mach for a given FL and weight does not change with temperature, but the KTAS and the FF do.
Thanks Dr B. I shall pause and reflect!
@Paul
You said:
“Thanks Dr B. I shall pause and reflect!”
I think that is questionable… I still just “burst out” with anything I am thinking at the time. Pros and cons to each approach. I think forward progress is maximized by the “bursting out” mind set, and I encouraged it in my working career.
@Sid Bennett,
@Richard,
Sid, my intent was an independent reality check. If the 186 path you were proposing was not verifiable concerning available fuel, then there was no need to proceed with any other analysis, simple or in depth.
Sid, you wrote: “Our fuel model assumes that the two engines operate at the same PDA and would run out of fuel at the same time”
They don’t do that, sorry they didn’t, and in general they don’t. The likelihood of having two engines with identical fuel consumption is miniscule. [OK, my use of that word may be arguable.]
Hence it becomes necessary to make an estimate of the difference between the engines as well as of the overall fuel consumption. Fortunately, fuel consumption information for 9M-MRO was available.
The matter of individual fuel flows becomes of significance when estimating overall fuel endurance (i.e. when the second engine ran out of fuel) and in consideration of likely end-of-flight scenarios.
Sid, you also wrote: “Also, and I don’t know if it is significant, but the one engine could run out shortly before 00:11 without impairing the 6th arc ping.” It is significant. And I know [I think] the matter of when the SDU would run out of power has been thoroughly discussed previously in Victor’s blog/s, but I am not going to hunt for the information (I have not saved it) when someone (say Richard or Victor) could answer immediately. As I understand it, fuel runs out, engine runs down, AC power generation ceases during initial part of engine run-down, SDU becomes non functional.
Richard, Thank you. You wrote: “Sid’s model shows a fuel shortfall of 741 kg (GJ1441), when you set the PDA to 1.5% (FY16) and the ZFW to 174,369 kg (GA6).”. Comparison with my simple calculations shows the effect of the increase in ZFW from 174,000 to 174,396, resulting in increased drag and fuel flow, affects fuel consumed by about 50 kg in the time after 17:07 UTC on the 7th March (after having taken account of the PDA). The effect on estimated fuel exhaustion is significant. (Almost half a minute earlier). But any estimates of final fuel exhaustion for Sid’s model must now be tempered by “Our fuel model assumes that the two engines … would run out of fuel at the same time”.
Richard, yes the impact of the 2σ fuel prediction error, 427 kg, is clear in context of your report. As I said above, a reality check.
Richard, you write: “Fuel exhaustion was at 00:17:30 UTC.” In other words that is your estimate. In Section 5.4 the report reads: “the APU takes approximately 60 seconds to provide electrical power.”. Of interest might be the uncertainty in the time to start of the APU, but, admittedly, this should be a relatively minor factor.
@DennisW
Commendable approach. You had me “bursting out”
@Richard,
In your earlier discussion with Sid you mention that the “correct” zero fuel weight should be 174,369kg. This matches the value shown in SIR Table 1.6D Aircraft weights.
When we look at the ACARS messages 16:41 through 17:07 which provide aircraft gross weight (lbs) and fuel weight (kg) we find quite a variation in implied zero fuel weight, from 174,055 to 174,204; in all instances rather lower than the 174,369kg value.
Notwithstanding quantisation of the fuel weight estimate, I am puzzled why the ACARS-derived weights vary so much and why – on average – they imply a ZFW that is about 250kg less than the value in table 1.6D.
@Authors
Is it correct that you used the “Holding” Mach / FF values for FL100?
For the temperature do you use about 16 K above ISA conditions at FL100?
If so, one could “gain” some fuel available at 19:41 by descending to for example FL200 (in stead of FL100) and at the same time reach a 19:41 latitude slightly further south (0.6 – 0.7 deg further south). A quick estimate would suggest that subsequent 181 deg bearing LRC path should be feasible in terms of fuel available vs. fuel required. Possibly such approach could be followed to slightly higher FLs (200 – 300 range) and slightly larger post-19:41 bearings?
Furthermore, I’m looking at alternative routes, like turning directly towards BEDAX at 216 degrees track, from approx. 7.408, 95.217 at around 18:33, with and without a descent after 18:41. Main issue there seems to be to make the connection between pre and post-19:41 paths (for the “fuel feasible” candidates).
@George G
I agree with you that it is unlikely that the engines shut down at the same time. But right now the fuel model needs to be adjusted such that so that one engine needs to shut down first. That aspect needs further work.
Paper will be ready soon. (Different cultures have different meanings for “soon”, but I hope to post it today.)
@Sid Bennett said: I agree with you that it is unlikely that the engines shut down at the same time.
Actually, if there was a conscious pilot, manually opening the crossfeed valves when the fuel levels were low would ensure that the engines flameout at nearly the same time. This would also maximize the range, if that was the intent.
Note that, assuming no PF, unless both engines shut down within a few milliseconds, there would still be a residual rudder bias following MEFE due to the TAC function, surely causing a turning descent, decreasing in radius as it descended. Of course, a live PF could cause any kind of Post FE path.
@paul smithson
I agree with you that the ACARS data is difficult to align with the ZFW.
We are told that the ZFW was 174,369 kg in the SIR, but there is no evidence like a copy of the fuel log to support the statement.
We are given some of the fuel planning documents in the RMP report, but also not the actual figures from refuelling or fuel log.
The ACARS weight is to the nearest 100 lbs (45.36 kg) and the ACARS TOTFW is to the nearest 100 kg.
The ZFW entry in the cockpit was assumed to be 174.4 MT as only 1 decimal place is allowed.
But what the actual ZFW was, we cannot be sure given the lack of data.
We discussed this issue at length as co-authors and decided the only safe basis was to accept the ACARS TOTFW at 17:06:43 UTC as 43,800 kg ± 50 kg.
This is included in the fuel prediction error budget in Appendix D.
@ALSM
The descent kernal used by the DSTG linked below. You can bet they had a lot more input from Boeing than we ever had. It is one of the reasons I hold on to notion of terminus close to the 7th arc.
https://photos.app.goo.gl/8KsYdjxQcZAJYsTk8
https://www.dropbox.com/s/qrj6nx7xlhf78rz/MH370%20Report-0322920.pdf?dl=0
Here it is. It covers bot too little and too much, but I hope that it will lead to a useful discussion.
“bot” = both
@Sid
Did a first pass. It is an interesting read. You write well.
You did make some misallignments in your text references to figure numbers on pages 11-12, but it did not distract from understanding.
Your terminus agrees quite well with the DSTG terminus.
My assumption is that your cost function would have the same general characteristic if BFO was not used.
I am not qualified to comment on the fuel model you used.
@Ventus45. I think that the expiry of that domain has rendered my old report unobtainable. That is probably a good thing since I no longer subscribe to key aspects of the argument that I made at the time, or the conclusion advocated. In case there is something specific you were looking for, please holler. I don’t mind if Victor shares my email contact with you.
@DennisW
Thank you for reading the paper and for your comments. I will fix the problem if in a future draft.
I would say that it fits well with the IG terminus. If memory serves, we were there first.
You are correct that in the region of interest the cost model is much more sensitive to BTO errors than BFO errors. But, for paths that are not correct, the BFO error sticks out. So, if there are paths where the BTO would give a false result (if there are any) the BFO would be the safety net.
As for the fuel model, it gives similar results as UGIA for a base case. In the general area we are talking about, the variation with azimuth should be slow, and it effectively defines a range from, for example, IGOGU.
(As for the errors in the fig references, practice patent law as a “retirement” job and I tell inventors who point out mistakes that at least it shows that you read the specification I drafted for you 🙂 )
@Sid,thank you for providing your write up.
I am still uncomfortable with your preference for 186T on the basis that:-
1) there is a whole spectrum of paths that are not materially inferior from the point of view of BTO fit. So going for a precise “cost minimum” isn’t compelling if the optimum is quite shallow.
2) the zone around this has already been searched thoroughly.
A few other points:
1) The further one goes from 1822, the greater the uncertainty in time/lat/long introduced by the range of possible speeds and headings before the FMT. By the time you get to ~1839, how do you pick the right combination of lat/long/time to run your path models?
2) I am extremely dubious about the 1822 “last radar”. Firstly, it is completely implausible that there was a singular capture. As I understand it, a radar will normally need to sweep a target more than once before registering it. And why should it disappear again after a single sweep? The position is a good fit for an extrapolation of the LIDO path (never officially acknowledged) but arrives at the first arc about 100 seconds too early – requiring an exquisitely-timed “jink” (having followed N571 without a care in the world up to that point) to cross the arc at the correct time. I’m also intrigued by the fact that the penultimate “military radar” position perfectly matches Butterworth LKP plus 6 cycles @4 seconds (which I gather is the typical target coasting). I guess since Butterworth is a military airbase, they could call that PSR “military radar” even if most pundits take that to mean Western Hill. Even the Butterworth PSR LKP needs to be treated with caution unless the timestamps have been corroborated against other sources to confirm that they are zeroed against UTC.
3) If your model makes an instantaneous turn, you will end up at the turn exit approximately 60s later than turning through an arc to the same position. That kind of difference in “start time” makes a material change to the speed required to fit your path and possibly to the quality of path fit overall.
4) I don’t think it is legitimate to substitute TT for LNAV (or perhaps I misunderstood you?) except for 180 – where the two coincide. Otherwise, the bearing of a great circle path gradually changes, makes a material difference to BTO fit compared to true track.
I came to the conclusion that running paths from 1822 and simply looking for the best fit FMT was a fruitless task. There are just too many variables in the air to be able to pin it down. A “wrong” path solution can start to look right, or right enough, if you fool around sufficiently with a combination of azimuth/speed/start time, not to mention weather at different altitudes.
@paul smithson
RE: “I am puzzled why the ACARS-derived weights vary so much and why – on average – they imply a ZFW that is about 250kg less than the value in table 1.6D.”
In my opinion, the discrepancies you noted are probably caused by the different methods used to derive the weights in the ACARS reports. The gross weight is taken from the FMC, which uses the zero fuel weight entered by the crew during the preflight preparation and the fuel quantity calculated by the FMC. The fuel weight, on the other hand, is the weight reported by the fuel quantity indicating system (FQIS), ie the sensed fuel quantity.
At engine start, the FMC takes a snapshot of the sensed fuel quantity and then uses fuel flow to calculate the fuel quantity remaining. It is very common to see a difference of several hundred kilograms between the sensed and calculated fuel quantities, with the calculated quantity typically lower than the sensed quantity. The gross weight and fuel weight reported by ACARS cannot be used to reliably determine the zero fuel weight.
@Niels,
You asked: “Is it correct that you used the “Holding” Mach / FF values for FL100?”
Sort of. Both the Holding and INOP Holding speed tables we use are from Boeing, and they are in KIAS, not Mach. They are identical in KIAS values.
We also use Boeing FF tables for Holding and INOP Holding. Of course the INOP FF values differ from the Holding FF values.
You also asked: “For the temperature do you use about 16 K above ISA conditions at FL100?”
Figure E-11 shows the Delta SAT from 18:43 to 19:23 is just a bit over +15C.
You said: “If so, one could “gain” some fuel available at 19:41 by descending to for example FL200 (in stead of FL100) and at the same time reach a 19:41 latitude slightly further south (0.6 – 0.7 deg further south).”
This is true, but you could gain more fuel by not descending at all. I will say again that I don’t think any of the maneuvers were driven by saving fuel. If fuel saving was a prime motivator, why fly across Malaysia at MMO? Why fly out the Malacca Strait at LRC? Why descend and then climb back to cruising altitude? Indeed, why fly into the SIO at LRC instead of MRC? Nothing in the MH370 route after the diversion suggests fuel saving was a factor. Instead, avoiding interception, laying a false trail, and then hiding the turn south from radar detection were accomplished.
You also said: “Furthermore, I’m looking at alternative routes, like turning directly towards BEDAX at 216 degrees track, from approx. 7.408, 95.217 at around 18:33, with and without a descent after 18:41. Main issue there seems to be to make the connection between pre and post-19:41 paths (for the “fuel feasible” candidates).”
If a turn was made straight to BEDAX, then you will arrive at the 19:41 position far too early. You must either fly a zig-zag path before then or do a Hold for several tens of minutes.
@paul smithson
Understood, but I would still like to re-read it – if possible.
I am also happy for Victor to give you my email.
Re: ZFW
Several of us were recently studying ZFW offline (Ventus, David and I). We had some minor questions, but decided there was no major discrepancy. I had started to estimate fuel vaporized due to ascent, but did not complete the calc due to the small numbers. But that is now back on my to-do-list in case a smaller number is of interest. Just air pressure would be I think about 700-lbs difference from ground, but I do not know how that is factored into the equations.
@TBill: I would be careful about tinkering with the ZFW. Remember that the fuel factor (FF) corrections are calculated from historical data of fuel consumption, and those calculations include an estimated value of ZFW. Unless there is reason to believe that MH370 had an atypical weight profile (e.g., passengers and baggage were heavier or lighter than other flights), I’d accept the ZFW (and the FF) as correct.
@paul smithson
Please find my comments below. Your questions are helpful.
1) there is a whole spectrum of paths that are not materially inferior from the point of view of BTO fit. So going for a precise “cost minimum” isn’t compelling if the optimum is quite shallow.
**Please propose specific paths, including the BFO. The graph of fig 6 is the rms error of each of the parameters normalized by the expected measurement standard deviation. It is smooth and sharp, especially in the BTO with a LRC fuel model. Not much wiggle room there.**
2) the zone around this has already been searched thoroughly.
**Only within a fixed distance of the arc. Also coverage was not 100%. Completely excluded piloted flight. The same can be said for 180, but with a smaller area covered.**
A few other points:
1) The further one goes from 1822, the greater the uncertainty in time/lat/long introduced by the range of possible speeds and headings before the FMT. By the time you get to ~1839, how do you pick the right combination of lat/long/time to run your path models?
**A large number of simulations were run at regular azimuth and time spacings and the minimum cost for each time interval determined (at whatever azimuth). That led to the results recapitulated in:
https://www.dropbox.com/s/0zv2zivx0asbp47/Sept19Report.pdf?dl=0
starting at para [0020].**
2) I am extremely dubious about the 1822 “last radar”. Firstly, it is completely implausible that there was a singular capture. As I understand it, a radar will normally need to sweep a target more than once before registering it. And why should it disappear again after a single sweep? The position is a good fit for an extrapolation of the LIDO path (never officially acknowledged) but arrives at the first arc about 100 seconds too early – requiring an exquisitely-timed “jink” (having followed N571 without a care in the world up to that point) to cross the arc at the correct time. I’m also intrigued by the fact that the penultimate “military radar” position perfectly matches Butterworth LKP plus 6 cycles @4 seconds (which I gather is the typical target coasting). I guess since Butterworth is a military airbase, they could call that PSR “military radar” even if most pundits take that to mean Western Hill. Even the Butterworth PSR LKP needs to be treated with caution unless the timestamps have been corroborated against other sources to confirm that they are zeroed against UTC.
**The LIDO data have never been acknowledged. By the same token they have never been disowned. They have been ignored. I take this as confirmation. The slide looks like a time lapse replay of data selected for those tracks not having transponder tags. Only the time tag.**
3) If your model makes an instantaneous turn, you will end up at the turn exit approximately 60s later than turning through an arc to the same position. That kind of difference in “start time” makes a material change to the speed required to fit your path and possibly to the quality of path fit overall.
**Some years ago I modeled the turn in detail. It did not meaningfully affect the results. But I needed to reduce the number of data inputs to meet the spreadsheet format.**
4) I don’t think it is legitimate to substitute TT for LNAV (or perhaps I misunderstood you?) except for 180 – where the two coincide. Otherwise, the bearing of a great circle path gradually changes, makes a material difference to BTO fit compared to true track.
**It It would be expected if ISBIX were the last waypoint and should no be excluded as a possibility.It should be explored further**
I came to the conclusion that running paths from 1822 and simply looking for the best fit FMT was a fruitless task. There are just too many variables in the air to be able to pin it down. A “wrong” path solution can start to look right, or right enough, if you fool around sufficiently with a combination of azimuth/speed/start time, not to mention weather at different altitudes.
**My calculations as reported above lead to consistent results. Perhaps it is a question of methodology.**
**Let’s bound the problem. Due to fuel considerations any valid path has a maximum range which differs only slightly if the plane passes through a similar environment. The eyeball length of the 186 path from 18:22 to 00:11 is 2775nm. So go to GE and draw a direct path from the location at 18:22 to the 6th arc. I get:
38°40’3.23″S 85°25’29.10″E
I am sure that it can be done more accurately, but I see that location as the most furthest South possible location.**
It is interseting to observe the evolution of the analytics used to derive an MH370 terminus.
In the early Duncan days, the preferred method seemed to be a trial an error route selection based on minimizing the differences between modeled BTO and BFO and the recorded BTO and BFO data. Sid’s latest paper builds on that theme with a more formal use of a cost function. The fact that he derives a terminus near the early IG terminus is not sursprising.
A major departure was the work of the DSTG using a Bayesian approach. It also produced results similar to Sid’s and the early IG work. I am still struggling with the nuanced differences between Bayesian and frequentist analytics.
Along comes what I call the frequentist probability approach taken by the UGIB group. Their result is a major shift of the terminus to the North based on multiple path evaluations, a highly refined fuel model, and other data including debris drift and debris search observables.
There is a fourth approach not really appreciated by the hard core techies. I would call it the motive based terminus. I tend to lean in that direction. It is based on why the diversion was done, and what choices would be made on that basis. It leads to a terminus even further North than the UGIB conclusion based on the Cocos as a last resort bail out. In the past I also modeled a Christmas Island path with the same underlying attribute.
I have also noticed a shift to the consideration of a possible dive-glide-dive end of flight scenario which was not embraced by the cognoscenti in the past.
What a fun ride. Thank you, Victor.
@Paul Smithson
Continuing on the back of my envelope, I computed the intersection of a rhumb line originating at ISBIX at 185.98 and intersecting the 6th arc at 36deg 24 min 20 sec S and 89 deg, 33 min 47 sec E and found that the position was about 30nm further east on the 6th arc than my base case GCP. In addition the path length is 2210nm and I measured the base GCP case at 186T to be 2230. It would arrive at the 6th arc about 3.7 minutes earlier.
I am sure this can be done better.
@DennisW said: A major departure was the work of the DSTG using a Bayesian approach. It also produced results similar to Sid’s and the early IG work.
Inherent in all three models is the preference for paths with few maneuvers, which leads to a terminus around 37.5S latitude. (The Bayesian model allowed more maneuvers, but the a priori distribution for the number of maneuvers preferred a small number.) If the objective is to find the simplest path that results in BTO and BFO errors within acceptable limits, while ignoring fuel, drift, and aerial search results, we would today arrive at the same terminus as the IG did back in July 2014.
The problem is that terminus is not consistent with the available fuel, nor with the drift model results. I don’t see how that is overcome.
@DennisW said: What a fun ride. Thank you, Victor.
You’re welcome.
Although…the ride is slowing down. Contributors here might have some remaining questions about the report, but I don’t see a lot of new information or new insights surfacing. OI has our recommendations, and maybe the recommendations of others. Other than revisiting the sonar data near our LEP (or near other preferred locations), there is not a lot more to do.
@Sid Bennett
I have read your paper and have the following comments and questions:
1. FMT
You state you chose to terminate the lateral offset at IGOGU and start the FMT at 18:37:45 UTC at a position 7.6001°N 94.5468°E and an altitude of 39,300 feet, about 9.2 NM north east of IGOGU on a bearing of 057°T. The FMT is completed at 18:39:15 UTC, just 10 seconds before the call starting at 18:39:55 UTC. I find that too much of a coincidence.
You state that radar avoidance is not presumed, but at 39,300 feet the FMT is in full view of the Thai Military radar at Phuket and the Indonesian Military radar at Lhokseumawe. How do you explain that radar operators in two countries failed to see MH370 turning south near IGOGU?
2. Incorrect Model Comparison Start Altitude
You start your model comparison of our 180°T route near waypoint BEDAX at 19:22:45 UTC (not 19:22:52 UTC) at an altitude of 39,000 feet.
In our paper, we state, that there was a traverse at FL100 and the climb begins at 19:23:50 UTC after waypoint BEDAX was passed. At 19:22:45 UTC MH370 was at FL100, not 39,000 feet.
3. Incorrect Model Comparison Altitude from 19:41:21 UTC
Your model comparison of our 180°T route uses an altitude of 39,000 feet throughout.
In our paper, we state that the climb ends at 19:41:21 UTC at FL390 or a geometric altitude of 41,207 feet.
4. Incorrect Model Comparison Positions by 22:14 UTC
Your model comparison of our 180°T route states that MH370 position at 22:14 UTC is 17.8042°S 93.7600°E.
In our model, the MH370 position at 22:14 UTC is 17.5728°S 93.7876 °E.
Between 22:14 UTC and 22:24 UTC, your model shows the wind direction from changing from 83.8°T to 272.8°T and effectively reversing.
By 22:14 UTC you are already 0.24° of Latitude out, because you ignored the climb back up to FL390 and you use incorrect wind speed and wind direction calculations.
5. Incorrect Wind Speed and Wind Direction
Your model comparison of our 180°T route calculates the wind speed and direction for the position of MH370 at 22:14 UTC, but using the GDAS data at 00:00 UTC.
There is a significant difference between 22:14 UTC and 00:00 UTC.
There is a huge difference between the timespan from 16:41:43 UTC to 00:19:37 UTC and the timespan from 00:00 UTC to 00:00 UTC. In our model we interpolate the wind speed and direction for the position, altitude and time. You are ignoring the time dimension.
Between 22:14 UTC and 22:24 UTC, your model is out by 1.8 knots of wind speed, out by 48.7°T of wind direction and out by 3.75 minutes in the time of the reverse of the wind direction, because you use GDAS data only at 00:00 UTC.
In your view, what was the wind speed and direction at each minute between 22:17 UTC and 22:25 UTC for the LNAV 180 flight path from BEDAX between 18.0°S 93.787575°E and 19.0°S 93.787575°E?
In your view, did MH370 pass through the eye of the anticyclone slightly to the west (wind from the north giving a tailwind) or slightly to the east (wind from the south giving a headwind) on this flight path?
To say there is a match in your Figure 10 is nonsense. To say we have got the wind direction wrong, when you ignore the time dimension is hypocritical.
You show in your Figure 13 and 14 the Tailwinds from 18:00 UTC to 24:00 UTC for both paths, but these are based on the winds at 00:00 UTC only! Your model positions may be between 18:00 UTC and 24:00 UTC, but the wind is stuck at 00:00 UTC. These Figures are only correct at 00:00 UTC, a bit like an old broken pocket watch will show the correct time twice a day.
6. Incorrect Fuel Calculation
You claim that the fuel surplus is 119 kg as shown in MAIN S16 at 00:11:00 UTC.
In our model the fuel exhaustion is at 00:17:30 UTC (as I already pointed out to you) and not at 00:11:00 UTC.
00:11:00 UTC is the time at which MH370 passes the 6th Arc. This has nothing to do with fuel exhaustion, it is the time of a satellite ping.
Your model of our 180°T route does not account for the fuel required to climb back up to FL390.
In our model we account for the fuel required to climb back to FL390, which is 1,847 kg.
Once again you are trying to compare apples with oranges and flog a dead horse, but I enjoyed your mention of “satellite debris”.
@DrB
Thank you for your reply, and for clarifying.
I agree that nothing points at fuel saving as a prime motivator in choosing the path / maneuvers. The main reason I’m looking at fuel efficient scenarios between 18:30 and 19:41 is to check if there are plausible paths ending in the S35-S36 interval. Plausible in the analytical sense (high sat-data probability x high “fuel” probability). Follow that line and your suggestion:
What would be the 19:41 position and fuel remaining if we assume no descent at all?
“If a turn was made straight to BEDAX, then you will arrive at the 19:41 position far too early. You must either fly a zig-zag path before then or do a Hold for several tens of minutes”.
Yes, I see the issue there.
@Niels,
You asked: “What would be the 19:41 position and fuel remaining if we assume no descent at all?”
The 19:41 position depends on fitting only the 19:41-00:11 satellite data. Therefore, it does not depend at all on the FMT Route, including whether or not a descent occurred between 18:22 and 19:41.
The available fuel for the “no-descent” FMT Route is given in Table D-1. For example, the 19:41 available fuel for Case 5A is 26,397 kg. This assumes the bleed air was on through 19:41. Slightly more fuel is available if one assumes the bleed air was off prior to 19:41, as in Case 7A.
@Richard
You posed a number of questions and I am researching some points, but I posted graphs comparing your Fig. 17 with the results that would have obtained if the spreadsheet had been run at 41000ft starting at your 19:41 geographical location on 180T with LRC. So this is the equivalent of your final leg at high altitude from 19:41 to 00:11, which is common to all of your cases.
As you know I can only select 39000ft or 41000ft. The previous comparison was at 39000ft. In this data set, the rotation of the wind is clockwise, the wind speeds match well, but our temperature is lower than yours, which is the reverse of the previous comparison.
Well, dinner is served….
https://www.dropbox.com/s/7fkv0y00hxjzsmu/wind%20temp%20speed%20at%2041kft%20starting%20at%201941.pdf?dl=0
@Victor, TBill. The issue that Ventus, he and I were looking into was the ACARS gross weight versus fuel consumption discrepancy during the climb that has been discussed recently.
It looked to be of no consequence and Andrew’s explanation has confirmed that. Presumably the FMC calculates from the flow meters (readings as per the EHM report) though a remaining curiosity about that calculated fuel level is that when compared to the actual the difference (allowing for ±50kg for fuel and ±4.5kg for gross weight) is not random or linear but has a reversing trend.
Since the fuel measurement is accurate I can only suppose that the usefulness of the calculated is just an approximate standby.
The SIR ZFW of 174,369 kg is that of the load sheet, passed to the aircraft by ACARS at 16:06:32, as is the loading. That surely would reflect the actual figure from refuelling less a standard estimate for starting and taxying. In this instance this was an over-estimate.
The SIR states the basic weight (the aircraft will have been re-weighed and that recalculated periodically) as being 138,918.7 kg. Subtracting that plus the cargo and passengers-plus-crew combined weight of 31,086 kg from the ZFW, and also the basic weight, leaves 4364.3 kg unaccounted for. In presuming that consists of water, food, trolleys and other paraphernalia (possibly including passengers’ seats) I see no reason to query the ZFW or indeed the fuel load.
Since I take it that the ACARS gross weight is the sum of the ZFW and as-measured fuel remaining and the fuel consumption as measured has a nice linearity during the climb your choice of a fuel datum of 43,800 kg ± 50 kg five minutes past the top of the climb does look the best available.
Even so that does suppose that the consumption over the last five minutes of level flight, accelerating slightly, of between 3900 and 4500 kg/eng/hr is what could be expected though it may be on the high side. That does assume a 50 kg rounding error for the nominal as-measured 700 kg used over that 5 mins, though 100 kg is remotely possible.
@Victor,
You said:
“The problem is that terminus is not consistent with the available fuel, nor with the drift model results. I don’t see how that is overcome.”
The curriculum vitae of the DSTG authors is heavily biased towards math, physics, engineering,… No one on that team was an Andrew Banks or a DrB or a VI. They had to rely on information from Boeing on the fuel range. In affect you are asking us to disregard the manufacturer’s input in deference to your own.
3rd para. Second line. “That surely..” should read, “The fuel listed surely…”
5th para. First line, after ACARS replace “is” with “should be” please.
@DennisW: The DSTG fuel model was over-simplified. It simply limited the speed range to Mach 0.73 to 0.84 (and altitude between 25,000 ft and 43,000 ft). If Boeing provided input, it was only in a very broad sense. I strongly disagree that we are “asking [readers] to disregard the manufacturer’s input in deference to [our] own”.
Here are the relevant sections from “8.3 Assumptions”:
4. Infinite fuel: the fuel constraints on the aircraft can be applied to the pdf afterwards. In the simplest case, maximum reachable ranges could be used to censor impossible trajectories. However, analysis of candidate trajectories has indicated that the majority are feasible. Broad information about the fuel consumption rate of the aircraft has been used to inform the range of allowable Mach numbers.
7. The aircraft air speed is limited to the range Mach 0.73 to 0.84. Fuel consumption becomes very inefficient at speeds higher than this and at lower speeds the aircraft is not able to match the measurements. In practice it is likely that the viable range of speeds is actually much narrower than this.
@Victor
OK. Boeing’s lack of detailed input seems very strange to me.
@Sid Bennett
After having gotten back to your report late last night and finally realising that virtually any candidate path had similar fuel endurance issues and that with a little adjustment your fuel modelling and route would eventually come out virtually the same as for Richard’s, et al, I then realised the following basic matter. It had got so late in the morning that I HAD to go to sleep. So, today:
The Piece of String Analogy:
Refer to your Figures “Fig. 7 186T Path” and “Fig. 9 180T path, etc”.
You have chosen to draw both paths approximately or virtually tangential to a circle (or part of that circle). That enables the simple “Piece of String Analogy”.
Consider a piece of flat paper. One can draw any set of six arbitrary circles on that piece of paper with a common centre. Concentric circles. Let us now only consider five of those circles. For the time being we will remove one of those circles from our analysis. But we will NOT discard the inner circle.
At that inner circle let’s consider a cylinder placed concenctric with the circles and with outer diameter equal to the diameter of the inner circle. Now with one hand (say the left hand) hold a piece of string and with the other pull it tight around part of the cylinder. Note the measurements of the distance from where the string leaves the surface of the cylinder and crosses the outer four circles. Pull the string a little further around the cylinder and repeat the measurements. Notice something ?
In general, a line passing through all five circles and making the same chord-length across the inner circle (which chord-length tends to a minimum as the chord tends outwards towards the tangent) will be geometrically identical to any other similarly generated line.
We may wish to introduce an external reference to our set of circles and the theoretical chord-line. We may wish to draw a line through the common centre of the circles. We may wish to call this line “Equator”. Then we can discrimate between the infinite number of geometrically identical scenarios making the same chord-length across the inner circle. We may choose to use the angle between the chord-line and the “Equator” as the discriminator. We may even choose to call this angle the “Heading”.
Now consider our workpiece or template to be a spherical surface in lieu of a flat piece of paper. The same applies. For example consider someone, be it a little child playing or some supreme being, sitting on a satellite above the Equator, and drawing circles around the point immediately below using a laser pointer. A theoretical plane (a geometric plane, as distinct from an aircraft) passing through five of the circles so drawn will have properties analogous to the previously discussed chord-line.
We live on a not-quite spherical world. Within reason the above approach will also apply to that (this) world.
@Dennis W. You said, “There is a fourth approach not really appreciated by the hardcore techies. I would call it the motive based terminus.”
I agree that there could be merit in further consideration of motive. It seems to me that if you want to hide the wreckage and create a mystery, you must ‘hide’ the 37.5 ‘pinger’ signal and any floating debris. The deep south is a better choice than the Christmas Island region. Conversely, if you have some expectation an acceptable resolution and expect to land, then you don’t fly off to the deep south.
I think that the Malaysian officials did have early knowledge of the situation. Perhaps a note was left that was never published.
It would require solid knowledge of his (assuming ZS) personality and his personal situation to shed any light on his possible motivation. That would require a different skill set. I have been searching if anyone has approached the problem this way, but I can’t find much.
Also, I understand it, for a northerly terminus the analytics break down because the base assumptions (especially unpiloted flight) are likely not valid.
I have even imagined that the situation could have a few ‘twists of plot’. Perhaps somewhere just before the turn south there was a PAX intervention similar to the 9-11 Flt 93 scenario. The PAX took over the plane but no trained pilot was left. They could not even operate the radios but perhaps turned the plane around and wandered around the sky until the fuel ran out. Wild – but who knows?
I find it difficult to accept that ZS would commit suicide in this manner if his motivation was personal. If the motivation was political, then he failed totally. Perhaps he had put in place a means to make public his position and this feel apart.
In any case, as a frequent and interested reader, I greatly appreciate the effort and thought that has been given by the contributors to this blog. There are some very smart and capable people out there.
@Shadynuk
You stated “Perhaps a note was left that was never published.”
Following @DennisW’s philosophical exegesis on classical, Bayesian, likelihood and information criterion statistics, he concludes that our analysis has been frequentist and he promotes the consideration of the motive.
You agree that there could be merit in further consideration of motive. You point out that “it would require solid knowledge of his (assuming ZS) personality and his personal situation to shed any light on his possible motivation. That would require a different skill set. I have been searching if anyone has approached the problem this way, but I can’t find much.”
Sabine Lechtenfeld (@littlefoot), who is a criminal psychologist, has spent some time considering the psychological profile of ZS. I had the privilege to spend a weekend with Sabine going through the psychological profile of ZS. Another contributor to JW called Matt had also analysed all the online contributions from ZS and summarises his findings in a comment dated 16th September 2014.
ZS quoted a poem entitled “The Soldier” from “The Pilgrim and Other Poems” by Sophie Jewett dated 1896. The original text is headed with a quote in Italian from “The Divine Comedy” by Dante, taken from Paradise XXIX 91 “Non vi si pensa quanto sangue costa.” (You don’t think about how much blood it costs).
Here is the full text posted by ZS. The capitalisation is by ZS.
”The SOLDIER FOUGHT HIS BATTLE SILENTLY.
Not his the strife that stays for set of sun;
It seemed this warfare never might be done;
Through glaring day and blinding night fought he.
There came no hand to help, no eye to see;
No herald’s voice proclaimed the fight begun;
No trumpet, when the bitter field was won,
Sounded abroad the soldier’s victory.
As if the struggle had been light, he went,
Gladly, life’s common road a little space;
Nor any knew how his heart’s blood was spent;
Yet there were some who after testified
They saw a glory grow upon his face;
And all men praised the soldier when he died.”
Both Sabine and Matt conclude that ZS is identifying himself with the SOLDIER.
ZS had several Facebook accounts and Matt further points out that before and just after the Malaysian General Elections in May 2013, he was averaging 14 post per day and then suddenly stopped. Sabine notes that he may have moved from posting to planning.
Other sample posts by ZS shed further light:
“There is a rebel in each and everyone of us.. let it out! don’t waste your life on mundane life style. When is it enough?”
“General Elections 2013 are over, so its time they try to dismantle us. We are not going to be quiet.”
“If you are neutral in situations of injustice, you have chosen the side of the oppressor. – Desmond Tutu”
Matt explains in responding to Sabine, that he plucked the quotes directly from ZS’s rabid period of facebook posting (prior to the elections, and shortly thereafter). Then, after averaging approximately 14 posts a day over a period of 5-6 months, we have almost complete cessation of any posting whatsoever. He states that he points this out, because he feels and as Sabine correctly observes, that the cumulative effect of everything is beyond compelling, and points squarely to his culpability.
Sabine concludes that Matt’s observation that ZS went from frequent ravings to a total silence after the ‘stolen’ elections could be interpreted as a sign of an inner emigration. Maybe ZS became very busy with something else, like hatching a plan how he could use his aircraft against the political establishment.
Perhaps the “The soldier fought his battle silently” was the note, that was left.
@Richard. Thank you for that.
@Richard
@Sid
Richard said “In our model we account for the fuel required to climb back to FL390, which is 1,847 kg.”
>If we accept the 180 South flight path start, which I do, the key characteristic is that the aircraft shows up 2-3 degrees north of ISBIX at 19:41 for its appointment with Arc2.
The current team report essentially takes the most direct path to 19:41, which requires a descent down to FL100 to account for loiter time needed to make sure MH370 does not get to 19:41 too soon.
There is a hypothetical “non-descent” alternative to 19:41, where the pilot stays at altitude but does more distance to take up the loiter time.
What I would ask is, what is the fuel requirement for the non-descent alternative, and then that might bracket the range of possible fuel at 19:41.
@Richard,
I had many lengthy email conversations with Sabine.
At the end of the day I suppose I am also a techie i.e. a concert violist neighbor lady at our coast place refers to me as a propeller head. I had little useful to suggest to Sabine.
@TBill
You asked “what is the fuel requirement for the non-descent alternative?”
Bobby answered the same question from Niels above, please see the following link:
https://mh370.radiantphysics.com/2020/03/09/new-report-released-for-mh370-search/#comment-27611
@ George
Thank you for reading the paper and commenting.
You said:
“You have chosen to draw both paths approximately or virtually tangential to a circle (or part of that circle). That enables the simple ‘Piece of String Analogy’”.
I didn’t “choose to draw the paths that way for the 186T solution. That is the computed path from 18:22. The same cannot be said for the 180T solution where a start time of 19:22 is presumed, or for 19:41 where the final leg is asserted to start.
The IG has used the second arc as roughly the closest approach to the satellite of a simple path.
In my response yesterday to @Paul Smithson, I suggested that a conceptual boundary on allowable paths is defined (from at known position at 18:22) by estimating the maximum total path length to 00:11 under LRC or max endurance M, and drawing a circle of that diameter in GE, and a representation of the 6th arc. That defines the furthest South intersection.
I wonder if some other geometrical limit could be derived to further limit the domain of paths?
Once I have completed my response to Richard’s questions I am willing to use the spreadsheet tool to explore other paths (high altitude). I can’t do all of them, and prefer paths that have been documented by a paper that has been posted somewhere. Seems to me that I have weeks of time to devote to this.
@Sid Bennett
Your recent paper includes a Cost Function based on the BTORs, a standard deviation BTO of 30 µs, BFORs, a standard deviation BFO of 2 Hz (except for CU6, where the standard deviation BFO is 1.5 Hz).
You show the general equation:
Cost function = sum((BFO_pred – BFO_obs)/BFO_sd)^2 + sum((BTO_pred – BTO_obs)/BTO_sd)^2
In our paper we use an Objective Function based on 9 statistics for LNAV and 11 statistics for other navigation modes:
1. Mean BTOR (sample mean = μs = 0.0 μs, sample standard deviation = σs = 12.97 μs, N = 5 samples)
2. STDEV BTOR (μs = 29.3 μs, σs = 9.90 μs, N = 5 samples)
3. 1-Hour BFOR Deviation (μs = 2.19 Hz, σs = 0.90 Hz, N = 4 sample pairs)
4. Pearson’s correlation coefficient r for Leg Start BTOR to Leg End BTOR (μs = -0.237, σs = 0.447, N = 4 sample pairs)
5. r for Leg Start BFOR to Leg End BFOR (μs = -0.237, σs = 0.447, N = 4 sample pairs)
6. r for BTOR to Time (μs =0, σs =0.50, N=5 sample pairs)
7. r for BTOR to Along-Track Position Error (μs = 0, σs = 0.50, N = 5 sample pairs)
8. r for BFOR to Time (μs =0, σs =0.50, N=5 sample pairs)
9. r for BTOR to BFOR (μs =0, σs =0.50, N=5 sample pairs)
10. r for BTOR to Cross-Track Position Error (μs = 0, σs = 0.50, N =5 sample pairs)
11. r for Along-Track Position Error to Cross-Track Position Error (μs = = 0, σs = 0.50, N =5 sample pairs).
In these lists, the subscript “s” denotes “sample” statistical values, as opposed to “population” values. The sample standard deviations are always expected to be smaller than the population standard deviations. Generally speaking, there are 5 samples in the 5 handshakes from 19:41 to 00:11. In the two cases of autocorrelation (i.e., items 4 and 5 in the list above) there are 4 pairs of samples. We denote the expected values by “mu” (μ) and the standard deviations by “sigma” (σ). BFOR is the BFO residual (= predicted minus measured), and the BTOR is the similarly defined BTO residual.
We further consider the composite probability of these 11 statistics together with fuel, debris and aerial search results in order to find the overall result.
I find your cost function unable to fully discriminate between candidate flight routes and is essentially, what many of us were doing back in 2014.
Can you please explain, why the BFO cost function, at start times equal to or prior to 18:40, does not reference the CU6 BFO standard deviation for the BFO during the call in the PARAM table at B144 for the calculation at MAIN F4, F5, F6 and F7 and references PARAM B143 instead?
CORRECTION
“2. STDEV BTOR (μs = 29.3 μs, σs = 9.90 μs, N = 5 samples)”
should read
“2. STDEV BTOR (μs = 27.3 μs, σs = 9.90 μs, N = 5 samples)”.
The “population” standard deviation is 29 microseconds. That is found using a large number of samples.
The “sample” standard deviation, using only the five BTOs, is 27.3 microseconds. It is smaller because of the limited number of samples used. The sample standard deviation will always be smaller than the population standard deviation.
Richard said:
“I have read your paper and have the following comments and questions:
[Responses in brackets]
1. FMT
You state you chose to terminate the lateral offset at IGOGU and start the FMT at 18:37:45 UTC at a position 7.6001°N 94.5468°E and an altitude of 39,300 feet, about 9.2 NM north east of IGOGU on a bearing of 057°T. The FMT is completed at 18:39:15 UTC, just 10 seconds before the call starting at 18:39:55 UTC. I find that too much of a coincidence.
[You are right, I can put in a S-shaped return to 295T a little earlier and then begin the turn. Since the simulations are no being compared using a LRC fuel model, it is easier for me to put in the turn details and I will do so. Both models presume a turn at IGOGU and the path is merely being adjusted to conform to that presumption. But, in addition UGIA assumes that the turn which happens essentially coincident with the phone call was not observed, but that the BFO is consistent with a descent. There is no evidence for this.]
You state that radar avoidance is not presumed, but at 39,300 feet the FMT is in full view of the Thai Military radar at Phuket and the Indonesian Military radar at Lhokseumawe. How do you explain that radar operators in two countries failed to see MH370 turning south near IGOGU?
[In return I ask why the same radars did not detect the aircraft prior to 18:22 over the Strait of Molucca? There no doubt exists ELINT data that would reveal whether the radars were emitting, but we are unlikely to gain access to it. Even so, the radar display may not have been monitored etc.]
2. Incorrect Model Comparison Start Altitude
You start your model comparison of our 180°T route near waypoint BEDAX at 19:22:45 UTC (not 19:22:52 UTC) at an altitude of 39,000 feet.
In our paper, we state, that there was a traverse at FL100 and the climb begins at 19:23:50 UTC after waypoint BEDAX was passed. At 19:22:45 UTC MH370 was at FL100, not 39,000 feet.
[So as to provide an exact comparison I did the final leg weather comparison starting at your location at 19:41 and LRC and 41000ft. As you know I cannot interpolate between 39000ft and 41000 in the spreadsheet, but the wind and direction data seems reasonable. Note the change in direction of rotation. The temperature is lower than your model at 40000ft, but it is slightly higher at 39000 feet, bracketing the result.
https://www.dropbox.com/s/7fkv0y00hxjzsmu/wind%20temp%20speed%20at%2041kft%20starting%20at%201941.pdf?dl=0 ]
3. Incorrect Model Comparison Altitude from 19:41:21 UTC
Your model comparison of our 180°T route uses an altitude of 39,000 feet throughout.
In our paper, we state that the climb ends at 19:41:21 UTC at FL390 or a geometric altitude of 41,207 feet.
[That may be true, but since you can run your model at 39000ft, you can let us know if there is a significant difference.]
4. Incorrect Model Comparison Positions by 22:14 UTC
Your model comparison of our 180°T route states that MH370 position at 22:14 UTC is 17.8042°S 93.7600°E.
In our model, the MH370 position at 22:14 UTC is 17.5728°S 93.7876 °E.
Between 22:14 UTC and 22:24 UTC, your model shows the wind direction from changing from 83.8°T to 272.8°T and effectively reversing.
[You have previously mentioned that the wind direction was not very relevant at that time due to the low wind velocity.]
By 22:14 UTC you are already 0.24° of Latitude out, because you ignored the climb back up to FL390 and you use incorrect wind speed and wind direction calculations.
[You are correct, my vaunted staff have let me down. I used the spread sheet starting at 19:22 instead of the spread sheet starting at your stated 19:41 position. I will correct this in my next release.]
5. Incorrect Wind Speed and Wind Direction
Your model comparison of our 180°T route calculates the wind speed and direction for the position of MH370 at 22:14 UTC, but using the GDAS data at 00:00 UTC.
There is a significant difference between 22:14 UTC and 00:00 UTC.
There is a huge difference between the timespan from 16:41:43 UTC to 00:19:37 UTC and the timespan from 00:00 UTC to 00:00 UTC. In our model we interpolate the wind speed and direction for the position, altitude and time. You are ignoring the time dimension.
[I admire what you have done with the data, but when you compare the wind speed and direction between the two models, there is little difference, except for the transition, which I maintain extremely odd in your plot.]
Between 22:14 UTC and 22:24 UTC, your model is out by 1.8 knots of wind speed, out by 48.7°T of wind direction and out by 3.75 minutes in the time of the reverse of the wind direction, because you use GDAS data only at 00:00 UTC.]
[From the point of view of its effect on the along path wind component, which is what counts, it is minimal. Can you post your along-path winds from 19:41?]
In your view, what was the wind speed and direction at each minute between 22:17 UTC and 22:25 UTC for the LNAV 180 flight path from BEDAX between 18.0°S 93.787575°E and 19.0°S 93.787575°E?In your view, did MH370 pass through the eye of the anticyclone slightly to the west (wind from the north giving a tailwind) or slightly to the east (wind from the south giving a headwind) on this flight path?’
[See new comparison]
To say there is a match in your Figure 10 is nonsense. To say we have got the wind direction wrong, when you ignore the time dimension is hypocritical.
[See new comparison]
You show in your Figure 13 and 14 the Tailwinds from 18:00 UTC to 24:00 UTC for both paths, but these are based on the winds at 00:00 UTC only! Your model positions may be between 18:00 UTC and 24:00 UTC, but the wind is stuck at 00:00 UTC. These Figures are only correct at 00:00 UTC, a bit like an old broken pocket watch will show the correct time twice a day.
[The winds at a same UT are not the same from day-to-day.]
6. Incorrect Fuel Calculation
You claim that the fuel surplus is 119 kg as shown in MAIN S16 at 00:11:00 UTC.
In our model the fuel exhaustion is at 00:17:30 UTC (as I already pointed out to you) and not at 00:11:00 UTC.
00:11:00 UTC is the time at which MH370 passes the 6th Arc. This has nothing to do with fuel exhaustion, it is the time of a satellite ping.
Your model of our 180°T route does not account for the fuel required to climb back up to FL390.
[Does not need to if we start the last leg at 19:41. My chastised staff will rectify.]
In our model we account for the fuel required to climb back to FL390, which is 1,847 kg.
Once again you are trying to compare apples with oranges and flog a dead horse, but I enjoyed your mention of “satellite debris”.
[Glad to inject some humor at a time like this. The horse laughed too.]
@Sid Bennett: We are not getting anywhere in this last exchange.
We believe the 186°T path should be rejected because of fuel shortage and because debris would take too long to reach East Africa. Let’s concentrate on the fuel shortage.
Let’s analyze the leg that starts with the established track of 186°T. What is the time, position, flight level, speed mode, and fuel quantity at this time? And what is the average temperature and tailwind from that time until 00:19? From these quantities, we can begin to compare fuel models.
@VI: “We believe the 186°T path should be rejected because of fuel shortage and because debris would take too long to reach East Africa.”
And almost certainly debris would have been recovered on Australia shoreline.
@VictorI
I did not start this debate over nits. But for the readers of this blog, I cannot ignore the challenges to the conclusions in my paper. I do not wish to abandon the IG original position as to the 6th arc intersection.
I would prefer to address the fuel issue. It has the most definitive quantitative data of the two issues.
Let me collect the data for the path outlined in the paper. It should begin at IGOGU (within 5 nm or so).
@Sid Bennett
You are missing the point about radar capture at the FMT.
As we explained in our paper, radar capture was intended as a ploy, whilst MH370 was heading North-West.
Radar capture occurred over the Malacca Strait as intended.
The PIC wanted to hide the FMT and that is why there was a descent to 10,000 feet, out of radar range.
With your flight path, the FMT was in full view of the radar. So please answer my question, instead of trying to avoid it!
With our flight path the FMT was hidden from radar.
@Richard
If I accept your premise that the perp intentionally wanted to deceive so that the apparent path on N571 would be considered to have continued past IGOGU, then I might be bound to accept your conclusion. There is no evidence that the perp intended such a deception.
The plane remained in radar coverage of Malaysian radar till about 18:22, which is approximately the geometrical range of the radar. But, before 18:22 there was no reported detection of the plane by either Thai or Indonesian radar. Whatever the intent of the perp, there is no evidence after 18:22 either.
The only evidence we have is the Inmarsat data.
Let us consider the hypothesis that the plane continued at high altitude to IGOGU and made the turn South and was detected by radar. (The feasibility of the plane being intercepted was studied by others and discounted) It would remain in view for a short time. Let us further assume that the radar track was well established, despite being at maximum range and flying tangential to the radar coverage and that an estimate of the azimuth of the plane was obtained +/- some number of degrees. Let us further assume that it was 186T.
The perp was UNAWARE of the Inmarsat communications activities. He/she would believe that the duration of the flight after the turn would not be known to anyone.
Now plan the search. Starting with the possibility that the plane crashed shortly after leaving radar coverage and extending to the predicted range for some unknown fuel strategy, a steadily widening pie shaped search area would be needed.
My guess is that no one would have tried.
Then the wreckage washed up in the western SIO and numerous drift studies were conducted assuming starting points ALONG a 186T path to the South. Wow!!
@Sid Bennett
@Richard
@DrB
Sid, You said:
QUOTE: I didn’t “choose to draw the paths that way for the 186T solution. That is the computed path from 18:22. The same cannot be said for the 180T solution where a start time of 19:22 is presumed, or for 19:41 where the final leg is asserted to start. END Quote.
That is a perfect introduction to that which I had next intended to write and post as part of a multi step process.
The first step was the Piece of String Analogy, the next step is re-enforcement of the distinction between Stages 3 and 4 of the flight. This will be followed by acknowledgement that the Piece of String Analogy is a simplistic basis, but upon which refinements for the real life environment can be applied. If you wish, the radii of the circles, or more distinctly the differences between individual radii, can be visualised as in the time domain, as they are only defined by the time at which the circles were generated. The final step of the series will be return to the subject of fuel consumption and the consequent limits applicable to candidate paths for Stage 4.
The Stages:
On October 17, 2019 at 4:59 am (Comment-25629) I wrote:
“The last flight of 9M-MRO as MH370 may be broken down into stages:”
which included:
“Stage 3: Flight from the region of Penang in a generally west-north-west direction ‘up’ the Strait of Malacca until finally making a turn to a generally southward direction;”
and
“Stage 4: Southward flight until fuel extinction;”
Stage 4 is defined by the information available from satellite communication “metadata”. For the analysis here-in it is ALSO DEFINED by the indications that the flight path from “Pings” or “Arcs” 2 through 6 was a flight with no deliberate course changes or manoeuvres. [As for the Piece of String analogy, “we will remove one of those circles from our analysis” and “we” have chosen to remove “Arc 7”.]
Stage 4 stands alone.
Stage 4 can only be described by (analysed by) use of the satellite data and analysis of the effects of the ambient conditions of pressure, temperature and wind direction upon the progress of the flight along any particular candidate flight path. [Analysis of the satellite data is complex and includes allowances for known variations in satellite position.]
Discrimination between, and elimination of, candidate flight paths may be due to any range of reasons, especially fuel endurance.
This is the ONLY reason that I (me, GRG) can think of that of might be dependent upon what happened during Stage 3 of the flight.
Stage 4, to some extent defines the limits to possibilities for what happened during Stage 3 of the flight.
For example: All hypothetical considerations of the flight prior to Stage 4 which do not result in the aircraft arriving at some point “on Arc 2” at the time of “Arc 2” may be removed from the list of possibilities. Similarly, all hypothetical considerations which do not allow sufficient remaining fuel (FOB) at the start of Stage 4 for the aircraft to reach “Arc 6” may be removed from the list of possibilities. And this is an approach taken by the authors of “The Final Resting Place”.
Stage 3 of the flight DOES NOT define any details concerning Stage 4 other than placing some basic limits on the list of realistic possibilities for Stage 4, as indicated above concerning fuel endurance.
Stage 4 – Start Time:
19:41:03
– The recorded Log-On time in accordance with Inmarsat SATCOM recorded data. Reference: Appendix A of ATSB AE-2014-054_MH370-Definition of Underwater Search Areas_3Dec2015.
Review of “The Final Resting Place” indicates that it is clear that this time (19:41:03 UTC March 7th 2014) was used during the route fitting calculations. Figure 4 of that report is the first mention, and Section 5.1, “Method for the Flight Path Analysis between 19:41:03 and 00:11:00 UTC” makes it abundantly clear.
In the Tables of Appendix D of that report, concerning Fuel Probability, or the balance between fuel available at the end of Stage 3 and that required to complete Stage 4, the time of “19:41:21” has been used. This timing is explained in the following sentence part extracted from Section D.2 of the report: “Our FMT Route includes the following manoeuvres:” the eighth and last of which is: “a climb from FL100 to FL390, reaching the Top of Climb at 19:41:21.”
It would seem that this hypothetical Top-of-Climb has been used during fuel usage analysis to separate Stage 3 and Stage 4, and certainly has been for the example fuel calculations as tabled in Appendix C.
The effect of 18 seconds difference in timing equates to around 31 kg difference in fuel estimates, which, of course, is minor.
However, 19:41:03 should be declared as Stage 4 Start Time.
Re-enforcement of the distinction between Stages 3 and 4 of the flight:
As above: Stage 4 is defined from satellite data and consideration of there being no deliberate course change during Stage 4.
Stage 3 need not be rigorously defined, other than the flight at Stage 3 should end up at Arc 2 with sufficient fuel to complete any specific Stage 4 candidate.
And it is accepted that a minimum of three turns may be necessary, one to match, or explain, the 18:40 phone call BFOs and the others to align with the specific Stage 4 candidate under consideration.
Clarification, typo correction:
Fuel availability, affecting subsequent fuel endurance, is the ONLY reason that I can think of that might be dependent upon what happened during Stage 3 of the flight.
@Richard. You said, ‘Perhaps the “The soldier fought his battle silently” was the note, that was left.’
Your post is a powerful statement but I think Matt’s post needs verification all the same.
Under are some subsequent exchanges to his post. Apparently these quotes had not been heard of before, or, so far as I know, since.
He is quite forcefully convinced but did “@littlefoot”, Sabine Lechtenfeld, ever confirm the provenance of his attributions?
https://www.dropbox.com/s/d9wgj5fxq0xag8q/Zaharie%20posts.%20For%20Richard%20Godfrey..docx?dl=0
@Richard. …and did she establish their context do you know, including those than around the elections, eg that of the poem?
@Sid Bennett
You state “The only evidence we have is the Inmarsat data.”
That statement is not true and worse, it brings bad news.
The bad news is: You cannot find an unique flight path from the Inmarsat data alone.
The good news is: In addition to the Inmarsat data, we have a long list of evidence.
– Aircraft performance data from Boeing (how it was designed, tested and operated).
– 9M-MRO engineering data from ATSB (how the MH370 aircraft actually performed).
– Fuel data from ACARS and MAS records (fuel on board, PDA, individual engine fuel rates).
– Fuel exhaustion time from ATSB and Boeing Simulator (00:17:30 UTC ± 20 seconds).
– Weather data en-route from GDAS (SAT, TAT, Wind Speed and Direction).
– Floating debris items from Africa and nearby islands (28 items of aircraft debris).
– Physical evidence from debris analysis (confirmed MH370 serial numbers).
– No floating debris found in Australia (except one MAS towelette).
– Debris from aircraft interior (seat back mounting, floor panel, wall panel).
– No aerial search finds from AMSA (despite large floating debris field).
– Radar data from 5 different radar stations (range and bearing).
– Radar data from Beijing Lido presentation to NOK (unofficial but not disowned).
The Inmarsat data allows several other conclusions:
– The BTO noise is random and uncorrelated with all other parameters.
– The BTO and BFO reading errors are uncorrelated with themselves and with each other.
– The BTORs are uncorrelated with the Along-Track Position Errors.
– The BFORs are uncorrelated with the BTORs.
– The BTO and BFO after 19:41 UTC indicate an automated flight path.
You state “I do not wish to abandon the IG original position as to the 6th arc intersection.”
It appears that you are stuck in a rut, since 2014.
It is also a capital mistake to theorise before one has all the data. In 2014, we did not have all the data.
You state “Starting with the possibility that the plane crashed shortly after leaving radar coverage and extending to the predicted range for some unknown fuel strategy, a steadily widening pie shaped search area would be needed.”
There is evidence that the aircraft continued until at least 00:19:37 UTC and did not crash shortly after leaving radar coverage.
There is evidence that the fuel strategy was the long range cruise (LRC) mode, which is a standard option for the Boeing 777 and not some unknown fuel strategy.
You state “As for the fuel model, I contend that the difference between my calculation and one which DrB would have made for the same route is minimal.”
You further state “As for the fuel model, it gives similar results as UGIA for a base case.”
This is not true and we have shown your fuel estimate is unacceptable, both using your own model and ours.
In ignoring certain data like the fuel differences, you are twisting facts to suit your theory, instead of trying to twist your theory to suit facts.
@Richard said: we have shown [@Sid Bennett’s] fuel estimate is unacceptable, both using [Sid’s] own model and ours.
This is the fundamental issue I wish we would address.
If we have confidence in the accuracy of the fuel model, and Sid’s path results in a fuel shortage well outside of the expected error of the model, the other points are moot. We arrived at that conclusion many months ago, but somehow Sid believes otherwise. If the speed is LRC, there should not be a dispute about endurance, as the fuel flows are tabulated, and we have established correction factors for ISA temperature offsets and fuel flow factors.
@David
You ask whether Sabine verified the ZS Facebook posts?
Sabine confirmed the ZS Facebook posts at the time and I have confirmed them more recently.
I have archived the entire ZS Facebook public site, his private Facebook site is not available, of course.
The “Dante” and “Soldier” quote came from a friend Art Harun at “The Malaysian Insider”:
https://www.dropbox.com/s/iowrkfkhnahb7it/ZS%20Dante%20Quote.png?dl=0
Later ZS quoted it of himself.
The “Desmond Tutu” came from a Malaysian General Election 2013 campaign poster:
https://www.dropbox.com/s/l2t3xwakpdbnebt/ZS%20Desmond%20Tutu%20Quote.png?dl=0
The General Election 2013 quote came from ZS (the reference to Pru 13 is simply the Malaysian abbreviation for the General Elections 2013 – Pilihan Raya Umum 2013):
https://www.dropbox.com/s/zopubdycofhi2t9/ZS%20General%20Elections%202013%20Quote.png?dl=0
The “Rebel” quote was the same day as the previous quote:
https://www.dropbox.com/s/uedpk4q8a1g2pa6/ZS%20Rebel%20Quote.png?dl=0
The ZS Facebook pages are subject of 65 pages in the RMP report and you will find he looked 6 times at the “Book of Quotes” and also at another Facebook page offering quotes entitled “Inspiration at its finest”.
ZS often quoted “The Malaysian Insider”. On 25th February 2016, The Malaysian Insider was blocked by the country’s Internet regulatory body, Malaysian Communications and Multimedia Commission (MCMC) on the grounds of national security following continuous publication of defamatory content.
The RMP report on the various ZS Facebook accounts focuses on his 116 views of Jasmin Lan, a freelance model with the JRo Modelling Agency and plays down his political activity and fight against corruption in Malaysia, which dominates his posting.
Several other commenters apart from Matt and Sabine analysed the ZS Facebook accounts, including @sipadan at airliners.net on 2nd July 2014 20:38, @tailskid at airliners.net on 6th March 2015 and @spencer on JW on 6th March 2015.
Sabine firmly believes that ZS had demonstrated signs of a serious midlife crisis and unravelling for a while. Especially his infamous poem about the anonymous soldier, who dies with a smile on his face – knowing that the people will thank him for what he did, is a very red flag in her view.
Sabine believes that ZS was steering towards some kind of action, because he was so frustrated with the Malaysian regime back then. Many of his Facebook entries show that he was far from the social minded mature and psychologically well balanced family man for quite a while. The interesting thing is, that after a time of frequent raving and rambling on his Facebook page, he suddenly went totally quiet and had only a few bland entries. She takes it as a sign that he was planning something very specific and that therefore his urge to be active on social media had ceased. He was busy with something else. A forensic psychologist will always look for significant behavioural changes of a suspect.
For me, ZS’s daughter sums it up, when she says “He wasn’t the father I knew. He was lost and disturbed”.
@Victor,
You said:
“If we have confidence in the accuracy of the fuel model, and Sid’s path results in a fuel shortage well outside of the expected error of the model, the other points are moot. We arrived at that conclusion many months ago, but somehow Sid believes otherwise. If the speed is LRC, there should not be a dispute about endurance, as the fuel flows are tabulated, and we have established correction factors for ISA temperature offsets and fuel flow factors.”
I still struggle with the fuel model issue. Not because I have made an attempt to generate a model. I have not. The DSTG book shows several examples of Boeing input. Chief among them is the descent kernal shown in Figure 10.9 and the fuel range. None of the DSTG authors could have possibly generated the descent kernal or modeled the fuel range. The evidence of Boeing input is overwhelming IMO. The DSTG would not have published their book with a terminal location beyond the fuel range.
Boeing has a whole floor full of lawyers. While they effectively muzzled any employee feedback outside of formal channels, it is very hard to believe that Boeing would sit back and allow the ATSB to spend millions of dollars searching an area that was beyond the fuel range. It would be a horrendous corporate embarrassment. Simply said, Boeing has skin in the game, and they would not allow that to happen. The other possibility is that Boeing estimated the fuel range incorrectly. I don’t put a lot of weight in that conclusion.
@Richard
Thank you for the above.
However I am thinking (presumably due to family pressure) the daughter later said she was misquoted and denied she said that. Personally, I tend to believe her first version as you stated above.
@DennisW: I have no doubt that Boeing formally responded to specific questions in an accurate manner so that it would difficult to accuse it of not fully cooperating.
But that doesn’t mean Boeing was intimately involved in all aspects of the work that DSTG performed. For instance, it is not hard to prove that the “infinite fuel, bounded speed” model employed by the DSTG is not adequate for predicting fuel exhaustion.
And Boeing range calculations were performed using standard temperatures, which will definitely introduce fuel flow and TAS errors. Why winds were included but not temperature offsets is a mystery.
We are fortunate that the preferred reconstructed paths use LRC speed mode, as the fuel flows were tabulated for this speed mode by Boeing. What then remains is the fuel flow correction for PDA, which know is 1.5% average for both engines, and the correction for deviation from standard temperatures, which we also know by reference to a footnote from Boeing.
This means we should be able to predict the endurance for LRC speeds with a high degree of accuracy using data supplied by Boeing for this airframe.
@Victor, DennisW,
It is possible that Boeing’s input to DSTG models was less extensive, while their inputs to ATSB “in parallel” with DSTG models was fuller.
Definition of underwater search areas Dec.3 2015 pp16-17 provides some information on the inputs from Boeing and concludes by saying: “The performance calculations gave a maximum range that was consistent with the DST Group PDF. These two sets of results were obtained independently and it is significant that they were in general agreement.”
It is true that use of temperatures was not specifically mentioned in the bullet point list. But does that omission prove that Boeing’s modelling excluded temperatures but included wind? I don’t think it does, and it would be a pretty odd thing for them to do.
“Boeing provided a southerly range limit for the aircraft using the following assumptions:
• realistic speeds and altitudes were used throughout the radar section of the flight to give a
conservative fuel load at the final radar location at 18:22
• the turn south was modelled at 18:28 – this is the earliest that the turn could be achieved
based on the analysis of the satellite data and also provides the maximum southerly range
• constant altitude from 18:28 to the end of the flight
• arc crossing times and locations must be met
• historic engine efficiency values were used
• wind was modelled throughout the flight
• maximum range cruise (MRC) cost index (0) was used.
Speed/altitude considerations
Boeing analysed the aircraft performance for various scenarios ranging from MRC to maximum cruise thrust limit (MCRT). The starting time for the analysis was at 18:28 and the end time was the flame-out at 00:17 (i.e. 2 minutes prior to the 7th arc). This gave a time interval of 5.8 hours. The Boeing analysis gave a series of ranges and time intervals for different cruise altitudes. It was noted that a constant altitude of FL350 or higher gave sufficient range to reach the region on the arc corresponding to the DST Group analysis. Applying the assumption that a series of stepclimbs had been performed during cruise, produced a range greater than that required to reach the region of interest on the arc.”
@Victor
I am working at assembling the information that you requested, some of which I have posted as graphs recently. But I am a little confused as to the starting point for comparison. If I start at IGOGU at 186T (I will consider the exact time but nominally 18:49), is that the route you will compute?
So that I can follow along, from where do you apply the PDA=1.5? and what is the FOB?
@Richard
I am attending to Victor’s request (among other things)and would rather debate the weight of the various pieces of evidence later. I apologize for putting it off, but Victor’s issue is more determinative.
@Victor. I see that constant TAS (implying no ISA delta) was the assumption for the range of path reconstructions described in Flight Path Analysis Update 8 October 2014 p9/15. However, if they were constant TAS, they cannot have been MRC path models, can they? What I understand ATSB to be saying is:
1) We did our path modelling using constant TAS at different altitudes including wind vectors to obtain paths that intersected arcs at the relevant times.
2) Boeing gave us an MRC range extended from a) earliest turn soon after 1828 b) later turn after 1840. They don’t tell us in this 2014 doc in any further detail the assumptions or methods used by Boeing. But from the description, it could be as simple as range boundary from 1828 and another from 1840.
So perhaps Boeing provided a simplifed maximum boundary using MRC initially, and fuller inputs for the 2015 report a year later?
@paul smithson: The most detailed description of the Boeing fuel and range calculations was a report prepared by Boeing in March 2014 and presented in Appendix 1.6 of the SIR. If you haven’t read it, please do. The list of assumptions for the modeling includes Standard day atmosphere. So, the ATSB report you cite is indeed silent on temperature, but the Boeing report says standard temperatures were used.
@paul smithson: Looking at Figure 1.3 from Appendix 1.6, which of the four (orange) routes at FL400 do you believe demonstrates there was sufficient fuel to reach 38S latitude?
@Sid Bennett: Start anywhere and anytime you want. To keep things simple, I’d like to do an LRC fuel calculation with temperature and starting fuel as input. The PDA applies for the entire flight. I’m trying to understand the basis of your claim that there was enough fuel to reach 37.5S latitude by going back to the basics.
The definition of performance limits in June 2014 “Definition of Underwater Search Areas” Fig.20 p22 looks to be virtually identical to that in subsequent reports. In this case, the assumptions set out on the previous page (21) include “an immediate turn south after the last radar point at 1822…” which would, of course, define a more southerly range limit than a turn soon after 1828.
Considering that the “kinks” in the MRC performace boundary coincide with paths models in 5000ft altitude increments, I am increasingly persuaded that the path modelling was entirely divorced from the fuel range/endurance modelling and that the former was simply an MRC range maximum without regard to endurance for FL200, 300, 350, 400 measured from “soon after 1828″ [or perhaps even soon after 1822] and ~1840”.
We can’t even be sure whether these Boeing maximum ranges were provided before or after knowledge about higher speed during the PSR track even though that was known about very early on (p6): “On 27 March (D20), the JIT advised they now had more confidence in the increased speeds provided by primary radar near Malaysia. This increased the aircraft fuel burn and the most probable track moved north to the S3 area.”
@Victor ref “The most detailed description of the Boeing fuel and range calculations was a report prepared by Boeing in March 2014 and presented in Appendix 1.6 of the SIR.” Thanks. I shall go back and re-read that.
@all,
To summarize the previous discussions, it appears that the Boeing range limits:
1. used ISA temperatures, not actual air temperatures,
2. used MRC, rather than LRC,
3. used a straight path from a turn off N571, with no lateral offset or zig-zag, and
4. did not account for any air speed above M0.84 prior to 18:22 (which we now know happened over Malaysia).
All four of these effects tend to increase the Boeing-predicted maximum range compared to our predictions. I seriously doubt there is any inconsistency. Rather, it is comparing apples to oranges.
We have the advantage of a number of additional years’ work to determine the post-18:22 air temperatures, the speed settings that match the satellite data at all bearings, a path between 18:22 and 19:41 which matches the satellite data from 18:27 until 00:11, and the geometrical altitude and Mach over Malaysia which matches the primary radar data. None of this was used by Boeing in 2014 because almost all of it was unavailable then.
@Dr B. Regarding #4, the appendix that Victor has kindly drawn to my attention again provides specifics on what/how fuel usage between last ACARS and Ping 1 was calculated, see http://mh370.mot.gov.my/Appendix-1.6E-Aircraft-Performance-Analysis-MH370-(9M-MRO).pdf Table 3 page 5.
They noted higher groundspeed during “segment 3” and accordingly assumed FL300 M0.865 for TAS 510kts.
Given these assumptions up to Arc 1, the subsequent table 4 p6 shows predicted range and endurance for a range of altitude and speed combinations.
As the assumptions are so clearly stated, the figures provided in this appendix may provide an additional opportunity to compare your model predictions against Boeing’s estimates.
I agree with Victor, ref his earlier comment, that this analysis indicates that none of the high-speed options have sufficient endurance to reach 6th arc.
I think we are in a better position now to estimate more precisely the likely fuel usage from last ACARS to first Arc, and that this is likely somewhat (but not a lot) lower than estimated in this Boeing appendix.
@paul smithson: The speed and altitude analysis performed by Boeing for the flight over Malaysia is imprecise. They looked at average speeds over segments, and then selected an altitude that resulted in Mmo when the FL350 Mach number became high. My guess is they also neglected temperature offset from ISA. They also did not consider the speed profile over that segment, nor did they try to estimate the altitude by using the methods we used.
Frankly, I think we’ve done better. That said, the quality of Boeing’s work, considering that it was performed in March 2014, is impressive, notwithstanding the omission of temperature offset.
@Sid Bennett
Victor’s issue is also my issue, the discrepancy in your fuel model.
Don’t bother reading my last post, here is a summary: “We have shown your fuel estimate is unacceptable, both using your own model and ours.”
Victor correctly points out, if your fuel model is wrong, then everything else is a non issue.
@DrB said: To summarize the previous discussions, it appears that the Boeing range limits:…2. used MRC, rather than LRC
I’m not sure even that was properly done. It appears that the MRC Mach number was determined based on the calculated weight and the assumed flight level at 18:28. After that, it appears that TAS, i.e., Mach and (ISA) temperature, was held constant.
@victor, agreed.
@richard. “everything else is a non-issue”. yes, if your model relies on a plane still in powered cruise at 00:11 and beyond.
@DrB @Richard @Victor
I am not a regular participant but I do check in and comment from time to time. I found your 7 March 2020 paper to be excellent work. The discussion about the flight path from 18:20:00 UTC to 19:41:21 UTC was very interesting to me. I had not thought much about how the aircraft got from the last radar fix to the final turn to the SIO. While unlikely, one could accept that MH-370 followed a random route from the turn back to the straights, but no way could the FMT route be random – obviously highly planned. This was no ghost flight, at least though BEDAX.
This is a great improvement on the work done by DTSG that centered at 38S on arc 7. I did not agree with their infinite fuel assumption. By ignoring fuel they did not recognize that the endurance and route were two separate, but related, problems to solve. By considering fuel consumption your crossing at 34S greatly improved on the DSTG work.
Clearly your flight path is an optimal fit for all of the arc crossing satellite data for straight flights – pulling the crossing up from 38S to 34S.
I still think a devious pilot that would even think of the FMT route would avoid a direct polar route because of its obvious link of endurance and flight path. Endurance and range can be decoupled by engaging in s-turns or even 360 clearing turn on a different route. After the fact, whatever path was flown had to meet the data. But out of the infinite ways to fly the aircraft from BEDAX and exhaust fuel at arc 7 at 25S, maybe a few would fit all of the data.
I think what you found is the very best solution for a straight flight from BEDAX. This is a significant contribution. And clearly this area needs to be searched.
I just question whether Z continued to perform maneuvers as he did during the FMT path and deliberately avoided a direct flight south. I don’t have the tools to do it, but it would be interesting to see if even one reasonable maneuvering flight could be created that crossed at 25S meets all of the data. Unlike the FMT path which had logic for the route, this flight could not be planned by Z around the unknowable SatCom data. He would pick the route but decouple the endurance. After the fact the path he flew would have to perfectly meet the constraints. But I expect there are many feasible flight paths to cross north of 25S.
@Victor,
“Frankly, I think we’ve done better.”
Wow, tough decade for Boeing engineering! Their floor of lawyers will be busy. I wonder if Australia will try to recoup some of the cost associated with searching what amounts to an impossible area.
@DennisW: As I said, it was an impressive effort for March 2014. The analysis they produced clearly stated what assumptions were made to arrive at their results, and those results seem to imply that the speeds required to reach 38S would not have the required endurance. The Boeing lawyers won’t be busy on this one.
@DrB
On March 30th you wrote:
“The available fuel for the “no-descent” FMT Route is given in Table D-1. For example, the 19:41 available fuel for Case 5A is 26,397 kg. This assumes the bleed air was on through 19:41. Slightly more fuel is available if one assumes the bleed air was off prior to 19:41, as in Case 7A.”
Thank you for that information.
Out of curiosity I did a quick optimization for CTT186, LRC:
I find a reasonable BTO fit (47 microsec RMS BTOR) for FL370 (air packs off). With a 19:41 latitude of -0.735 deg (and a longitude of 93.476) it brings us close to S37.5 at 00:19. My model estimates 201.23 tonnes total weight (required at 19:41), which means such scenario would be 0.46 tonne short in fuel (based on your case 5A estimate). I’m curious what your model gives, especially regarding fuel required at 19:41 and how significant 0.46 tonne would be in your estimates.
Based on a 485 kts GS the no-descent scenario could possibly go south as far as S1.3 deg at 19:41 (based on early turn south), so the problem is not in the 19:41 latitude.
@Nils.
I have been in the process for the past twp days of assembling the data that Victor wanted to assess my spreadsheet results. In the process, I re-addressed in detail the turn at IGOGU and the return from the track offset to N571 before that.
The statistical errors are further reduced, with no other changes in parameters.
A few days ago, in response to a question from Paul Stephenson, I ran a TT model from ISBIX (LNAV track goes right to it), to account for a case where the navigation was IGOGU LNAV to ISBIX as the final waypoint. The results are very good, but I haven’t redone it with the exact results of my latest path detail upgrade. It moves to a slightly lower azimuth than the LNAV case.
I should be able to post the LNAV results tomorrow and will move on to preparing the TT data.
Much of the hoo ha depends on the value of PDA that is used. At Victor’s request I used PDA=1.5. I use LRC for the whole path from 18:22 without any step climb.
Dinner is served….
@Victor. “@DennisW: As I said, it was an impressive effort for March 2014.”
Even so Boeing was a member of the SSWG, well after that, not a consultant to it. So far as I can gather all SSWG stances were unanimous.
@Richard. Thank you indeed for that expansion and summary. I for one was unaware of the specifics, extent, nature and interpretation of some of those Facebook posts.
Given 2 plus 2 equals 4 what you say plus,
• your group’s paper,
• Dr B’s highlighting that fuel saving en-route was not a priority,
• his opinion as to why there would be no packs on in the final leg,
those to me add to about 3.8, raising the question as to whether more searching is warranted for flight safety reasons.
“@Victor. “@DennisW: As I said, it was an impressive effort for March 2014.”
Even so Boeing was a member of the SSWG, well after that, not a consultant to it. So far as I can gather all SSWG stances were unanimous.”
I would regard it as a resume stain for Boeing if a small cadre of outsiders can provide a much better estimate of fuel range than the aircraft manufacturer.
@Niels,
You said: “Based on a 485 kts GS the no-descent scenario could possibly go south as far as S1.3 deg at 19:41 (based on early turn south), so the problem is not in the 19:41 latitude.”
As I have said several times before, for the no-descent route to reach the 19:41 location on time is possible for all the bearings we analyzed. However, the problem is that a simple turn off N571 reaches the 19:41 location too soon, by several tens of minutes, unless a Hold or a zig-zag is flown between 18:22 and 19:41.
That is one of the disconnects between the Boeing fuel calculation assumptions and the route fits by DSTG. There is a time disconnect of several tens of minutes, during which time fuel is burned without making progress toward the SIO, thus shortening the achievable range at 00:17.
You also said: “Out of curiosity I did a quick optimization for CTT186, LRC:
I find a reasonable BTO fit (47 microsec RMS BTOR) for FL370 (air packs off). With a 19:41 latitude of -0.735 deg (and a longitude of 93.476) it brings us close to S37.5 at 00:19. My model estimates 201.23 tonnes total weight (required at 19:41), which means such scenario would be 0.46 tonne short in fuel (based on your case 5A estimate). I’m curious what your model gives, especially regarding fuel required at 19:41 and how significant 0.46 tonne would be in your estimates.”
You will probably find a better fit at M0.84 (rather than LRC) and FL370 for 186 degrees CTT, based on our Figure 23. I also think CTT is much less likely than LNAV, and we did find that LNAV has a higher Route Probability than CTT at 186 degrees. There is insufficient fuel to fly this route, as we have already addressed numerous times on this blog and in our paper.
The 1-sigma uncertainty in our predicted fuel shortfall/surplus is given in Table D-2 as 427 kg. The uncertainty in the available fuel at 19:41 is 342 kg, and the uncertainty in the required fuel at 19:41 is 256 kg.
@paul smithson,
You said: “I think we are in a better position now to estimate more precisely the likely fuel usage from last ACARS to first Arc, and that this is likely somewhat (but not a lot) lower than estimated in this Boeing appendix.”
Why do you think the actual fuel USAGE may be LOWER than Boeing estimated from last ACARS to the first Arc? The largest error in their calculations is not including the higher fuel flow correction due to higher-than-ISA temperatures, and this is roughly several percent. So, I would expect their calculations to underestimate the fuel consumed (used) in the the actual case. The smaller effect of the brief high-speed segment might counteract the temperature effect, but I expect Boeing’s prediction of available fuel at 19:41 to be on the high side overall. The actual elevated temperatures cause higher fuel consumption, and this results in less available fuel at 19:41 (and a reduced range at 00:17).
@Hank,
You said: “I just question whether Z continued to perform maneuvers as he did during the FMT path and deliberately avoided a direct flight south. I don’t have the tools to do it, but it would be interesting to see if even one reasonable maneuvering flight could be created that crossed at 25S meets all of the data. Unlike the FMT path which had logic for the route, this flight could not be planned by Z around the unknowable SatCom data. He would pick the route but decouple the endurance. After the fact the path he flew would have to perfectly meet the constraints. But I expect there are many feasible flight paths to cross north of 25S.”
The pilot was unaware of the possibility of any position-related information being stored by Inmarsat. That was not known to anyone at the airline. The fact that he did not de-power the SDU indicates he did not perceive any risk in being tracked as a result.
Please tell me why you think he would want to perform maneuvers after 19:41, assuming he were not incapacitated? If he was beyond radar range and could not be tracked by other means, what would be the point of altering course after 19:41?
@Victor.
I have looked in some detail now at Appendix 1.6E. Thank you for drawing my attention. It is now quite clear how the “MRC performance boundary” was derived and we can see in figure 3 “possible flight paths” which paths correspond with assumptions in Table 4.
Orange “475kt” presumed FL400/0.828. “469” corresponds with FL400/0.818 (“MRC”). “443” corresponds with FL350/0.769 (“MRC”). “416” corresponds with FL300/0.706 (“MRC”). “383” corresponds with FL250/0.642 (“MRC”). And those points appear to correspond with what was subsequently depicted by ATSB as the “MRC performance boundary” for different altitudes.
Thus I think that we can conclude that Boeing’s key assumptions were:
1. Starting fuel 17:06:43 per last ACARS
2. Fuel consumed 17:06:43 to 17:28:15 was 10,276kgs (96,563lbs minus 73,908lbs), and that provides the starting fuel load for their path models from Arc 1.
3. “Using …. the wind data to back out ground speed from true airspeed in the performance analysis in Table 4, flight profiles for each altitude/speed combination were created and depicted in Figure 3”.
That sounds like a fairly crude treatment of wind vectors.
As Dr B points out, once ISA delta are considered the consumption would go up/endurance down. But this is offset to some extent by the increased range (due to higher speed for given M) for those paths that have sufficient endurance.
I believe that there is no ISA delta to apply by the time we get to altitudes as high as FL400. Applying to these paths only a gross 1.5% endurance penalty due to PDA, it would imply that Boeing models FL400/M0.828, FL400/M0.818, FL400/M0.727 all have sufficient endurance. The FL350/M0.769 and FL350/M0.694 models also have sufficient endurance if the gross temperature penalty is 3%.
Why does everyone believe the aircraft run out of fuel before crashing into the ocean ?
Or flew in a straight line until the end ?
The pilot was on a mission , his last .
I am inclined to believe he had a destination , the Diamantina Trench .
Carefully planned , brilliantly executed .
After all the careful planning , he wouldn’t just fly till the fuel ran out . He flew south , then east , ditching just above the trench at it’s western end .
And , instead of being 4000 meters down , he is 8000 meters under the waves .
@paul smithson said: That sounds like a fairly crude treatment of wind vectors.
In addition, I see no evidence that wind data above 30,000 ft was used to estimate the wind along the paths:
Wind data during the time period and covering the region of the flight were obtained for two time periods during the flight (18:00 UTC and 00:00 UTC) and at 8 altitudes (400 feet, 2500 feet, 4800 feet, 9900 feet, 13,800 feet, 18,300 feet, 23,500 feet, and 30,000 feet). The data contained time, latitude, longitude, wind speed, wind direction, and altitude.
I really don’t think we can use the Boeing results in a meaningful, precise way. They provide only a very general sanity check, which was appropriate in March 2014, but insufficient at this point in time.
@Robert Flemming said:
Why does everyone believe the aircraft run out of fuel before crashing into the ocean ?
The satellite data set at 00:19 is consistent with a flameout, APU autostart, and SDU reboot.
Or flew in a straight line until the end ?
The BTO and BFO data match a straight line path after 19:41 to a high level of statistical significance. It would be quite a coincidence if a path with multiple turns had the signature of a straight path.
I am inclined to believe he had a destination , the Diamantina Trench .
That’s your hunch based on your intuition, one of the many proposed.
After all the careful planning , he wouldn’t just fly till the fuel ran out . He flew south , then east , ditching just above the trench at it’s western end .
Again, you are proposing a scenario based on your intuition. The evidence suggests the aircraft reached fuel exhaustion and the flaps were not extended when they separated from the aircraft.
@victor – yes, I noticed that as well, and that may impact to a greater or lesser extent on the range calculations. However, it should not affect the endurance. I’d still be interested to know whether their sans-wind, sans-ISA delta fuel endurance estimates at different Mach/FL set out in Table 4 align with your fuel models (even if you take Boeing’s assumption of fuel remaining at 1st Arc).
@Robert Flemming
Hello Robert.
My personal hypothesis is also that ZS was heading for Broken Ridge or other very deep spot. The home simulator case passes by Dordretch Hole and I would not totally rule that out, even though it is 300+ nm from Arc7. My latest essay on the subject is below. I am not actively arguing the case here right now.
https://twitter.com/HDTBill/status/1235628571126710273?s=20
https://www.dropbox.com/s/yblbwii59zytx4g/Notes%20for%20Spread%20Sheet%20.pdf?dl=0
@VictorI
Here is the link to the spread sheet, met data and notes. The separate spread sheet for the met data starts at about 19:22 since it was prepared for comparison with your Fig. 17. The actual data is in the main spread sheet but needed unwinding for plotting, conversion of units for speed and addition of the temperature correction for plotting.
Let me know if you have any questions.
@David
You ask “whether more searching is warranted for flight safety reasons?”
You may be 95% convinced of the cause of the MH370 crash, but others are not.
In the case of the Germanwings D-AIPX crash on 24th March 2015, the final crash report concluded:
“The collision with the ground was due to the deliberate and planned action of the co-pilot who decided to commit suicide while alone in the cockpit. The process for medical certification of pilots, in particular self-reporting in case of decrease in medical fitness between two periodic medical evaluations, did not succeed in preventing the co-pilot, who was experiencing mental disorder with psychotic symptoms, from exercising the privilege of his licence.”
In order to finally determine the cause of the MH370 accident, the search for the underwater wreckage must continue and the FDR/CVR recovered. Only then, can investigators write a final crash report, publish their conclusions and safety recommendations.
You could argue, if the safety recommendations in the BEA final crash report for Germanwings 4U 9525 published March 2016, were in place before 7th March 2014, then MH370 may have never happened.
@DrB
@Hank
@TBill
„… why …… he would want to perform maneuvers after 19:41, assuming he were not incapacitated?”
In my opinion, there were two significant events that could have prompted an active pilot to change flight parameters. I mean sunrise and the last satellite call. What could he think when dawn began and the telephone rang after a few hours of silence? He thought “they” knew that the MH370 still flying, and it may have been just traced (by satellite, aircraft, ship?). A natural reaction would be to return under the cover of darkness or hide in the clouds. Two different options, but in both cases heading, FL and speed would change.
If any maneuvers have been carried out, then relations between Arc 2-5 and Arc 6-7 must be considered completely differently. The 180T / LRC solution loses its uniqueness. Until the start of maneuvers, the MRC option with a heading less than 180 (maybe towards Broken Ridge) seems more natural (considering motivation).
@Greg: The strongest case for no maneuvers is the excellent match with the satellite data after 19:41. It would be quite a coincidence if multiple maneuvers produced the same match to the data as a straight, automated flight with no pilot inputs. Any other justification for maneuvers is just supposition, and we are back to reconstructing paths based on hunches.
@Greg,
You said: “If any maneuvers have been carried out, then relations between Arc 2-5 and Arc 6-7 must be considered completely differently. The 180T / LRC solution loses its uniqueness. ”
I defy anyone to demonstrate a curve like our Figure 19 for any other route, especially for a route with maneuvers between 19:41 and 00:11. In my opinion, it is unique.
@Sid Bennett
The latest spreadsheet you supplied is locked and read only.
It is not possible to see any formula or trace any calculations or data fields.
It is not even possible to move the graphs that are covering the spreadsheet out of the way to see the data in the cells which are being covered up.
How is anyone supposed to do a comparison between your model and their model?
You are not making this comparison exercise very easy!
@Victor
@DrB
This was only the answer to the question: ” why …… he would want to perform maneuvers after 19:41…?”
If the pilot was alive and aware, he should react. So he was most likely incapacitated. If so, what happened to him? If he was implementing a complicated, perfect and the most important plan in his life, why didn’t he assure control until the end? I don’t expect an answer.
@Sid Bennett
I have managed to unlock your spreadsheet!
@DrB
In your model Z carefully planned a 3 dimensional route to minimize radar tracking, as described in the FMT model, and placed the aircraft on meridian E93.79 at N05.95. In your final model he continued on this meridian until arc 7. When you earlier evaluated alternate LNAV routes I do not know where the “final” turn from E93.79 was assumed for each simulation. Possibly at 19:41 UTC or possibly further down near N02.93.
For any straight coarse to fuel exhaustion the range problem and endurance problem are exactly linked and Z would clearly know that. This is a huge simplification. For any straight course an investigator could simulate the earliest and latest point of fuel exhaustion – the range and endurance are linked. This creates a band across the SIO.
If Z wanted to further complicate finding the aircraft he would intentionally decouple the range-endurance solution. This is easily done by performing an occasional holding circuit or even engaging in S-turns. This is the same evasive thinking used for the radar avoidance.
If Z performed a 15 minute circuit he could not have done that following a 180 degree course. The 180 course uses all of the time at M0.84 to satisfy the data constraints. But if Z flew a course more to SSW this would only work if he consumed time with no range along the way. This is with no knowledge of SATCOM arcs. I believe that if you picked a direct course from BEDAX to arc 6 and S25 you could adjust the duration for each segment to fit the BTO and BFO data. The crossing angle for each arc could be during a timing maneuver so it is flexible to fit the data. Remember, Z knows nothing about the arcs so this is not planned. What is planned is not just flying at M0.84 at FL39 in a straight line. It is reasonable for Z to add an hour of uncertainty to the range-endurance models.
Z could have planned a 180 course and done curves – but we know that he did not because it clearly would not fit the data. But he could have selected a different route with some holding and it fit the data. But I suspect there are infinite possible reasonable maneuvering paths at FL39 and M0.84 that would perfectly fit the BFO BTO data. But any intentional delay tactics with this data set have to be north of S34.
It is inconvenient to consider that Z may have intentionally messed with range and endurance. But it is also a great simplification to expect that this devious pilot just flew to oblivion on a direct 180S.
@all Let me be more simple.
If Z actively evaded radar detection and then just wanted to go to sleep and have the aircraft just fly directly down the E97.79 meridian on autopilot until fuel exhausted. That solution is well documented. I have no issues with that assumption.
If Z was not concerned about maximizing range but wanted to decouple the range and endurance for any future searches he could have done one or more holding patterns along the way. There is a good reason why he might have done it. It messes every post flight simulation up badly. Going to max range is not a very smart thing to do, IMO. But any holding moves any feasible course up for arc 7 crossing.
T@Richard
All Victor asked for was specific starting point information and along-path weather. I provided much more than that, but since it was going to be publicly accessible it seemed correct to present a clear baseline. It would have been the same, but much less useful, to have provided a pdf copy instead.
This version has had no code changes from the ones I have been providing as unlocked copies previously.
@Sid Bennett
You say there are no code changes from the previous version, but your model is parameter driven and you have changed a large number of parameters.
Your note is full of the changes you have recently made in response to the various discussions on this blog (altitude, fuel management model, Constant Mach or LRC, FMT route details, GCP or Loxodrome, LNAV or CTT, cabin depressurisation).
You then put out a new version of the spreadsheet that is 17.2 Mb, when the last version on 30th March 2020 was 15.4 Mb.
Then you lock the new version, so others cannot see the changes you have made.
You are not being very transparent.
@Richard
The parameters in the data entry boxes have not changed from the last LRC 39000ft case I sent you recently. Perhaps I ought to have sent the information to Victor privately.
I called attention to the alteration of the pre-FMT path which occurs in Main col P.
Specifically,it is quite clear from col P (to which attention was directed in the MAIN parameter block) that I have returned the plane from the offset to N571 at a time sufficiently earlier than the FMT to introduce a smooth FMT at 1 deg/sec.
I was aware that there are occasional interactions with the parameter data in col L2:15 and I needed to avoid them. The data in col O indicates the resultant azimuth.
You are much more familiar with spread sheets than I am. I am loathe to make code changes and have depended on Barry when they were needed in the past.
I had not considered that changes in recent spreadsheets were necessary. However, your fuel comparisons are being done in sufficient detail that I needed to select the “best” example, taking account of the data entry limitations that exist. In particular PDA=1.5 is an arbitrary change to match your model. I have not carefully studied the underlying assumptions. The model does not compute FOB on a per engine basis, so the implicit assumption is that both engines run out of fuel at the same time. A hand calculation would be needed to adjust it for unequal fuel expenditure.
I would have assumed that the lat long data itself at 15 second intervals would give you sufficient data to run cases in your model starting at 18:22, 18:42, 19:41 and elsewhere whilst varying the height to get the best result with your weather model. If those results prove sufficient to compare with the same paths, then there is no issue. If there is a significant difference, then further investigation might be needed.
If you find any anomalies, they are entirely unintentional and I will make every effort to resolve them.
res ipsit
@Hank,
You said: “When you earlier evaluated alternate LNAV routes I do not know where the “final” turn from E93.79 was assumed for each simulation. Possibly at 19:41 UTC or possibly further down near N02.93.”
No final turn assumption or fit was needed or used to fit the SIO Routes, which used the 19:41 – 00:11 satellite data. We assumed no maneuvers occurred after 19:41.
You also said: ” For any straight course an investigator could simulate the earliest and latest point of fuel exhaustion – the range and endurance are linked.”
One is not precisely derivable from the other, because of the unknown portions of the route prior to 19:41.
You also said: “If Z wanted to further complicate finding the aircraft he would intentionally decouple the range-endurance solution. This is easily done by performing an occasional holding circuit or even engaging in S-turns. This is the same evasive thinking used for the radar avoidance.”
I doubt that was a primary motivation, but the zig-zag FMT Route did just that prior to 19:41.
You said: “But if Z flew a course more to SSW this would only work if he consumed time with no range along the way. ”
There’s not enough fuel even for a SSW straight path, much less one which burned fuel and made no progress along a SSW route.
You said: “Z could have planned a 180 course and done curves – but we know that he did not because it clearly would not fit the data. But he could have selected a different route with some holding and it fit the data.”
I am unaware of any proposed route with a Holding pattern after 19:41 which fits the satellite data acceptably well.
You also said: “It is inconvenient to consider that Z may have intentionally messed with range and endurance.”
It’s not a matter of inconvenience. Our proposed zig-zag FMT Route did just that, although I don’t think that was a primary motivation for his flying it.
@Greg
Since you specifically mentioned it, it just so happens @ArtoL8 and I on Twitter are currently discussing one alternative might be 180 South until the 2314 phone call, at which point optional heading change ENE to 20-22 South. But it is not currently the favorite case for either one of us. Essay on that option has been on my to-do list for while now.
@DrB
You say above: “There’s not enough fuel even for a SSW straight path, much less one which burned fuel and made no progress along a SSW route.”
I am trying to resolve such a decisive statement into either a more perhaps constrained or a more perhaps unrestrained consideration. Although any route 19:41 through to 00:11 and eventually onwards to 00:19:29 and 37 will have the following additional constraints (limitations) as the route takes a more westerly path, so far it seems to me that the fuel constraints actually do not limit range quite as concisely as you and your co-authors have presented in Figure D-3 (and have incorporated into Figures 5 and 15).
The (two) additional constraints referred above are:
1. As a route takes on a more westerly component then the strong winds at the southern later stages of the route 19:41 through to 00:11 become more and more a headwind; and
2. As a route takes on a more westerly component then the geometrical flight distance from Arc 2 through to Arc 6 will increase. This may be simply explained by considering that a piece of string around the earth in the North-South direction will be slightly shorter than a piece of string around the earth at the equator.
@Sid Bennett
@Richard
1. Your discussion on Spreadsheets: a. My simple little laptop does not have the power to handle too large an excel file. b. It was my practice (still is I guess) to place graphs into separate Worksheets for a variety of reasons, including the specific reason Richard highlighted.
2. Would one of you kindly provide a set of loci (preferably in terms of Latitude and Longitude directly beneath the satellite) at the times of the Handshakes (pings, whatever you wish to call them). Yes, Sid, I know the basic information is in your spreadsheet but also refer to 1.a., above. I would like to have a simple representation of how significantly the “Arcs” differ from truly concentric “circles”.
Woops !
2. Would one of you kindly provide a set of loci (preferably in terms of Latitude and Longitude directly beneath the satellite)
OF THE SATELLITE POSITION
at the times of the Handshakes.
@Sid Bennett
You state “The parameters in the data entry boxes have not changed from the last LRC 39000ft case I sent you recently.”
But you have changed a large number of parameters, other than in the main data entry boxes.
You state “Perhaps I ought to have sent the information to Victor privately.”
When I asked Victor, he told me to feel free to respond.
But if you want to have a private conversation with Victor, that is fine by me. I will but out of your conversation.
I was hoping to clarify the many mistakes, that you are making in your spreadsheet.
You claim “res ipset”, or is that “res upset”.
I point out:
(1) The incident was of a type that does not generally happen without negligence.
(2) You are the one making changes in your spreadsheet under your control.
(3) I have not made any changes to your spreadsheet.
Res Ipsa Loquitur
@Richard (responding to @David)….
“You ask ‘whether more searching is warranted for flight safety reasons?’
You may be 95% convinced of the cause of the MH370 crash, but others are not.”
“…In order to finally determine the cause of the MH370 accident, the search for the underwater wreckage must continue and the FDR/CVR recovered. Only then, can investigators write a final crash report, publish their conclusions and safety recommendations.
….if the safety recommendations in the BEA final crash report for Germanwings 4U 9525 published March 2016, were in place before 7th March 2014, then MH370 may have never happened.”
I imagine that everyone still reading about this 6 years on must think it is DESIRABLE to locate the crash. But “MUST continue [until] the FDR/CVR recovered”? That’s hard to argue, I think. Aside from sunk costs and OI’s own interest in perfecting their technology, I’d think that a disinterested party would see little merit in continuing the search, beyond perhaps one more try based on the present analysis. But if I were in the Malaysian govt, I’d have trouble recommending more funding, even without facing a nasty recession. Nice if they do, but…..
[Odd that you mention Germanwings, which happened a year later, as an antecedent, rather than other earlier evident suicides as the Egyptair and Silkair cases. Although neither of these was admitted as suicide by home countries, they were enough to initiate “don’t leave a pilot alone” rules in many carriers..]
@ikr
The “black boxes” themselves I think are unlikely to provide much additional information. Simply confirming that the place was flown to where it was found. I don’t think many people still embrace a mechanical fault scenario.
Let’s not forget the phone event by Zaharie in the cockpit minutes before the aircraft lifted off. It was traced to a phone using a prepaid sim card purchased under a false identity. That is very curious, and supports the notion of messaging to collaborators on the ground in KL. The is probably the main reason I do not endorse the popular murder-suicide theory and prefer cosideration of a diversion for a purpose. Going down that path is difficult to reconcile with a 180 degree track 34.3S terminus.
@DennisW: In the RMP report, there is a reference to WeChat activity from the captain’s cell phone while lined up on the runway before takeoff. What is the evidence of a call “using a prepaid sim card purchased under a false identity”, other than some rumors?
If I remember correctly, the WeChat call “was to” a cell phone using a prepaid sim card.
@Sid Bennett: What I was requesting was the starting time, position, flight level, Mach number, fuel quantity, and path-averaged parameters such as temperature offset and tailwind so that simple comparisons of fuel consumption could be made. You returned a complicated spreadsheet that you admit you don’t fully understand. I don’t have the time to extract and compare the results. Richard seems more willing to do so, so perhaps you can interact directly with him.
@ventus45: We can’t put much weight on your recollection of a rumor.
@DennisW: The only information I have about phone activity on a prepaid phone is what appeared in UK tabloids in March 2014. I have been the victim of UK tabloids distorting comments I’ve made about MH370, and I refuse to work with any of them. The Malaysian Inspector General at the time also denied the story, although he has proven to be as reliable as the UK tabloids.
My recollection it was Tim Pardi who called ZS with sim card phone.
We have no smoking gun re: conspiracy, we do have innuendo and rumor.
To me, Tony Abbott’s recent disclosure that Razak admin thought it was murder-suicide implies the negotiation with Razak was probably an untrue rumor. Also it seems very likely that there was intentional depressurization at IGARI. If there was a negotiation, it was over by IGARI it would certainly seem. Or maybe there was a pre-flight negotiation Razak was aware of. But Razak apparently did not think Xmas was the end-game of the flight.
According to @TimR the negotiation rumor was brought to the attention of the search quite early, resulting in a brief possible search of Xmas by China en route to the deeper south SIO.
@TBill: Please, no more recollections of rumors.
In The Australian, Amanda Hodge reported the following:
The pilot of missing Malaysia Airlines Flight MH370 had grown close to a married woman and her three children, one of whom has severe cerebral palsy, in the months before his disappearance and the two had messaged each other about a “personal matter” two days before the ill-fated flight on March 8, 2014.
The friendship, which quickly developed to a level where Captain Zaharie Ahmad Shah was playing an almost fatherly role to the children, had cooled in the weeks leading up to the accident at his instigation, the woman has told The Australian. But Fatima Pardi would not reveal the subject of their last WhatsApp discussion before the flight.
“That last conversation was just between me and him. I don’t want to talk about it,” she said.
So this exchange occurred two days before the flight on WhatsApp, and did not occur while lined up before the takeoff of MH370.
The article is behind a paywall, but the contents can be accessed in this Reddit post:
https://www.reddit.com/r/MH370/comments/51g2al/new_report_mh370_pilots_friendship_with_mystery/
@Victor
You are correct. The original reference was made in a UK tabloid. Other sources subsequently picked up the story.
https://www.dailymail.co.uk/news/article-2587064/Probe-mystery-call-captain-doomed-jet-Unknown-woman-used-fake-ID-buying-phone-bypass-security-checks.html
I don’t think the fact that the call was made is in doubt. Is is also a fact that the person on the call has never been identified.
@lkr
I did not state “But “MUST continue [until] the FDR/CVR recovered”” as you misquote.
I stated “the search for the underwater wreckage must continue” AND “the FDR/CVR recovered”.
The “and” is a conjunction in between to separate sub-clauses in the sentence.
The first clause is “the search for the underwater wreckage must continue”.
The second clause is “the FDR/CVR recovered”.
Have you ever seen a final report of an aircraft crash without reference to FDR and CVR?
@DennisW: I don’t think the fact that the call was made is in doubt.
How can you say that? I doubt the veracity because there is no evidence other than a UK tabloid story. The reporter could have easily confused the call with the WeChat activity.
@DennisW: The RMP report says this regarding a call two hours before the flight:
Records also revealed that the MH370 Pilot made only one phone call to his wife, Faizah Khanum Binti Mustafa, which is about two hours prior to the flight taking off. It is also noted that his wife is also in his WeChat friends list. However, since WeChat did not provide any information regarding communications done via WeChat, MCMC is unable to confirm whether any communication between the two persons took place or not on the WeChat.
@Victor,
How can you say that?
I got it from you. 🙂 🙂
“@DennisW: In the RMP report, there is a reference to WeChat activity from the captain’s cell phone while lined up on the runway before takeoff. What is the evidence of a call “using a prepaid sim card purchased under a false identity”, other than some rumors?”
@Victor
Perhaps our disconnect is my use of the term “call” and the “WeChat” activity synomously. Both a form of messaging in the current context.
@DennisW: Here is what you said:
Let’s not forget the phone event by Zaharie in the cockpit minutes before the aircraft lifted off. It was traced to a phone using a prepaid sim card purchased under a false identity. That is very curious, and supports the notion of messaging to collaborators on the ground in KL. The is probably the main reason I do not endorse the popular murder-suicide theory and prefer cosideration of a diversion for a purpose. Going down that path is difficult to reconcile with a 180 degree track 34.3S terminus.
I referred to evidence of three different communication exchanges, but I see no evidence of “a call using a prepaid sim card purchased under a false identity…in the cockpit minutes before the aircraft lifted off”, except what was reported in the UK tabloids. The three communication exchanges are:
1. The phone call to his wife 2 hours before the flight
2. The exchange with Fatima Pardi on WhatsUp two days before the flight
3. WeChat activity while lined up on the runway before takeoff
@DennisW
I agree with Victor above, no reference to sim card phone for #3.
However, it seems to show the US policy for sterile cockpit rule was apparently not a Malaysian safety practice at the time.
@DennisW
@Victor
P.S.-
Reminds me that I was hoping for the MH370 6th anniversary that we would learn the nature of the runway WeChat call. A few months ago (caution-if I recall) someone from China came on Twitter briefly telling Victor that he knew the nature of the WeChat call. The implication was the person from China felt that the WeChat call was exculpatory or unrelated to the disappearance.
@TBill
I am not disagreeing with Victor either. Good grief. I am simply saying there was communication from the cockpit very shortly before takeoff. What difference does it make whether it was a call, WeChat, text message, email…
I provided a reference to a sim card purchased under a false identity as being the other party on the WeChat call. Victor does not like that source.
@TBill,
Also, to my knowledge, the other party associated with the runway call has never been identified. That is consistent with the fake ID sim card purchase.
@George G
George G says:
April 2, 2020 at 10:17 pm
@Sid Bennett
@Richard
“1. Your discussion on Spreadsheets: a. My simple little laptop does not have the power to handle too large an excel file. b. It was my practice (still is I guess) to place graphs into separate Worksheets for a variety of reasons, including the specific reason Richard highlighted.”
**I understand. It would take me a little time to find it as it is not ever changed. However, you should find the data in Fig. 8 of the Inmarsat (Ashton) paper in the JON accurate for any preliminary study. It should be available on line with free access.**
@Richard
Richard says:
April 3, 2020 at 2:00 am
@Sid Bennett
You state “The parameters in the data entry boxes have not changed from the last LRC 39000ft case I sent you recently.
But you have changed a large number of parameters, other than in the main data entry boxes.”
** I believe that I identified all of the input data that I changed, and clearly stated where the new azimuth data was found in the spread sheet by statements in the Notes document that contained the links to the spreadsheet. Please let me know what others there are. If there are, I will respond.
Changes such as PDA and a more detailed FMT were made in response to criticisms of my recent paper.**
Victor Iannello says:
April 3, 2020 at 7:55 am
@Sid Bennett: “What I was requesting was the starting time, position, flight level, Mach number, fuel quantity, and path-averaged parameters such as temperature offset and tailwind so that simple comparisons of fuel consumption could be made. You returned a complicated spreadsheet that you admit you don’t fully understand.
**As you are aware, the differences in fuel consumption between UGIA and my simulation are going to be of the order of 100s of kg. In past critiques of Barry’s model strong statements were made about the detail to which the weather model was employed in the two models. There have been conclusorary statements regarding the fuel quantities displayed in the spreadsheet I previously sent.
As I am not the author of the spreadsheet, I should not represent myself as being expert in all of the details.
In the past, either you or Richard stated that there had been a time when you and Barry cross-validated the spread sheets. I have used parameters that you have provided in the past, and in UGIA, to compute, for example, the final leg from 19:41 (except for fuel) and find close agreement.
I shall provide you with average tailwind, temperature data at 39000ft starting at the FMT** —-after lunch
@Sid Bennett
You stated “As you are aware, the differences in fuel consumption between UGIA and my simulation are going to be of the order of 100s of kg.”
Our paper shows a fuel shortfall at 00:17:30 UTC for scenario 7B1 of 95 kg, with a ZFW of 174,369 kg.
Your current model shows a shortfall of 741 kg at 00:17:30 UTC, with a ZFW of 174,369 kg.
The 1-sigma uncertainty in our predicted fuel shortfall/surplus is given in Table D-2 as 427 kg. The uncertainty in the available fuel at 19:41 is 342 kg, and the uncertainty in the required fuel at 19:41 is 256 kg.
Your own value of a 741 kg shortfall is outside the limits.
Your own value of a 667 kg shortfall (with your setting of ZFW at 174,000 kg) is also outside the limits.
@Dennis:”The “black boxes” themselves I think are unlikely to provide much additional information”
Thanks, I agree. The CVR probably contains nothing. And finding the wreckage will probably mean we already know what the FDR will say. That it was functioning perfectly, going exactly where it was programmed to go.
Something weirdly different from the above — the plane will never be found.
@Richard: “…as you misquote…”
Whatever.
What annoyed me in your original posting was the “must”. I was asking why a rational actor would plow limitless resources into the search for the wreckage and [yes, AND] the recorders.
My belief is that if we [OI, actually] were to find the wreckage, they would already know what the recorders say. Likely nothing but overwrite for the CVR, and on the FDR perfectly functioning systems for a plane programmed to end just where it did, with all passengers [and likely the pilot] long dead.
Your “must” is couched in an argument for safety, but here it’s a very legalistic ideal of closure. Yes, we should not expect a final report without the wreckage being found. But we could be satisfied of safety for the future being addressed — at a point where 95% of the evidence points to pilot suicide, or even, to any theory of directed flight to the SIO.
The rational actor [or competent Transport Minister] must [my “must” here] weigh the decreasing marginal advantage of finding the recorders vs. the increasing marginal cost of finding the wreckage [eg, re-searching supposedly cleared terrain…] and say that there is no reason to continue.
@DrB
Thanks for your comments to my posts.
I appreciate that your and colleagues work has been outstanding and that the 180 track at Mach 0.84 and FL 390 to cross arc 7 at S34.3 is optimum for all “straight” routes. And it is completely reasonable to assume that the aircraft followed the 180 track.
But you can not prove that the aircraft followed a straight path and did not engage in maneuvers between 19:41 and 00:11. I don’t challenge that the fixed 180 track may be the most likely scenario.
But, without the fixed course constraint, there is logically an infinite number of possible maneuvering routes (at FL 390 and Mach 0.84) that could exactly fit the SATCOM data but not cross arc 7 at S34.3. Because of the SW-NE slope of the arcs any maneuvering path would have to cross arc 7 further north than S34.3. You could not plan based on unknown arcs, but all that matters is that the pilot maneuvering along a different course created the exact BTO/BFO data.
If we look only at the route from arc 2 at 19:41 to arc 3 at 20:41. Along a 180 track at a GS of 480 knots the aircraft travels 480 nm to cross arc 2. Because of the arc 3 orientation, if the aircraft flew 480 nm on a direct 190 course it would go beyond arc 3 at 20:41. But if the aircraft was engaged in s-turns or a hold between 19:41 and 20:41 it could have exactly crossed arc 3 along the 190 nominal course. And the aircraft crossing angle at that time could be perfect for the BFO data because it could have been aligned with 180 at that exact time.
So it is possible to follow a straight 180 course from 19:41 to 20:41 and fit the data or follow 190 course with some maneuvering and exactly fit the same data. This is not by design, it is only an outcome.
The 190 maneuvering course between 20:41 and 21:41 could also exactly fit the data. You could say this is not likely. But this is not about planning this. It is just asking if the pilot had engaged in intentionally delaying progress along a selected course, out of the infinite choice of en-route maneuvers, could the path that day have fit the data.
Any direct course west of 180 moves closer to the arcs and at Mach 0.84 would have excess fuel at arc 7. But a hold or s-turns consumes the fuel without gaining distance.
It would be impossible to plan around unknown arcs. But a nominal path at 185, 190, or 195 with s-turns to burn fuel without range could have created the same arcs as the steady 180.
Flying to decouple range and endurance for four hours takes a lot more effort than setting the autopilot and sleeping. So I don’t question just setting the autopilot to fly the 180.
@Dennis
I wrote “Something weirdly different from the above — the plane will never be found.”
Which probably reads as obscure gibberish. I meant that a non-simple solution, ranging from a baroque curly-q routes that happen to cross arcs in the right manner, to a Whack-O interceptions at Diego Garcia or diversion to Kazakstan, mean the plane will never be found..
@Ikr
I interpretted your meaning as you intended. I don’t have strong opinions relative to the plane being found or the search continuing. The information on the FDR falls in the category of “interest” relative to the events speculated on this thread. I doubt it will provide any information relative to diversion causality.
@VictorI
Computed by “hand” from the posted spread sheet:
Start time:18:39:30, TAS= 483.6kn
Lat/Long 7.4856, 94.3766
Average Tailwind: -3.02kn
Average Temp (K) :220.76
Altitude 39000ft
@Sid Bennett: What is the Mach number? The fuel at 18:39:30? Is the altitude a pressure altitude or geometric altitude?
@VictorI
@ 18:39:30 FOB is 33102kg and M=.840. The altitude is geometric.
@TBill
A very good reason for using WeChat for “clandestine” messaging security instead of text messaging or email.
WeChat securely encrypts your sent and received messages between our servers and your device ensuring that third parties cannot snoop on your messages as they are being delivered over the internet. We do not permanently retain the content of any messages on our servers whether they are text, audio or rich media files such as photos, Sights or documents. Once all intended recipients have received your message, WeChat deletes the content of the message on our servers and therefore third parties including WeChat itself are unable to view the content of your message.
@DrB
Sorry, I am getting my headings mixed up in my last post and earlier. I meant taking courses more toward Australia. So I should have been saying a 170 versus 180 and not 190. I am getting reversed in my thinking for southern hemisphere courses versus aircraft headings from the nose. Sorry. 10 degrees left of 180 is 170 and not 190!
@DennisW: WeChat’s security is only as strong as trust in the Chinese government. Draw your own conclusions.
@Sid Bennett: Are you sure the reference altitude is geometric?
@DennisW
Interesting sounds almost impossible to get that convo
@TBill
Well, the RMP did not get it, if you trust the RMP. Frankly, I am surprised the RMP revealed that the WeChat messaging took place.
Dennis. Question: without forensic access to the phone or cooperation from wechat, what evidence is there of any specific messaging activity? Presumably all the carrier could provide is IP and data volume exchanged. The phone might have been unattended in his bag.
@lkr
Why do you suggest “limitless resources”? I am suggesting limited resources.
The Malaysian Government specified a long list of items, that they wanted recovered by Ocean Infinity, if the wreckage was found, including the FDR and CVR.
The major cost is finding the aircraft, not recovering a list of items requested by investigators.
Whilst you are there, why not survey the wreckage, video and photograph items of interest and recover selected items. That is the normal process.
AF447 was an example of an underwater search and recovery operation. Take a look at the final report from BEA. BEA recovered the FDR, CVR, engines and avionics bay.
“On 1st May 2011, the investigation team located and identified the protected module of the flight data recorder (FDR). The latter was raised and lifted on board the Ile de Sein by the ROV REMORA 6000 the same day. The following day the CVR was located and identified. It was raised and lifted on board the Ile de Sein on 3 May 2011. The flight recorders were first transferred to the port of Cayenne (French Guyana) by the French navy patrol boat La Capricieuse, then transported to the BEA by air on 12 May 2011. The recovery of aeroplane parts continued during that period, with in particular the engines and the avionics bay containing onboard computers being raised.”
@sk999,
Here is a report on my effort to estimate the “selectivity” of the 9-parameter Objective Function, which I call the “Route Probability”.
1. The route fitting problem is made difficult by the multiple peaks in the objective function with similar amplitudes.
2. There appears to be only one “global maximum”, and it occurs at or very near 180.0 degrees true bearing, both for the satellite data and for random data sets.
3. Identifying the global maximum requires a systematic survey, for each data set (real or random), of all feasible bearings.
4. Setting an initial condition of the bearing being within the range of 180 +/- 0.5 degrees generally locks the fit to the main central peak (containing the global maximum).
5. No minimization program I know of can automatically identify the global maximum out of the full range of feasible bearings. There are too many deep minima to be crossed.
6. Perhaps you can predict if the least-squares method you are using can do this. Is it possible and practical to expand the least-squares method to include all 9 parameters I am using?
7. I have done fitting tests using five sets of randomized BTORs/BFORs.
8. I generate the random data by first finding the global best fit using the actual satellite data. Then I assume those predicted BTOs and BFOs represent the True Route (i.e., with zero residuals). That is, I assume the mean of each of the measured BTOs and BFOs for many satellite data sets would equal those “best-fit” values of predicted BTO and BFO. Next, I add random BTO and BFO noise with the appropriate statistics to those best-fit predicted BTO/BFO values. This gives me random sets of synthetic satellite data, which I can then fit, and determine the precision of the 7th Arc location (i.e., the LEP).
9. Note that this process does not determine the BTORs and the BFORs when using random data. These residuals will continue to vary according to the fitted route parameters. Instead this method determines alternate sets of equivalent “measured” BTOs/BFOs (found using the global maximum route and the satellite data). So, the BTORs/BFORs will vary during the new fit to the randomized “pseudo-satellite data”.
10. I made three figures to illustrate the results of this work. They are available HERE .
11. Figure 1 shows a map of the predicted positions on the 7th Arc (i.e., the LEPs). The small cells in this figure are 1 NM squares. The black X is the global best fit. Note that here I have only made one assumption, namely that the air speed setting is LRC.The green and blue points represent different trials with random data sets. The blue diamonds are the predicted poositions for random data sets #2 – #5. Note that all random trials are within +/- 5 NM of the global best-fit real-data location.
12. To a small extent, the final result depends on the initial guess for the 19:41 bearing. That is, the fitting process has some “stiction”. For instance, using a random data set #1, if I start with a guess of 180.5 degrees for the bearing, the final LEP is slightly to the SW of the LEP I get when using a 180 degree initial guess. Similarly, if I start at 179.5 degrees, the final LEP is slightly to the NE. The green unfilled circles in Figure 1 are the results using 180.5 and 179.5 degree initial guesses. With an additional small step in the bearing, the fit can be made to fully converge (to the filled green diamond location).
13. All 3 LEPs for random data set #1 are within 4 NM of each other along the 7th Arc. So, the “stiction” effect is not large, being roughly +/- 2 NM.
14. This result demonstrates that there are some limitations in fitting with EXCEL SOLVER when the bearing is a free variable. The first result may be in error by up to 2 NM. This “stiction” effect does not occur when the bearing is fixed during the fit, as was done previously and shown in our paper. Indeed, that is one of the reasons we stepped the bearing between fits rather than allowing it to be a free variable in each fit.
15. The “stiction” effect can be avoided by using a multi-step fitting process. First, one takes an initial guess for the bearing and does a fit with it as a free variable. Next, one fixes the bearing slightly beyond the previous fitted value, and fits all the other parameters. Then one does a third fit with all parameters, including the bearing, as free variables. This process is continued until no futher change in the LEP occurs.
16. Figure 2 shows the route probability versus bearing. The highest route probability occurs quite close to 180 degrees, and all 5 of the fully-converged random trials are within 180 +/- 0.05 degrees.
17. Figure 3 shows the route probability versus 7th Arc latitude. All 5 random data sets lie within +/- 0.06 degrees in latitude of the global best fit.
18. In conclusion, and subject to the limitations of having only 5 random trials, the selectivity of the route probability function appears to be quite high. Note that this high degree of selectivity accommodates the BTO and BFO noise, which appears to allow only +/- 5 NM along the 7th Arc from that cause.
19. A second conclusion is that the high route probability found using the actual BTO/BFO data is due to the satellite data set (as we have suggested previously), not to overfitting route parameters. Note the 5 route probabilities using the random data sets are both lower and higher than the actual data set. Three of the random trials are < 50% and two are higher than 50%. So, within the limitations of having only 5 random trials, the expected value is close to 50%, as predicted and expected.
@Paul
Certainly the IP address, time tag, data volume, and caller sim ID, would logged by the carrier and be known. Beyond that I am not sure. WeChat uses symmetric end to end encryption in a client to server and server to client architecture. Messages can still be obtained through a back door at the server before they are deleted. One would have to layer a public key cryptography method to guarantee security. In the context of the MH370 cockpit messaging, the messages would have long been deleted if they were accessed hours after the fact.
@Richard
I am responding promptly so as to keep the dialog going. I may refine this analysis later.
As I have mentioned several times, the fuel calculation is done using the same PDA for both engines. So, as shown, all fuel runs out in both tanks at about 00:10:45 or so. Its 71kg short at 00:11. The value at later times is clearly erroneous as the engines have shut down and no account of the savings for one engine operation has been taken. The spread sheet design did not anticipate that fuel consumption would be considered a significant discriminant.
In making this comparison I have accepted without challenge your value of PDA=1.5 and I do so here to keep the comparison simple. In previous papers I believed you allowed PDA to vary below 1.5 for path selection.
Assuming at total fuel at take-off of 43800kg, with an estimated 2sig of 622kg, the difference in fuel consumption between the two engines to the time of REFE is 1.5×43800/2=394kg. So, when the total remaining FOB is about 394kg, there is REFE. That occurs at 05:45. There is still 394kg of fuel for the left engine. Your estimate (probably an upper limit) for fuel consumption at maximum cruise power is 4400kg/h or 74kg/m.
The amount of time the left engine then continues to run is 394/74= 5.33 min. So the predicted time of fuel exhaustion MEFE is 00:11:05.
That’s not much different than the spread sheet, and seems to leave about 6.5 minutes to account for to get to 00:17:30 (estimated MEFE) . But the fuel consumption is not more than 74kg/min and in 6.5 minutes we are only short 481kg.
You give a 1 sigma error in fuel as 427kg.
A small error in PDA for example or the one engine fuel consumption, would effectively wipe that out.
More importantly, as you assert, the plane should be flying about 1000feet higher than our simulation, and more efficiently, so there would be a lesser shortfall.
The only way to do the comparison effectively is for you to run the 186T route from my starting point at 18:39:30 and we can then compare the relative fuel consumption. It is a very simple route.
I can estimate the effect by running the model at 41000 ft. The BFO/BTO match is not as good, but the path is the same and the fuel consumption at 00:11 can be compared. At 39,000ft it is -71kg; at 41000ft it is +88kg, for a total improvement of 159kg. Interpolating between the levels to get to 40000ft, the improvement in fuel consumption is 159/2= 80kg.
The best estimate then adds about 1 minute to the flight duration and reduces the fuel “deficit” to 427-80= 337kg.
@Hank,
You said: “But you can not prove that the aircraft followed a straight path and did not engage in maneuvers between 19:41 and 00:11. I don’t challenge that the fixed 180 track may be the most likely scenario.”
I do not believe that the feature displayed in Figure 19 can be created by any maneuver or sequence of maneuvers post 19:41. The only explanation I can envision is that it is caused by the True Route with no maneuvers.
You also said: “Flying to decouple range and endurance for four hours takes a lot more effort than setting the autopilot and sleeping. So I don’t question just setting the autopilot to fly the 180.”
Who suggested the captain was sleeping?
@Richard, Ikr. About the need to search again:
https://www.dropbox.com/s/e0ik0yheb99hjgt/About%20whether%20a%20new%20search%20is%20now%20warranted..docx?dl=0
Minor amendments made
Hank said:
April 3, 2020 at 4:54 pm
” @DrB
Sorry, I am getting my headings mixed up in my last post and earlier. I meant taking courses more toward Australia. So I should have been saying a 170 versus 180 and not 190. ”
Hank: You seem to be in a trap which is so easy to fall into.
If we were to only limit discussion to “straight line” flight paths then that would limit us to “straight line” flight paths which cross the “Arcs” at approximately the time of the generation of those arcs. Now, the time is defined as immutable for our purposes. The location of the arc at that time [at any particular altitude] is dependent upon the time and the position of the satellite relative to the earth at that time and the calculated distance between the aircraft and the satellite at that time. For the purposes of this discussion the arc location may also be defined as immutable.
Note that in the above paragraph the discussion concerns paths which cross the arcs at APPROXIMATELY the time of generation.
The only means we theoretically have to accommodate for any initially approximate timing of any particular path candidate is to consider variations of other parameters affecting the flight path. This is the method taken by DrB and co-authors in their analysis.
Now, Hank, to return to your trap:
Your post, Comment-27729 on April 3, 2020 at 3:30 pm, together with your later clarification, clearly considers that your [170 degree heading] course covers less straight line distance (thus allowing for intervening manoeuvres) than the “straight line” path you are comparing it to. This implies to me that for your shorter overall distance to apply you are likely using the SAME Arc 2 crossing point as for the “straight line” path to which you are comparing it. This is NOT the GENERAL case.
It is accepted that there a myriad number of such shorter overall distance paths where a meandering path passes through each arc at the time of the generation of the arc and even passes through at such a bearing which satisfies the short term BFO data applicable at each arc. And for any number of such proposed paths there will always be another which might be proposed. As you say an infinite number. But which of any of the postulated or proposed paths are likely ?
The general case for a straight line path through the arcs approximately satisfying the requirement to cross the arcs at their times of generation may be described in any one of many ways, but for this discussion it will be described by the set of solutions passing through Arc 2 at the time of Generation of Arc 2.
Now, this set of solutions has some limits. For any deduced point on any proposed Pre-Arc 2 flight path there is a physical limit on the range of points along Arc 2. We may consider one limit as being the distance possibly travelled by the aircraft at MMO from the deduced point on the proposed Pre-Arc 2 flight path to either possible reachable extreme point on Arc 2. This would provide North and South limits on Arc 2, or outer bounds for the set of solutions.
Naturally, other limitations on the range of points along Arc 2 may apply, but these do not form part of this discussion.
As “one” progresses from the northern limit of the points along Arc 2 towards the southern limit then the corresponding bearing of the straight line path through the arcs approximately satisfying the requirement to cross the arcs at their times of generation will progress from below 180 degrees through to above. For each member of the set of (infinite) solutions passing through the range of points along ARC 2 there will be ONE and ONLY ONE bearing.
The trap for anyone trying to fit a meandering path through the arcs which passes through each arc at the time of the generation of the arc and even satisfies BFO data is making the choice of a specific ARC 2 starting point. Making this choice may seem to limit the possibilities. It does not.
The point (pun intended) of the foregoing discussion is to highlight that if there is not evidence for a “straight line” path having been conducted though Arcs 2 through 6 then there is no hope of determining a potential future search region. (Reportedly, analysis confirms there is such evidence.)
DrB, I have DELIBERATELY considered the location of the arcs to be immutable in the above discussion. Any uncertainty in the BTO, for any given arc, which BTO actually defines the arc, may be accommodated by considering that uncertainty as just one of the “other parameters affecting the flight path”. And you have effectively done just this as I see it.
@David
Many thanks for your paper “About the need to search again”.
The International Civil Aviation Organisation (ICAO) has published its International Standards and Recommended Practices for Aircraft Accident and Incident Investigation in Annex 13 to the Convention on International Civil Aviation.
The definition of an “accident” includes when “the aircraft is missing”.
“The sole objective of the investigation of an accident or incident shall be the prevention of accidents and incidents. It is not the purpose of this activity to apportion blame or liability.”
Investigators have an obligation to publish a final report including in the factual information:
“1.11 Flight recorders. Location of the flight recorder installations in the aircraft, their condition on recovery and pertinent data available therefrom.
1.12 Wreckage and impact information. General information on the site of the accident and the distribution pattern of the wreckage; detected material failures or component malfunctions. Details concerning the location and state of the different pieces of the wreckage are not normally required unless it is necessary to indicate a break-up of the aircraft prior to impact. Diagrams, charts and photographs may be included in this section or attached in the Appendices.”
Some have said the FDR will only tell you what you already know, in other words where the plane is. That is not true, the FDR contains much more data than just position. Some have said the CVR will be overwritten with silence and therefore blank. That is an assumption, however if proven true, that is also evidence.
You argue whether the cost of a further search is warranted. How do you assess the cost of a similar “accident” happening again? What is the cost of prevention of a similar “accident”?
You argue that the measures implemented after 9/11 and Germanwings are questionable and partially proven ineffective or counterproductive. Maybe we should review those measures and implement new ones.
You argue that the NOK may have sensitivities to the MH370 crash site being disturbed. I had some contact with the NOK recently for the 6th Remembrance Event under the motto: “Search ON: It’s not over yet”. The NOK clearly want the search resumed and are actively canvassing the Malaysian Government to that end.
I admit my use of the word “must” was influenced emotionally (and not rationally, as @lkr has pointed out). I was quoting from the closing lines from my video for the 6th Remembrance Event:
“I invite the Malaysian Government to consider our published findings and in the interest of the future safety of the flying public, to continue the search for MH370, until the cause for the accident can be finally determined and the next of kin know what happened to their loved ones.”
and
“the motto of VOICE370 – The MH370 Family Support Group “The Search Must Go On”.
@Sid Bennett
You stated: “Assuming at total fuel at take-off of 43800kg”.
This is not correct. The total fuel at take off 16:41:43 UTC was 49,700 kg. The fuel at the top of the climb twenty five minutes later at 17:06:43 UTC was 43,800 kg (according to the ACARS report).
We both agree that your model shows a shortfall in fuel. You say your current model shows that “all fuel runs out in both tanks at about 00:10:45 or so”. Actually the fuel runs at at 00:09:30 UTC in your model, when you set the ZFW to 174,369 kg.
You argue that the fuel shortfall of 741 kg at 00:17:30 UTC in your model may be incorrect as your spreadsheet may not correctly track the fuel consumption after both tanks are empty at 00:10:45 UTC. I agree with your assessment, as I have noticed you allow the aircraft weight to go below the ZFW after the fuel runs out.
You then argue that, if the PDA is wrong, then it could wipe out any fuel shortfall in any case. You say you have accepted my value of the PDA as 1.5% without question. This is not my value, but the MAS Operations value for 9M-MRO. In the RMP Report Folder 5 Aircraft Records, you will find a copy of the Operational Flight Plan for MH370, which shows that the PDA or Fuel Factor used for the Fuel Calculations for the flight was “P1.5” (P = Percentage).
Apart from that we have the MHXX Engineering data from a recently previous flight of 9M-MRO as well as all the ACARS messages from MH371 with the Fuel Flow Rates for both engines throughout the climb, cruise and descent.
There is little question that the PDA is seriously wrong.
Even if you set the PDA to your preferred value of 1.0%, that 0.5% difference from 17:06:43 UTC is 43,800 kg x 0.5% = 219 kg.
The fuel rate you show at 00:09:30 UTC (PDA 1.5%, ZFW 174,369 kg) is 1.536 kg/s, so another 737 kg is required to reach 00:17:30 UTC. Subtracting 219 kg would give a fuel shortfall of 518kg.
The fuel rate you show at 00:11:30 UTC (PDA 1.0%, ZFW 174,369 kg) is 1.529 kg/s, so another 550 kg is required to reach 00:17:30 UTC. This value is slightly higher than the previous calculation.
Both the fuel based on a PDA of 1.5% and 1.0% show a fuel shortfall, whether by 741 kg, 737 kg, 518 kg or 550kg is irrelevant. All fuel shortfall values are more than 1 sigma error in fuel of 427 kg.
@David
I believe we should commit to finding aircraft and determine to the extent possible cause(s) and provide closure to the families. It could be a decades long search under some kind of joint industry funding formula or ticket fee.
Why do I feel that way morally? not sure exactly, but like the Moon landing there are side benefits of learning techniques and mapping sea floor etc. Even if the cause of the crash is nefarious, I am not sure why that negates the need to determine actions taken to engineer such a “mystery” and of course there is the outside chance there was other cause or more complex cause than we presume.
I am actually a little afraid to find MH370, because I think the perp might have taken steps to obscure what happened.
@Richard
you said:
“Some have said the FDR will only tell you what you already know, in other words where the plane is. That is not true, the FDR contains much more data than just position.”
I think most of us know that. The question is whether that additional info will lead to the determination of a cause of the diversion. My opinion is probably not.
I would like to know if the plane was depressurized, which the FDR would record. That piece of info would shed some light on the perps intent. It would be nice to know the details of the flight between IGARI and the FMT, but that would do little more than satisfy my curiousity. Give me an example of what piece of FDR data would be useful relative to finding the reason for an intentional diversion.
Regarding ICAO, and their policy of not assigning blame, I find paragraph 2.5 d) in the attached report interesting and unusual. It specicifically comments on the interfence of “political decision makers” in the early SAR activities.
IMO, these “political decision makers” were aware of what was going on.
https://www.icao.int/APAC/Meetings/2015%20APSARTF3/WP05%20ICAO%20Brief%20on%20the%20SAR%20Response%20to%20MH370.pdf
@DrB
Regarding the CTT 186 deg route, LRC FL370, with LEP around S37.5 deg, you wrote on April 1st, 11:02 pm:
“You will probably find a better fit at M0.84 (rather than LRC) and FL370 for 186 degrees CTT, based on our Figure 23. I also think CTT is much less likely than LNAV, and we did find that LNAV has a higher Route Probability than CTT at 186 degrees. There is insufficient fuel to fly this route, as we have already addressed numerous times on this blog and in our paper.”
Assuming that the criterion would be that we need to stay within the 1 sigma error range (0.43 tonne) for fuel shortage/surplus I arrived to CTT 183 deg at FL375 (LRC). This route has a 00:19 latitude close to S36.0 deg and has a fuel shortage of around 0.36 tonne according to my calculations (and scenario 5A).
Based on this and other path calculations, and assuming that the models and error estimates are really good, I can agree that S37 seems problematic in terms of fuel needed vs. most favorable scenario for fuel available. However, I don’t understand why your “fuel” probability function has such a sharp drop in the S34.0 – S35.0 range. It looks to me that you are effectively “cutting out” a series of fully feasible route candidates; feasible both in satcom data consistency as well as in fuel required vs. fuel available.
@Richard
I agree that the take-off fuel should have been 49,700kg, but I seem to have also made an error in the computation of the fuel imbalance. It should be 1.5×49700/2=372kg.
I provided a complete spread sheet for you to review to possibly identify any obvious errors the might be identified. However, you have made errors in criticizing my reasoning from the spread sheet data.
You state that: “You argue that the fuel shortfall of 741 kg at 00:17:30 UTC in your model may be incorrect as your spreadsheet may not correctly track the fuel consumption after both tanks are empty at 00:10:45 UTC. We both agree that your model shows a shortfall in fuel.”
I state (not argue) that the fuel consumption calculation is based on the contents of the two tanks, taking account of a composite PDA. At the time that the right tank becomes empty, the left tank has 372kg of fuel left. This time can be determined by inspecting the cells in MAIN col GJ and determining the time at which the total fuel left is equal to the unbalanced value. (for the 39000ft case, it is GJ1396, which is 00:06:15; for the 41000ft case it is GJ1402/3 which is about 00:08:07)
You state: “as I have noticed you allow the aircraft weight to go below the ZFW after the fuel runs out.”
I would like to point out that the spreadsheet does what it is programmed to do. It computes the fuel consumption assuming both engines are operating and continues to compute the fuel consumption even if the fuel is exhausted. When that happens, the FOB goes negative (red) and one could have inserted a test in the cells to suppress the data. But I have found it useful to allow it to proceed into vapor land.
So, let me restate the case: with a PDA=1.5:
At 39000ft, the REFE is 00:06:15. The residual fuel of 372kg is expended at a rate of 74kg/m, leading to a single-engine operating time of 5.02m. MEFE is then 00:11:16.
At 41000ft, the REFE is 00:08:07. The single engine operating time is 5.02m. MEFE is 00:13:08.
Since the operating altitude is 40000ft, let us linearly interpolate between the results and get a MEFE of 00:12:12UT.
I have, for a long time, taken the position that the cabin was depressurized during some or all of the period of one hour immediately preceding the log on at 18:25, and that the electrical load on at least the bus supplying the SDU was totally shed. Barry’s model does not take this into account.
At UGIA A.12 para 15, you estimate the fuel savings at FL390 at 1.56%. for air pacs off. During the one hour time period ending at 18:25 about 6300kg of fuel would have been consumed. Thus the fuel saving due to depressurization would be 1.56×6300=98kg.
The electrical busses were shut down during the one hour time period. I did not find an explicit value for the fuel savings associated with this case. But as a rough estimate, one could take the fuel consumption of the APU if it were operating (and it was not) as 60kg/h to represent the burden of the electrical load. We save another 60kg/h.
So, adding the 98kg and the 60kg, shutting down the electrical systems and depressurizing the plane for one hour saves 158kg of fuel with respect to the base case computed in the spread sheet. At the single engine maximum continuous thrust fuel consumption rate of 74kg/m, this results in an additional 2:08m of operating time prior to MEFE.
The result is 00:12:12 + 2:08= 00:14:20UT.
For comparison purposes, we accept the MEFE as 00:17:30UT, and find that we are apparently 3:10 short. At the single engine fuel consumption rate of 74kg/m, this means that our estimated fuel shortfall is 160kg.
I find it difficult to be doing such precise computations given the limitations on the accuracy of the underlying data, but it serves to show that with reasonable values adopted the fuel is adequate to reach the 7th arc on the 186T path.
@Sid Bennett
Yesterday you claim your software does not work after fuel exhaustion.
“The value at later times is clearly erroneous as the engines have shut down and no account of the savings for one engine operation has been taken. The spread sheet design did not anticipate that fuel consumption would be considered a significant discriminant.”
Today you claim your software does work after fuel exhaustion.
“I would like to point out that the spreadsheet does what it is programmed to do. It computes the fuel consumption assuming both engines are operating and continues to compute the fuel consumption even if the fuel is exhausted.”</i"
You cannot have it both ways, either your software works or it does not work.
If your software works, then the fuel on board at 00:17:30 UTC is -741 kg (PDA 1.5%, ZFW 174,369 kg).
If your software does not work, then continuing this discussion is futile.
@Richard
Please take this seriously.
The spreadsheet computes the expenditure of fuel every 15seconds using the parameters
@RICHARD
Please take this seriously.
The spreadsheet computes the expenditure of fuel every 15 seconds using the parameters corresponding the the lat/long. (you know, M, temp, winds etc.). The location at any given time is computed in a manner that you are well familiar with and accept. The path is the controlling function, the resultant FOB is what would obtain if the path was flown and the fuel consumption were computed on a 15 second increment. All a negative number means is that (for the condition that BOTH ENGINES ARE OPERATING NORMALLY and the M is in accordance with LRC etc.) the fuel does not last until 00:19, for example.
The exact quantity of fuel at any time before fuel exhaustion (e.g., 00:05:00)is found in Main col GJ.
I am describing in detail a hand calculation I make for the case of a fuel imbalance between the right and left fuel tanks. You understand this situation quite well.
If it befuddles you, I will address the question to Dr.B.
@DrB
I didn’t intend my remark about “setting the autopilot and sleeping” to be snarky, sorry. I know there is much debate about whether the aircraft just entered a classic spiral dive at the end or was actively controlled.
@George G
Thanks for your comments.
I accept that it is not possible for the pilot to know about the arcs and to plan a flight path on that basis. The arcs locations and arc crossing BTO/BFO data only became a reality as the actual flight unfolded. But is is reality.
The question I am asking is whether it is possible (not necessarily probable) that a pilot could have actively engage in a some holding or s-turns along a planned flight path. The pilot would know that if he sets a fixed course and flies to fuel exhaustion the duration and range problems become linked. If the pilot engages in a cumulative one hour of holding along the way that introduces 480 miles of uncertainty in trying to locate the aircraft. Maybe he did this. Most people believe the flight was passive.
If the pilot flew along a flight path, for example, with the objective of hitting zero fuel near the location where the future arc 7 intersects with say S25.0, the aircraft would have excess fuel at the point. There are good reasons not to dump fuel. So the pilot could just engage in a few holding patterns along the way. Is it possible that this exact flight generated the recorded BTO/BFO data? The forward probability of this would be zero, but is it even possible to find a viable fit after the fact. Reality may have a zero probability of occurring in advance as long as it is possible.
@Richard. Thank you.
@Niels,
You said: “Based on this and other path calculations, and assuming that the models and error estimates are really good, I can agree that S37 seems problematic in terms of fuel needed vs. most favorable scenario for fuel available. However, I don’t understand why your “fuel” probability function has such a sharp drop in the S34.0 – S35.0 range. It looks to me that you are effectively “cutting out” a series of fully feasible route candidates; feasible both in satcom data consistency as well as in fuel required vs. fuel available.”
The simple answer is that none of those routes are actually “feasible both in satcom data consistency as well as in fuel . . . .” when you use all the available statistical metrics, as we have done in the route probability.
The sharp cutoff in fuel probability is simply what you get when you optimize the route probability for each bearing value. As I have demonstrated, the route probability is a much more selective objective function for SIO Route fitting than just using BTORs and BFORs, by about an order of magnitude. It is also true that less-than optimum route fits can have somewhat higher fuel probabilities, but the route probability inevitably suffers when one picks a lower-than optimum speed for bearings greater than 180 degrees. This also occurs at 186 degrees when using LRC, which is too slow to achieve a good route probability. So, in the region greater than 180 degrees bearing, the only way to raise the fuel probability into the acceptable range is to fly too slowly, which degrades the route probability into the unacceptable range.
@TBill. “I believe we should commit to finding aircraft and determine to the extent possible cause(s) and provide closure to the families.”
Finding the wreckage might be all that families want. Many might not be keen on disturbing it, seeking evidence.
I have made some final small changes to improve what I wrote. A little late I know but I mention it in case someone might like to update any download.
@DrB
Your assertions about the 186T route are not consistent with my simulations.
Earlier, I had determined the needed TAS by varying M at a fixed height. In response to criticism of this approach, I adopted LRC at 39000ft and the most detailed results were posted several days ago. In my previous post, I estimated the fuel requirements at 40000ft and found that they were within you error bounds for a plausible pre 18:22 scenario.
I await a response other than simply saying that you disagree with me.
Niels says:
April 4, 2020 at 11:16 am
QUOTE: I don’t understand why your “fuel” probability function has such a sharp drop in the S34.0 – S35.0 range. END Quote.
Niels, this is why I am slowly (very slowly, in the last few days) and progressively developing an overview of fuel usage by developing an overall (simplistic, I hope) overview of the whole problem, as much as possible devoid of bias from past efforts, which latter is of course not really possible.
Naturally, the aircraft could not have proceeded past fuel exhaustion, excepting as concerns “End of Flight Scenarios” which I am considering to be a separate subject.
However, I do not see how the probability can have such a clean cut-off as indicated by Figure D-3 in the report. This is most noticeable in the range S34.0 to S34.5. I do not see (have not seen) a clear explanation for this in the report.
In fact I do not think it does have such a clean cut-off.
So, Dear Authors, you may need to argue why such a clean cut-off, and provide clear evidence for such. In the meantime I will proceed, annoyingly, to investigate whether or not it is really justified.
Niels: And you say: QUOTE: It looks to me that you are effectively “cutting out” a series of fully feasible route candidates; feasible both in satcom data consistency as well as in fuel required vs. fuel available. END Quote. May I re-phrase this : It seems to me (George) that there may be some inadvertent aspect of the analysis which truncates the fuel usage analysis so dramatically. We must remove any doubt, if that is possible.
@DrB
I refreshed before I sent off the comment above addressed to Niels.
I started that last night and completed this morning.
Your answer may provide some details not previously covered, but I have sent my prepared post anyway.
If after review of your answer I find other than declarations, then I will respond accordingly.
Regards,
For each Singular Ending Latitude
There is a singular likely Bearing
And a singular likely Arc 2 Crossing Point
(hence starting Latitude, Longitude)
For each of these (infinite number of) Singular Ending Latitudes there is an optimum set of flight considerations for an Optimum “Straight-Line” flight path.
Having obtained (statistically determined) this set of Optimum “Straight-Line” flight paths, for each and every one there is a resultant SINGULAR fuel usage (consumption from the time 19:41:03 through to extinction) for Each and EVERY member of the set of Optimum “Straight-Line” flight paths.
This set of Singular Fuel Usages was used as a reference in construction of Figure D-3.
Am I right ?
I have been reading ‘ALL’ these posts and Dr. Duncan Steel’s blog for years. I believe that ‘several folks’ on this blog are semi frustrated; Heck, for once, I even sided with DennisW 🙂 …
I believe ‘insults’ and derogatory comments towards ‘Richard’ only hurts the cause; Recently, I witnessed 9 or more FAA folks that ‘cared about this topic’ subsequently retire. Just ‘hurry up a bit’ before there is ‘no one left’ who cares that can ‘modify policy that can reduce or prevent’ this occurrence again…Signed by a ‘miner league’ ‘miner’…lol…CPS
AND using your Fuel Model developed in Appendix A, Validated per Appendix B and used to prepare Appendix D.
@Carter Swenson: Thank you for the comment. We’d love to have more FAA individuals contribute. We’d be very interested to hear your perspective of the article and report.
@Carter:
I’m not sure why you think Richard is getting beaten up here [Sid and his model may be, but that’s another matter and grounded on the facts of the matter]. Richard merely presented his opinion that finding the wreckage and the recorders is a matter of moral urgency and legal necessity, and I suggested that a rational actor might disagree, in other words, taking a utilitarian stance. A couple other posters responded somewhere in the middle. Was there a derogatory, or even snarky, stance here that I’m missing?
@DrB
You wrote:”So, in the region greater than 180 degrees bearing, the only way to raise the fuel probability into the acceptable range is to fly too slowly, which degrades the route probability into the unacceptable range.”
Refering to your table shared in comment:
https://mh370.radiantphysics.com/2020/03/09/new-report-released-for-mh370-search/#comment-27425
Take for example your trial 707, with route probability .908 and ending S35.54. It has an initial bearing of 182 deg and FL374.
What would be the required fuel at 19:41 according to your calculations?
A second point I would like to address / discuss, you wrote:
“The sharp cutoff in fuel probability is simply what you get when you optimize the route probability for each bearing value. As I have demonstrated, the route probability is a much more selective objective function for SIO Route fitting than just using BTORs and BFORs, by about an order of magnitude. It is also true that less-than optimum route fits can have somewhat higher fuel probabilities, but the route probability inevitably suffers when one picks a lower-than optimum speed for bearings greater than 180 degrees”
I’m trying to understand what that means for the independence of “fuel” probability function from the “route” probability function.
@Carter Swenson
You state “I believe ‘insults’ and derogatory comments towards ‘Richard’ only hurts the cause”
Thank you for the kind words and they are well meant, but …
I disagree!
Even if, Richard is not a “rational actor” (@lkr), refers to things that are “odd” (@lkr), is squandering “limitless resources” (@lkr), is proposing a new search to finally determine the cause of the accident where “it seems distinctly possible that finding the wreckage will not further that determination anyway” (@David), “when it is unlikely to add anything useful to aircraft safety” (@David), is riding roughshod over the sensitivities and “opinions of families and friends as to whether the gravesite should be disturbed and any remains or personal effects recovered” (@David), is not taking this “seriously” (@Sid) and is “befuddled” (@Sid), is irrelevant.
Insults and derogatory comments towards Richard have nothing to do with the fact that we need to ensure that such an event as MH370 does not happen again. This common blog practice of insults and derogatory comments is fallacious because the personal character of an individual is logically irrelevant to the truth or falseness of the argument itself. In my view, this so-called ‘argumentum ad hominem’ is the lowest form of discussion and debate.
@lkr: I fully accept that there is a balance between the “moral urgency”, “legal necessity” and “a utilitarian stance”.
@David: I fully accept that “it would be useful were eminent suicide-homicide mental experts asked to confirm or otherwise” whether the public statements by ZS are relevant evidence and that measures introduced after 9/11 and Germanwings were partly “ineffective” and counter productive and “if such a door had not been fitted to the Lubitz aircraft [or MH370] that accident may have been prevented”.
@Sid: I fully accept that the FMT route remains “the weakest aspect of [our] case”, that MH370 “would have been observed over the Straits of Molocca [sic] by Thai and Indonesian Military radar and that “No such observation was reported” other than by the Malaysian Military radar (and then only after the event) and that the eye witness sighting by Kate Tee is not evidence of the flight path of MH370.
The co-authors of the report, published in this article, have spent over a year analysing MH370 and preparing the paper for publication. We do so, in order to help solve the world’s greatest aviation mystery.
It is a self evident truth, that every effort must be made to ensure that such a tragedy does not occur again. On this point, I fully agree with Carter Swenson.
Carter Swenson’s concern is that there are fewer and fewer people left at the FAA and soon there will be “‘no one left’ who cares that can ‘modify policy that can reduce or prevent’ this occurrence again”.
lkr’s reference to a “rational actor” equates to an ad hominem attack on @richard as irrational? I didn’t think so, but now that @richard has drawn our attention to a list of insults and derogatory inputs apparently masquerading as neutral commentary, I have to agree with him that there must be a good reason for his paranoia.
@paul smithson
Many thanks! I add your comment to the list of examples of discussion and debate of the lowest form.
@Richard,
“Closure” means different things to different people. Finding the wreckage is a step in that direction (for me). From the beginning (Duncan days), the motivation for the diversion had been considered “out of bounds” for this group, and I think that is still the reality.
@all
I am an original member of the IG. We may have different motivations to contribute to this work and different views on what the recovery of the black boxes would accomplish.
But, if the purpose remains to provide reasoned public advice to the authorities/companies who have to make the decisions regarding further searches, we must maintain civility and scientific discourse.
@Richard
Thank you for your remarks. It should be clear that we all have made supportive and favorable remarks on the recent paper, and I give it full credit for what it has done for this community. The assemblage of analysis, details and analysis has significantly advanced out understanding of the problem.
Moreover, I do not think that there has been a challenge to your proposed route (including the low and slow portion) on technical grounds.
However, I believe that it is not harassment to make a case that there is another route that is consistent with the known technical data.
I still remember our dinner in a little town in Germany some years ago.
@lkr
Thank you for your comments. I have tried to be completely open about the model I use. The latest runs of the model have been published to this blog, and any recent changes I have made to the parameters (not the code)have been in response to the constructive criticism that has ensued. I have also made efforts to reduce the difference between the parameters I use and those Richard et al. use so as to improve the comparability.
That I cite to UGIA for specific data and analysis results is not criticism, but an acknowledgement of its usefulness in the discussions.
Let’s get back to the actual topic.
@Sid Bennett: However, I believe that it is not harassment to make a case that there is another route that is consistent with the known technical data.
We are not converging.
The uniqueness of the proposed route includes statistical metrics based on the randomness of the calculated errors, as well as an advanced fuel model. Bobby has explained that the additional statistical metrics greatly improve (by a factor of 10) the discrimination of acceptable and unacceptable routes, which combined with the fuel model (and the drift model), rejects the path that the IG proposed back in July 2014.
The purpose of this blog was never to reach a consensus of the contributors, which I think is impossible for a group of this type. Rather, it is to exchange ideas and to provide peer review of work.
Unlike how the IG operated, contributors are free to release their recommendations to whomever they desire, whether or not there is consensus. Bobby, Richard, Andrew, and I have already done that. Others may choose to do the same.
All,
I have written a report explaining as best I can why the LEP is not known with the level of precision claimed in the UGIB report, although at this point I doubt I will change anyone’s mind.
https://drive.google.com/open?id=1lQz9iFjBH3YASQ1wV35UvVI3d20AdZqC
I have been asked whether I considered the various statistics involving the correlation of the BTORs with other quantities. In fact, I looked at the correlation with UT nearly 4 years ago, found it no where near as useful as the BFO correlation with UT, and turned the calculation off. I have looked at it again, this time computing the Spearman, Pearson, and Kendall correlation coefficients, and still don’t find it particularly useful, at least for the purposes of the report.
@Niels,
You asked: “Take for example your trial 707, with route probability .908 and ending S35.54. It has an initial bearing of 182 deg and FL374. What would be the required fuel at 19:41 according to your calculations?”
At 19:41 the required fuel for Trial 707 is 27,659 kg. The fuel probability is 14%.
You also said: “I’m trying to understand what that means for the independence of “fuel” probability function from the “route” probability function.”
They are not independent. For instance, changing Mach affects both the route probability and the fuel probability. However, that dependence is quite complex. It depends on many of the flight parameters, including speed, bearing, SAT, etc.
@DrB
You wrote:”At 19:41 the required fuel for Trial 707 is 27,659 kg. The fuel probability is 14%.”
Isn’t this for air conditioning packs on (at least I’m getting a value very close under that assumption).
What would be the required fuel with air packs off, and what would then be the route and fuel probabilities?
@Sid Bennett
I have tried to show your proposed MH370 flight path at 186° is not possible, because there is insufficient fuel.
You maintain the fuel shortfall is small and is not significant.
I tried to show you the fuel shortfall using your own spreadsheet is larger than the predicted fuel error budget for the whole route, but you did not accept this.
The essential problem with your spreadsheet is that it was designed for a flight model that fits the satellite data but not a fuel model.
You stated “The spread sheet design did not anticipate that fuel consumption would be considered a significant discriminant.”
On top of this your spreadsheet does not account for the following:
(1) Fuel for climbs.
(2) Extra fuel for turns.
(3) Different flow flow rates for each engine and quantities in each fuel tank.
(4) The ∂SAT is out by up to 1.7°C.
(5) ∂TAT is not calculated.
(6) Radiosonde data is not used.
(9) The tailwinds are out by up to 3.5 knots.
As Victor has said, we are not converging and at this point I can help you no further.
@sk999
Thoughtful post, thank you. In addition to the dispersion of the LEP shown in your Figure 4, the entire region shown in your Figure 4 has been searched. That fact also makes it difficult to embrace another search.
“The Malaysian Government, rightly in our view, set a high bar before they will engage in that discussion.” – Oliver Plunkett, CEO Ocean Infinity, Feb 20, 2020.
Spending is a zero sum game. $100M dedicated to infrastructure improvements will benefit more Malaysians than finding the aircraft wreckage (assuming a no find / no fee arrangement as previously). It would be very difficult to fund a search on a pay as you go basis.
@Richard. You have explained that your use of the word “must” was influenced emotionally, being taken from your video.
Understandably this has been an emotional time for you.
Even so I feel bound to emphasise that the previous need for a further search, for flight safety reasons, has been affected just now by Sabine Lechtenfeld’s interpretation of the Zaharie posts. As it stands that has lifted the likelihood of him having been the instigator and, in my opinion, considerably. So as I see it what now is being sought in a new search is confirmation of that. While such confirmation might prompt new thinking on the subject, that would be in the context that already it has been examined comprehensively and in recent times.
The merits of a new search depend on the gain versus not just the effort and expense but, if the wreckage is located, risk that the recovery of the recorders and a few other items will be insufficient. That might then require a wreckage and human remains recovery as foreshadowed by the ATSB’s ‘Operational Search for MH370’ (despite the AF447 experience). There is always the risk too that the confidence the wreckage will be found proves to be misplaced. These are cautionary notes.
I hope you do not see my drawing together these points as having an ad-hominem character; but should you, let me know please and I will desist from raising this with you.
Finally, I point out that if your paper satisfies the formal ‘new evidence’ criterion needed to resume the search it should go ahead anyway.
DennisW,
You commented: “… the entire region shown in your Figure 4 has been searched. That fact also makes it difficult to embrace another search.”
Maybe. Maybe not. Here’s a curious story you may know about. A person by the name of Paul Miller disappeared almost 2 years ago in Joshua Tree National Park. Searchers started looking for him within hours of when he failed to return. You can find the story online, so I won’t repeat. His bones were found about 4 months ago, not far from the route of his planned hike. In retrospect, in spite of the fact that the area where he disappeared is open country, searchers passed within 60 feet of where he was located and failed to spot him. It took aerial photography from drones and crowd-sourced examination of those photos to finally locate him.
The fact that an area has been “searched” does not mean that the plane ain’t there.
@sk999
The fact that an area has been “searched” does not mean that the plane ain’t there.
Of course, and that is not what I said. A previous search simply lowers the likelihood of the wreckage being in the area searched in accordance with well-accepted Bayesian statistics.
@sk999
BTW, your hiker story implies you think I am an idiot. Thanks alot. 🙂
@David
I thanked you for your paper “About the need to search again” and I thank you now for your thoughtful comment.
To be completely transparent with you, I felt you were trying to portray me in a bad light in your paper by implying, that I was pushing for a renewed search, irrespective of whether or not:
(1) it would help determine the cause of the accident or add to aircraft safety.
(2) the NOK wanted the gravesite disturbed.
I have answered both points and made it clear that I had considered both the ICAO regulations and the feelings of the families.
Your view, which I respect, is that a renewed search is unlikely to add to aircraft safety and it is distinctly possible will not help determine the cause of the accident. I disagree.
Your view, which I respect, is that a renewed search brings the possibility that the families having been re-sensitised, will be disappointed and frustrated once more. I disagree.
We will have to agree to disagree on both points.
@Carter Swenson, who is a neutral observer, pointed out “I believe ‘insults’ and derogatory comments towards ‘Richard’ only hurts the cause”.
In my response to Carter I disagreed, saying that even if his observation is true, it is irrelevant to the fact, that every effort must be made to ensure, that such a tragedy does not happen again.
@lkr responded to @Carter Swenson “I’m not sure why you think Richard is getting beaten up”.
@paul smithson, who is a neutral observer, concludes that I am paranoid, having twisted the implication from @lkr that I was not a “rational actor”, into a statement from @lkr that I was “irrational”.
The bottom line is, that I am sure you agree with me, that such a tragedy should not happen again.
@Niels,
You asked in your previous comment:
“You wrote: ”At 19:41 the required fuel for Trial 707 is 27,659 kg. The fuel probability is 14%.”
Isn’t this for air conditioning packs on (at least I’m getting a value very close under that assumption).
What would be the required fuel with air packs off, and what would then be the route and fuel probabilities?”
Yes, that value of fuel required is assuming the air packs are on, and the cross-feed valves are closed. This is Option A in our Table D-4. It was used for the route bearing study as the baseline case.
That same table indicates that Option B1, which has the air packs off and the cross-feed valves closed, requires 452 kg less fuel than Option A.
Our method of estimating fuel probability employs the evaluation of four post-19:41 aircraft configurations (Options A, B1, B2, and C) as shown in Table D-4 in Appendix D. We estimate the fuel probability using the smallest fuel shortfall/excess among the four options (and compared with the nine “available fuel” cases). In this situation, the smallest fuel shortfall is for Option B1, which has the air packs off and the cross-feed valves open. This option has the highest fuel probability – which is the 14% previously quoted. The fuel probability won’t change if one computes and analyzes the case with the air packs off, since this possibility is already considered as one of the allowed configuration options when finding the maximum fuel probability.
So, the short answer is the fuel probability is the same 14%. It was too complicated to keep track of four fuel probabilities for each route, so we simply selected the highest one among the four post-19:41 configuration options.
I have not fit that particular route with the air packs off, but in other cases where I have done that comparison the change in (maximumized) route probability was quite small. I expect the same in this case. One can understand this, because the slight reduction in aircraft Mach due to a very slight reduction in weight can be compensated by a slight reduction in flight level to keep the KTAS constant (which then keeps the route probability the same).
So, the very short answer is that neither the route nor the fuel probabilities change materially.
You will understand that the route fitting method described in our paper first found the highest route probability (at a given bearing, for instance). Later, we selected the highest fuel probability for that same route among the four post-19:41 configuration options and the nine pre-19:41 cases of available fuel. Recently, I have been exploring what happens when one fits the route parameters to maximize the product of the route and fuel probabilities. This was not possible at the time we did the route fits (by maximizing route probability), because we did not have a validated fuel model nor a thorough understanding of the impacts of the post-19:41 configurations on the fuel consumption. Now we have both. My initial comparison of the two objective functions, namely route probability or the product of route and fuel probabilities, was done recently circa 180 degrees, within the main central peak of the route probability function. Those results indicated there was no material difference in overall probability between the two objective functions. Since then, I have been looking at bearings outside that main central peak. Preliminarily, I see indications that there exist “compromise routes” in which the the product of route and fuel probabilities actually has a discernible peak which is not the same as the peaks of either the route or the fuel probability. I don’t expect those compound probabilities found using this new method will be as large as the 180 degree bearing case, so I don’t think the answer will change. However, it is possible the steep slope of the current fuel probability curve will be lessened using this new method, and the fuel probability for bearings greater than 180 degrees may increase. That will be accompanied, of course, by reductions in the route probability at those bearings. For bearings less than 180 degrees, where the fuel probability is generally very high, the overall probabilities won’t change materially between the two objective functions.
@Report Authors
In appendix D on page 114 you noted “Based on the smooth variation in BTO and BFO from 19:41 to 00:11, it became apparent early on that the SIO Route could have been flown in auto-pilot with no significant manoeuvres. If that were not the case, then it would be impossible to determine the true SIO Route, because there would be a very large number of matches to the limited satellite data if manoeuvres were allowed at arbitrary times.”
This is the point I have been trying to make. I believe that the direct 180 route to cross at S34.3 is highly likely because of its simplicity. And your report clearly shows this as the optimal autopilot solution.
However, the existence of a viable autopilot solution does not eliminate the possibility that a maneuvering route could have happened, so the qualifier “if that were not the case” is not really relevant.
You have clearly presented the optimal autopilot solution and I am not suggesting trying to find a maneuvering example. But if the aircraft is found someday above the S34.3 intercept it would have required maneuvering or fuel dumping.
I will not bring up maneuvering again because you have clearly addressed it in the report.
@Hank
“…it would have required maneuvering or fuel dumping.”
There is also the addl possibility that Arc7 was not end of fuel supply, so the aircraft kept going. inclusive of some extmargin of error due to various assumptions, and long glide after fuel exhaustion. That’s where I am afraid MH370 is, somewhere in that larger envelope. In other words, we could use the fuel model to map out the largest possible (worst case scenario) search areara
@TBill
Your suggestion above is difficult to reconcile with end of flight BFO values, and failure of inflight entertainment system login.
The only scenario that fits the observables is a terminus close to the 7th arc.
@DrB
That’s a long answer to a rather short question; much appreciated!
The exact procedure you followed is now getting much clearer, and I’ll take some time before reacting more in depth on your approach.
Regarding the LRC FL374 example:
Meanwhile I improved my “air packs off” calculation accuracy (FF reduction is now a function of FL) and I get for FL374, LRC:
air packs on: 19:41 weight 201.89 tonne
air packs off: 19:41 weight 201.42 tonne
I think that is rather close to your options A resp. B1 configuration values for this FL.
The 201.42 tonne results in 13% fuel probability using your formula (you reported 14%), when combined with Case 5A.
The product of route probability and fuel probability is then indeed not very high. It could possibly be higher if you trade route probability vs. fuel probability (slightly higher FL?). Also, I think case 5A is not necessarily the most efficient scenario and doesn’t fit very well to routes ending between S35.0 and S36.0. The pre-19:41 scenario I’m now looking at is based on your proposed route, with a descent to about FL250 (to avoid other traffic) in stead of FL100, and a direct (“diagonal”) connection from NOPEK to BEDAX.
@Victor
I am making this post in response to Richard’s specific criticisms so as to complete the exchange. I would be happy to continue to discuss the differences, as we are narrowing the number of issues where there is an apparent disagreement, but that is entirely up to Richard.
In order to reduce the number of long posts to the blog, I am happy if you disclose my email address to any regular user of this blog.
@Richard
To reiterate, the spread sheet does not incorporate a separate fuel flow model for each engine. The only time that this is of consequence is at the time of fuel exhaustion where one tank still has fuel. Since this is a later arising issue I have dealt with it in my recent posts using a hand calculation. I will ask Barry if he has the time to insert the end game algorithm which I have developed.
Nevertheless, you continue to ignore this fact and merely recited the un-adjusted two-engine FOB output of the spread sheet.
My premise is that the path calculation using the satellite data governs the path to be flown, and the fuel consumption is computed along that specific path. So the fuel consumption is valid only along the most probable path, and only until fuel exhaustion in accordance with the specific algorithm of the model.
I recently re-did my study of azimuth versus cost function for LRC and, as expected, the function has a much narrower peak, with the 10% values of the distribution lying between 185.7 and 186.3. I will publish it later when I have revised my paper. The effect of varying the M so as to have the plane reach the 6th arc on time has been eliminated. Now, when the plane overflies the 6th arc prior to 00:11 or does not reach the 6th arc by 00:11, the effect is seen quantitatively in the BTO error value in the cost function.
Nothing in my remarks should in any way be interpreted as challenging the technical accuracy of your proposed 180T path including a low-level segment.
My only, albeit contentious, conclusion is that there is a wholly high-altitude route. I believe you would agree that there is not a convincing high-altitude route at 180T.
Your critiques of my posts continue to improve my understanding and to inform my recent work.
1. Extra fuel for climbs: There are no climbs or descents in the scenario path from 18:22 to 00:11, except for a minor descent possible of 500ft for traffic clearance. We therefore assume that such a minor descent did not happen. Nor is there a step climb profile that might have been used to reduce fuel consumption.
2. Extra fuel for turns: In UGIB A.2, the effect of turns on FF is dismissed as small, although you include it. The path I describe includes the offset turns and the FMT all made at a standard rate. Your table C-2 indicates that no correction is needed at altitude for the turns.
3. The difference in average fuel flow rates is embodied in the PDA where I have used 1.5. I believe that the initial fuel loadings were within 100kg, at least according to the data provided. That is nominally 1 minute flying time. I am revisiting my corrections for air pack off and electrical off to consider the effects on MEFE in more detail.
4. SAT out: Is this the mean data I sent to Victor or the peak error between the two models for which I provided graphs? Regardless, I was prompted to hand check the temperature against the computed TAS and determined that I had taken the T values from the wrong column. The ones I gave previously are 2 degK too high at 39000ft. For example the value at 18:39:30 is 218.7K, corresponding to 484.1kn TAS. Thanks for checking.
5. TAT not computed. If I understand your appendix A.1 UGIB) the total effect of using the TAT is to multiply the PDA of 1.5 by a factor of 1.016. This seems negligible in terms of the error budget.
6. Radiosonde data not used: All of the modeled flight path is above the tropopause and the data is not used.
7. -8. (omitted from your list.)
9. Tailwinds out: : Is this the mean data I sent to Victor or the peak error between the two models? If it is the peak error, what is the average error? I assume you are comparing your data at 40kft with my data at 39kft, but no matter. At a mean error of 3.5kts, and a flight time of 5.5h from the FMT, this results in a maximum error of 19.25 nm in range, which at 484kt represents a flying time of 2.4mins. This is the upper limit on the effect. If the average wind difference is used, it should be much smaller.
I do think we are converging.
@Richard. Thank you. For my part I will leave it there.
@Sid Bennett
Your assumption is incorrect.
I not only looked at your model, I also rebuilt your flight path using your Timings, Positions, Altitudes and Bearings in my model (even though my results were different to yours).
I effectively overwrote and disregarded my Navigation model, including a Vincenty model.
I noted differences in the start point on N571, 10 NM beyond waypoint MEKAR, at 18:22:12 UTC (or 18:22:15 UTC which you use), the lateral offset, the position and timing of the FMT near IGOGU, the turn bank angle at the FMT and the initial bearing toward way point ISBIX, all of which I ignored.
I kept my Weather model, Mach model, Fuel model and Satellite Model.
I noted differences in the SAT, TAT, Mach, TAS, Wind Speed, Wind Direction, GS, ∂SAT, ∂TAT, Aircraft Weight and Fuel used at each point along your route.
I also noted differences in the BTORs, BFORs, fuel used to climb from 39,000 feet to 39,300 feet, the fuel used during the FMT turn and the altitude, temperature and pressure at the base of the stratosphere from the radiosonde data.
@DrB
@Niels
I having been preparing in my mind, in scribbles, and in Excel, etc, a note on Trial 707 (perhaps as a test case or specific example) and your DrB LRC Table 2020.03.20, in order to ask questions which may assist in my understanding, and I will append that note here,
but (DrB) following on from your most recent Comment-27798 of April 6, 2020 at 11:16 am –
You have written (posted): “In this situation, the smallest fuel shortfall is for Option B1, which has the air packs off and the cross-feed valves open.” whereas methinks you meant to write “cross-feed valves closed”. For the record.
DrB, you write: “Recently, I have been exploring what happens when one fits the route parameters to maximize the product of the route and fuel probabilities.” and that this consideration is with hindsight given the extensive fuel analysis conducted since the initial route fit analysis.
Fuel availability is a maximum at what I choose to call Scenario 11B1, which simply assumes Bleed Air Off for all time after the initial deviation (climb) from FL350, assumed at 17:26:00 for consistency with your report. Hence Scenario 11B1 is nothing but a natural extension from consideration of Scenario 5B1 of your report through 7B1 to 11B1. The calculated fuel shortfall is 27 kg for the combination of the Pre-19:41 “no-descent” FMT Route, in the terms of the report, and the 180 degree BEDAX SIO Route.
The above scenario thus considers there to have been 2 ¼ hours between when the Bleed Air was first switched off and when Arc 2 was crossed. Nothing is offered here concerning how the some of time between 18:22:12 was consumed and how long before 19:41 the final heading was achieved.
As recently briefly discussed or suggested here, it may remain to estimate atypical reduced electrical loading, and its effect on estimation of fuel availability. Without another review I’m not sure whether this was covered in Appendix A, or whether it would have any significant effect on fuel availibility estimates. I, for one, will review this, soon.
And, now, please bear with me:
@DrB
@Niels
References: DrB LRC Table 2020.03.20 and “The Final Resting Place”
The table is of a set of Optimum “Straight-Line” flight paths.
Please correct me if my interpretation is wrong.
The table shows a tendency for the Optimum Flight Level to be dependent upon the Flight Bearing.
In particular, for the set of Optimums tabled, the Optimum Flight Level consistently reduces as the sampled Flight Bearing is increased. [With the exception that FL403 is optimum both for 178.0 and 178.25 Degrees Bearing.]
The link below is to a subset graph of the relationship between FL and Bearing.
This is no more than a re-plot of the data from your table for LRC, and is the same as that shown in Figure G-8, the Airspeed and Flight Level Sensitivity Study, and in Figure 23 of your report. It has been re-plotted simply to possibly assist in my understanding.
Q1: Why the dependency ?
Q2: Can it be explained in simple terms ?
Q3: Which parameters contribute most to this tendency ?
Q4: Are the strong winds evident towards the latter stages of the flight, and contributing to more headwind component as the bearing tends more and more westward, considered a major contribution to this tendency ?
Q5: Following on from Q5 if the winds are a large contributor, are the winds less strong at the lower altitudes (say FL374 compared to FL395) when the aircraft is more southward in the latter stages of the flight ?
Comment: Looking at the simple plot, it becomes fairly obvious why the required fuel will increase markedly as the Flight Bearing changes from below, through, and to above 180 degrees. Hence the Fuel Probability WILL drop dramatically over a small range of any Optimum “Straight-Line” Flight Path descriptor, such as Bearing.
Reason: As the Flight Bearing changes from below, through, and to above 180 degrees and the Optimum Flight Level reduces then the increase in air density at the lower altitude will require more engine thrust and thus fuel to punch the aircraft through the more dense air at Long Range Cruise speed, which itself will be relatively unaffected due to being in a region of relatively unaffected standard atmospheric temperature.
https://www.dropbox.com/s/coi416lom0xx51o/LRC%20FLvsBrg.xlsx?dl=0
@George G,
You said: “You have written (posted): “In this situation, the smallest fuel shortfall is for Option B1, which has the air packs off and the cross-feed valves open.” whereas methinks you meant to write “cross-feed valves closed”.”
Yes. Option B1 has the cross-feed valves closed.
You asked: “The table shows a tendency for the Optimum Flight Level to be dependent upon the Flight Bearing.
In particular, for the set of Optimums tabled, the Optimum Flight Level consistently reduces as the sampled Flight Bearing is increased. [With the exception that FL403 is optimum both for 178.0 and 178.25 Degrees Bearing.]
The link below is to a subset graph of the relationship between FL and Bearing.
This is no more than a re-plot of the data from your table for LRC, and is the same as that shown in Figure G-8, the Airspeed and Flight Level Sensitivity Study, and in Figure 23 of your report. It has been re-plotted simply to possibly assist in my understanding.
Q1: Why the dependency ?
Q2: Can it be explained in simple terms ?
Q3: Which parameters contribute most to this tendency ?
Q4: Are the strong winds evident towards the latter stages of the flight, and contributing to more headwind component as the bearing tends more and more westward, considered a major contribution to this tendency ?
Q5: Following on from Q5 if the winds are a large contributor, are the winds less strong at the lower altitudes (say FL374 compared to FL395) when the aircraft is more southward in the latter stages of the flight ?”
My responses below are numbered to match your questions.
1. An increasing TAS is needed for bearings greater than 180 degrees, in order to match the handshake arc locations. This effect would not exist if all the arcs were concentric, in which case the average KTAS would be constant. So, we are fortunate that the satellite was moving during the flight, because otherwise it would be very difficult to discriminate bearing. The only remaining asymnmetry would be the position-dependent weather conditions, and this is unlikely to provide effective route discrimination on its own.
2. See #1.
3. The non-concentricity of the arcs is dominant. A lesser effect is the increasing headwinds late in the flight for bearings greater than 180 degrees. That requires a higher KTAS to overcome. This is partially accomplished by using M0.84 rather than LRC. The two speed schedules are nearly identical, except when the fuel load is light, when LRC reduces the Mach below M0.84. Additional increases in KTAS are provided by reducing the altitude to warmer air, when the Local Sound Speed is higher. Both effects increase the average fuel flow.
4. See #3.
5. The variation in headwinds after the second phone call at 23:14 is negligible between FL374 and FL395 at 186 degrees bearing.
Richard said:
“I noted differences in the start point on N571, 10 NM beyond waypoint MEKAR, at 18:22:12 UTC (or 18:22:15 UTC which you use), the lateral offset, the position and timing of the FMT near IGOGU, the turn bank angle at the FMT and the initial bearing toward way point ISBIX, all of which I ignored.”
I say: I can’t tell what “all of which I ignore” refers to. I think you mean that where your path simulation, for example, differs from my simulation you ignore my results. I suggest that the 3 second discrepancy in the start time is merely an accommodation to the fact that my model has been used in 15 second increments.
Do you mean that you ignore the FMT turn at IGOGU to 186 at 18:39:30?
I have provided you with a complete operating spread sheet on numerous occasions so that you have access to all of my data, the entire path, and the algorithms used. I sincerely regret that you have not seen fit to trust me, even privately, with the same information from your model.
@sk999,
In a recent comment you said: “I have been asked whether I considered the various statistics involving the correlation of the BTORs with other quantities. In fact, I looked at the correlation with UT nearly 4 years ago, found it no where near as useful as the BFO correlation with UT, and turned the calculation off. I have looked at it again, this time computing the Spearman, Pearson, and Kendall correlation coefficients, and still don’t find it particularly useful, at least for the purposes of the report.”
On page 153 in our paper we said: “Because the OCXO frequency drift might have a linear component with time during the SIO Route, we exercise caution in interpreting the correlation coefficients of the BFORs with themselves and with time.”
The BTORs (not the BTOs) should be decorrelated with time, and this is an effective route discriminator.
In fact, with the one exception we noted, the decorrelation of the BTORs and BFORs is a very effective route discriminator, subject to only the random noise of the satellite data.
Think of it this way: what can cause correlation among these parameters? We believe there are only four possible causes:
1. Noise in the measured BTOs and BFOs,
2. Errors in the flight model, and
3. Errors in interpolated GDAS data, and
4. Errors in the fitted flight parameters.
Our method allows for Cause #1. We are only concerned with correlation coefficients which are beyond that expected by the BTO and BFO noise.
We have eliminated Cause #2 to the greatest extent possible by intercomparisons in great detail of our three independently produced flight models, demonstrating a very high degree of consistency (generally to better than 0.1 PPM in latitude, longitude, and bearing).
Our method also allows for Cause #3. We have demonstrated that the errors in the interpolated GDAS data are small. Furthermore, we allow non-zero GSEs, which, in effect, allows for small errors in the GDAS data and in our interpolations of it. Thus, our method ensures GDAS errors do not introduce correlations.
Cause #4 is what is left (errors in fitted route parameters). If you do not eliminate correlations in the route fitting process, you allow route fitting errors to exist in the result. The result is bias and reduced route parameter discrimination.
In your recent paper you said: “The choice of “start time” is arbitrary; while UGIB chose 19:41, one can equally well chose the
time of crossing the 7th arc (00:19:37 or thereabouts.)”
The satellite data indicate a flight without major maneuvers between 19:41 and 00:11. That is the range we used to fit SIO Routes. Your statement about this being “arbitrary” is nonsensical.
@Sid Bennett
You are unbelievable!
“all of which I ignored” at the end of the sentence, refers to “I noted differences” at the start of the sentence.
I am not ignoring your results, as you claim with your obtuse question.
I am actually trying to analyse your results, why do you think I would ignore them?
I state: “I rebuilt your flight path using your Timings, Positions, Altitudes and Bearings in my model”
Which means, that I am ignoring the differences I found in Timings, Positions, Altitudes and Bearings.
To be even more clear, I state “I effectively overwrote and disregarded my Navigation model”.
Which again means, that I am ignoring the differences I found in Timings, Positions, Altitudes and Bearings.
@DrB
Thank you very much for your answers.
Your answers to 3,4 and 5 are very clear.
Similarly, most of your answer to 1 (and 2) is very clear and informative, but your reference to increasing TAS “needed for bearings greater than 180 degrees” followed in the next sentence by “in which case the average KTAS would be constant” has confused me.
I’m not sure when you are referring to “increasing TAS” whether you are actually referring to increasing TAS over a flight, or to a tendency for the values for Average KTAS to progressively change when considering a set of candidate flights in order. In context I suspect the latter (?).
Were you referring to the wide range analysis as plotted in Figure G-8 (and Figure 23) of your joint report, where there is a general tendency for the Average KTAS to be higher at 187 degrees compared to 172 degrees with several variations in between (?).
In the narrow range represented by your “LRC Table 2020.03.20” the tendency above 181 degrees is opposite; see linked graph.
https://www.dropbox.com/s/fs950qocg4l0p0h/KTASavg%20-%20Narrow%20Range.xlsx?dl=0
@DrB
I am focus on BFO section. Page 140/141 it is mentioned that we do not know when the previous 16 Hz BFO bias adjustments were made for 9M-MRO, that apparently would have been part of the oft quoted DSTG Figure 5.4. How hard would it be to get that? If DSTG or ATSB or Inmarsat already has that data handy?
@TBill,
I have requested the additional BFO data from ATSB, but my requests were never fulfilled. I believe DSTG has the data, but are either unwilling or unable to release it, possibly due to non-disclosure agreements among the various parties.
@George G,
You said: “I’m not sure when you are referring to “increasing TAS” whether you are actually referring to increasing TAS over a flight, or to a tendency for the values for Average KTAS to progressively change when considering a set of candidate flights in order. In context I suspect the latter (?).”
I was referring to the general tendency toward higher average TAS at bearings greater than 172 degrees, as shown by the black dotted line in our Figure 23. It also shows a few wiggles up and down along the way.
@DrB
Of course, DSTG has the data. I can think of no reason why that data is not in the public domain.
@DrB
Ta.
@Dr B and @Andrew
In your report appendix FUEL MODEL A.1O APU Fuel Flow you state “The APU will be ON during all main-engine INOP periods, assuming fuel is available from
the left tank and/or the APU fuel line.” It was my understanding from the ATSB’s end of flight descriptions that the APU would not auto-start unless and until the second engine had flamed out, so would not have started during the period between L and R engine going down. Can you confirm either way?
If there was an active pilot at end of flight, then it sounds as if normal procedure would be to start the APU when first engine goes down. If that is the case, and the APU feed is situated lower in the well than the L engine fuel uptake, it implies that APU would be running – and keep running – at the time that L engine flamed out. That in turn would permit controlled (straight) flight under Autopilot after second flame-out until the APU ran out of fuel.
The consensus 7th arc logon mechanism would then need to be adapted. Could the AP autostart again after fuel starvation if aircraft attitude once again allowed the AP fuel line to fill?
@paul smithson
RE: “It was my understanding from the ATSB’s end of flight descriptions that the APU would not auto-start unless and until the second engine had flamed out, so would not have started during the period between L and R engine going down. Can you confirm either way?”
Your understanding is correct. The event that triggers the APU auto-start is the loss of AC power to both transfer buses. That would occur after the second engine flame-out, assuming the electrical system was in the normal configuration.
“Could the AP autostart again after fuel starvation if aircraft attitude once again allowed the AP fuel line to fill?”
No. The auto-start is initiated by the Electrical Load Management System (ELMS) when power is removed from both transfer buses, at which point ELMS sends a start signal to the APU controller. The start signal is a discrete input and is not repeated.
The 7th arc logon suggests that electrical power to the SDU was interrupted when the second engine flamed out and restored when the APU auto-started. That scenario implies the pilot did not manually start the APU after the first flameout. It’s likely the pilot was incapacitated by that time if the cabin had been depressurised for several hours.
Hi @Authors,
I shall try to be careful 😉 it’s clear you’ve done an amazing amount of work on your paper, unpaid, and for that: thank you.
There should also be some limitations placed upon it : not least the likelihood of the wreckage lying in a data gap, but also (as @Victor) and others have said before : only unpiloted paths can be realistically considered. Piloted paths… they just cover too much space.
So can I ask – *if* the region you suggest were to be searched (in parts searched again), with no positive result…. would you continue with your work? or conclude the flight was probably piloted and hence almost irresolvable,? or a third option?
as I say, I’m stunned and thankful for the work you have all put into this. I just worry the horse you’re flogging is long gone
thanks.
@vodkaferret: I’ll only speak for myself. If the recommended area is searched with a null result, unless new data or insights surface, I have no further recommendations. If it does occur, this is likely to be the final search for a long time.
@Victor
thank you, We obviously all hope that is not the case.
Steve
@Steve (aka @vodkaferret),
I concur with Victor, there will only be one more search and it had better be in the right location.
The new Armada technology from Ocean Infinity allows efficient searching of a much larger area than before, but if MH370 is not found in our recommended search areas A1, A2 and A3, then I will hang up my laptop and apologise profusely for wasting everybody’s time and money.
@Victor. Area 1.
I refer to the paper’s 8.4. Uncertainties of the LEP along the arc add up to its extremities. At the extremities the uncertainty of the trajectory after LEP will be expressed as circular, i.e. on a radius from those extremities. Uncertainties normal to the arc would of course need to be added.
Thus I see Area 1 as a sausage shape, not rectangular.
If so its area would be reduced by about 74^2 less pi*74^2/4, i.e. 1175 sq nm
On a minor point I suggest 8.4.3, “Uncertainty of Turn Between Fuel Exhaustion and 00:19:29”, be renamed, “………Between Disengagement of Autopilot and…”, since the turns included some in the alternative configuration before MEFE .
Clarification please. The last line should have “commencing” before “before”.
@Richard
thank you for your reply. let’s hope it doesn’t come to that!!
@David: Yes, I took some liberties in representing the circular trajectory as uncertainty along and parallel to the arc.
It took a while to catch up with the conversation after only a brief interruption, but some comments here stand out as completely dismissing new acoustic evidence for a very specific FEP:
@DrB “Please tell me why you think he would want to perform maneuvers after 19:41, assuming he were not incapacitated? If he was beyond radar range and could not be tracked by other means, what would be the point of altering course after 19:41?”
@VictorI “It would be quite a coincidence if multiple maneuvers produced the same match to the data as a straight, automated flight with no pilot inputs. Any other justification for maneuvers is just supposition, and we are back to reconstructing paths based on hunches.”
@DrB “I defy anyone to demonstrate a curve like our Figure 19 for any other route, especially for a route with maneuvers between 19:41 and 00:11. In my opinion, it is unique.”
@VictorI “If the recommended area is searched with a null result, unless new data or insights surface, I have no further recommendations.”
@Richard “I concur with Victor, there will only be one more search and it had better be in the right location.”
I still cannot understand why such a specific endpoint is not on anyone’s mind. I do realize how a maneuvered scenario like CAPTIO may seem to be one of an infinite number of paths that fit the satellite data, making it incalculable compared to an unpiloted straight path.
Conversely, the 370Location.org reports describe a very specific endpoint on the 7th Arc. An infinite number of ways to fly there that fit the data would seem to be a strong point in favor of that destination.
If one were to construct a cumulative probability graph of BFOR, BTOR, Fuel Endurance, and unsearched areas for my endpoint, it would be a prominent peak on a flat 3D landscape relative to neighboring latitudes AND longitudes.
I estimated BFOR using Richard’s spreadsheet. I’m sure the simple path I laid could be optimized to match BFO, but I did not “contrive” to do that.
Previous studies of barnacle temps were not considered useful because they did not match with an SIO endpoint.
A tropical site is instead consistent with temperature, growth, and species of the barnacles and molluscs found.
There are a variety of drift studies, but most did not even look at the 7th Arc at latitudes near Java. The final reports state clearly that CSIRO was asked to compile drift studies *based on new data* which was the PDF of the SIO. CSIRO privately conceded that a location near Java could drift to the locations where debris was found, with the notable problem being that the debris arrives too early, months before it was found. That seems quite possible.
Fuel endurance for my published path at FL150 is within 50 km of the 333 kt MRC exhaustion documented by Boeing in SIR Appendix 1.6E.
Taking a path to a specific flyover detection time at Cocos Island that is compatible with the FMT and 2nd Arc location is not complex. There are few waypoints in that area. A direct flight is of course possible, but the plane had been flying waypoints up to the FMT. The reasoning for maneuvers beyond 19:41 in this scenario is that there is evidence of acoustic detections that appear to match up with MH370 arc timing and endpoint location.
The connecting airway between Cocos and a tentative detection at Christmas Island is rather obvious, still on a waypoint path.
Assuming a standard departure heading for Jakarta from Christmas Island and continuing to fly waypoints may be the weakest part of my proposed path. The timing might be better matched by a long climb followed by a short fast descent toward the 7th Arc. Perhaps an expert in BFO would be willing to check for compatibility.
I haven’t modeled the GDAS for fit, because modeling to that accuracy for fuel endurance is not necessary for the already located endpoint. What matters is whether the plane could have flown any plausible path to the endpoint.
That the endpoint acoustic event is 55 minutes after 7th arc timing is not unlikely. An implosion was suggested by the CTBTO when calling for researchers to investigate in the first days after the plane was lost. It was mentioned in the final reports. It was encouraged by the ATSB. Experts have advised that even a weak implosion of some component as the plane sank should be heard long distance, vs the difficulty of detecting a surface impact.
As to whether the search should be conducted, the threshold has long been for “new credible evidence”.
I’ve said that I do not see this as a zero sum game where only one search can be conducted. I support the authors and everyone here in their efforts to find the truth. I don’t think that should include ruling out any viable candidate, either statistical or acoustic.
A good reason to search the specific site of an anomalous acoustic event is that the search area is relatively small. Expert seismologists could certainly improve the accuracy with better tools and crustal data. The site might even be narrowed to the point that an entrepreneurial ROV excursion could suffice vs an extensive OI grid search.
I know that you will continue on with seeking consensus on your current conclusions specific to a straight path, and I agree that they are very compelling. In your negotiations for a future search, I ask you to please keep in mind the possibility of exploring more than one area.
In your logical arguments, please don’t rule out piloted maneuvers that would get to a known endpoint.
Thanks for all your hard work!
— Ed Anderson
@370Location (Ed):
I appreciate your support of the work of many contributors to this site, and I also have an appreciation of your scientifically-based methods to localize the debris field.
I estimated BFOR using Richard’s spreadsheet. I’m sure the simple path I laid could be optimized to match BFO, but I did not “contrive” to do that.
But that’s exactly what you’ve done with the BTOs.
Your endpoint succeeds or fails based on whether the acoustic event was from MH370. You seem certain it was, with a delay due to a component that sank and imploded. There have been a number of people (including David Mearns) that believe this is a very long stretch.
Frankly, I don’t understand what single component of a B777 would implode with enough energy to cause an acoustic event that is detected thousands of kilometers away. Contrast this to the hull of a submarine. At the same time, I profess no expertise in this area, which is why I neither support or dismiss your work.
I hope that others that have the time, expertise, and willingness to do a deeper dive into your work will confirm or refute your findings, regarding both the location and the possibility that the acoustic event was from MH370.
@370Location
Those of us favoring active pilot hypothesis could have similar list of comments. Below I attempt list to summarize MH370 SIO hypotheses:
MH370 Crash Location Hypotheses Groups (SIO):
(1) Active Pilot flew Straight No-Maneuvers to 38 South (many proponents)
(2) Passive Pilot flew Straight No-Maneuvers to 38 South (many proponents)
(3) Passive Pilot flew Straight No-Maneuvers to 32-35 South (many proponents)
(4) Passive Pilot flew Straight No-Maneuvers to 26-30 South (formerly in favor)
(5) Active Pilot conducted Maneuvers to Various Locations 10-32S (many proponents)
Philosophically I would say Search-1 (Fugro et al) addressed Group-1 and Group-2. The second search (OI) addressed Groups-3,4,and some of Group-5.
We are hoping for a Search-3 and IG is proposing that at least part of that search be centered at the current proposal (34S). I have long wondered if OI will search other areas, since we know several universities have been invited to develop models.
Those of us in Group-5 can only hope that either (1) additional regions are also searched, closer to our respective hypotheses, or (2) there is a future Search-4, which Victor discounts somewhat, or (3) our hypotheses are wrong and IG is correct about 34S region.
@TBill
As Victor has pointed out, the current paper UGIB) is not an IG position at this time.
How do you reconcile case (1) with the lack of a search strategy to deal with a glide? The UGIB paper presents a reasoned approach to revisiting the area at 34S but recognizing that the glide was not searched there either.
That searching the glide area substantially expands the search area is the worst reason to avoid doing it once a search effort is mobilized.
@Sid
Logic dictates I missed a lesser-favored Group-3a (analogous to Group-1):
(3)(a)
Active Pilot flew Straight No-Maneuvers to 32-35 South (less current support)
As far as Group-1, my understanding is Search-1 was much wider than +-25nm, so that hypothesis already benefited from an extra wide search, although I realize not the “full Monte” super-wide search that advocates feel is needed. I sympathize since I also feel long glide is possibly indicated by the data.
I personally feel, the current searches need to assume minimal glide. Assume Arc7 is the key place, but with margin of error, so perhaps 30-40 nm limit.
Tony Abbott basically said we should allow for active pilot possibility, which I agree with. But to me, that does not mean Group-1 is assumed to be the correct place for +-125 nm search. I believe we need some kind of future mathematical analysis or other lead for active pilot cases, and possibly a multi decade search.
PS Sid- I did take a look at your recent paper, but I did not immediately see your hypothesis. Do you feel active pilot? and if, so what was the intent or strategy? Most of the Group-1 feels it was a dash to sunlight terminator, which I guess had to be calculated pre-flight to hit that zone without maneuvers.
@Sid Bennett
The IG used to have 18 active members.
There are now only 7 currently active on this forum.
Out of these 7, 6 have expressed their support for our findings in the recent paper.
I know of only one vocal dissenter from the IG on this forum.
@TBill
In my recent paper I intentionally avoided taking a position as to whether there was an active pilot after 18:40 or so. My focus was on defending the original IG proposition of a 186T path at high altitude.
Now that I have understood the objections to my study at a constant altitude at variable M, and have determined that LRC at 39000ft gives an equivalent result, I redid the case at 18:40 and got a very tight fit . I am also going to re-do the turn time analysis using the LRC approach.
The evidence for an active pilot might be stated as follows:
At 18:22 (the 18:25log-in), someone (a human) had to have re-enabled the power to the SDU. I believe the offset route from N571 was manually initiated. Once that is done, I suppose that the human could have programmed the rest of a high altitude, including the turn at IGOGU to a ISBIX waypoint (with a continuation on 186T rhumb line) to the 7th arc. So, a human input cannot be definitively shown after 18:22.
But, if the human intended to end the involvement at 18:22 or so, why bother to re-energize the SDU? Why bother to re-pressurize (if indeed that was done?)
So far, I can find no evidence for or against the human being in position to maneuver the plane at the time of fuel exhaustion.
@Richard,
I miss Henrik.
@Sid Bennett said: Once that is done, I suppose that the human could have programmed the rest of a high altitude, including the turn at IGOGU to a ISBIX waypoint (with a continuation on 186T rhumb line) to the 7th arc.
After reaching an end-of-route in LNAV mode, the plane would follow a constant heading, not a constant track. Whether the heading is magnetic or true depends on whether the position of the HDG switch is NORM or TRU. Unless the plane is operating in polar regions, standard procedures would be to select NORM.
@DennisW
You stated “I miss Henrik”.
I included Henrik in the count of 7 IG members currently active in this forum, together with Victor, Mike, Don, Brian, Sid and myself.
@Richard: Barry Carlson also contributes here.
My apologies @Barry Carlson for leaving you off the list.
@Richard,
I’ve monitored carefully all the posts in this forum. Not having any compelling comments to make either in favour or against the UGIB proposal, I have refrained from muddying the waters.
Notwithstanding, I applaud the dedicated work all of you have made in presenting the paper.
@Ed Anderson,
You asked “@DrB “Please tell me why you think he would want to perform maneuvers after 19:41, assuming he were not incapacitated? If he was beyond radar range and could not be tracked by other means, what would be the point of altering course after 19:41?””
I don’t see any benefit of changing course after 19:41. I have wondered about step climbs, but that possibility would only be driven by maximizing range. Since he did not fly at MRC, fuel conservation does not appear to be a priority, so step climbs are unlikely.
You also said: “That the endpoint acoustic event is 55 minutes after 7th arc timing is not unlikely.”
I disagree. A well-known oceanographer does, too. There is far too little energy in anything that could implode, and the long delay is problematic, because the implosion would have to be located in the SOFAR channel to be heard at any significant distance.
Victor Iannello said:
April 10, 2020 at 7:58 am
@David: Yes, I took some liberties in representing the circular trajectory as uncertainty along and parallel to the arc.
Smile. (of recognition of some need for simplicity)
@George G. Increase of Area 1 by about 1175 sq nm from the 5,544 sq nm it otherwise would be, around 21%, is a large approximation, unparalleled in error estimates.
@David
Agreed, “21%, is a large approximation”.
I had left discussion of the End Point for some time. The rectangle is very rudimentary, and I presumed deliberately so. I had not yet reconciled the “uncorrelations” implied by Table 1 in Section 8.4.6. Although I felt “comfortable” that it would be reconcilable. These are used in definition of A1. In absence of that reconciliation, my making any other comment on the 74 by 91 representation would be inappropriate.
I had also interrupted discussion with Ventus 45 concerning End of Flight scenarios and BFO implied descent rates.
However, since that time, other reviews have led me to believe the most likely, and highly likely, situation is that the flight southwards was made with an incapacitated or deceased pilot.
Concerning the potential use of the 74 by 91 rectangle, I presumed that anyone seriously considering a re-search would be making their own analysis of where and most importantly in what order they would conduct a search.
(Presumably straight line boundaries will be used in any case)
Recently, or for some time, I have been more concerned with an overview of the data and analysis used by the report authors to narrow down the location of the LEP. That overview has been become somewhat prolonged.
As part of the overview I have become more acceptable of a sharp cut-off in fuel availability, as represented by Figure D-3, than I was previously.
@VictorI
“There have been a number of people (including David Mearns) that believe this is a very long stretch. Frankly, I don’t understand what single component of a B777 would implode with enough energy to cause an acoustic event that is detected thousands of kilometers away. Contrast this to the hull of a submarine.”
@DrB (Re: That the endpoint acoustic event [] 55 minutes after 7th arc timing is not unlikely.)
“I disagree. A well-known oceanographer does, too. There is far too little energy in anything that could implode, and the long delay is problematic, because the implosion would have to be located in the SOFAR channel to be heard at any significant distance.”
The tweets from David Mearns regarding implosion were his knee jerk reaction to the idea of an implosion. He called it a “red herring”, as if it were an intentional diversion away from the true path (which would of course be a reference your collective work). My work is not mutually exclusive of yours.
He assumed the discussion was of the plane ditching intact so the entire fuselage could implode. His experience is with ships, and perhaps he was also thinking of the implosion of submarine ARA San Juan. If he were familiar with SOFAR acoustics or had seen recent tweets, he would know that the discussion was of smaller components. Asked if he had examined any of the reports or background, he said he’d “already seen enough” [to judge, from tweets].
BTW, the San Juan was not in the SOFAR channel, but much shallower water.
Oceanographers calibrate distant hydrophones by small explosive charges, or triggered cracking of glass spheres at SOFAR depth. Tests with 10 inch (8.7 liter flask) and 22 liter glass spheres find that their implosion at 650m is about equivalent to 1-2 lb of TNT. (They were felt in the ship above, and deeper implosions should be stronger.) That equates to about a 200db sound level, expected to be heard across the globe at a distance of 8000km. From the Java Anomaly to the Diego Garcia hydrophone is less than half that distance. In contrast, a lightning strike may reach 270db, yet even nearby surface strikes that day were undetectable. There is a big difference between a surface event, and one that propagates into the SOFAR channel.
I can’t really know what made that sound. Anything from an O2 or CO2 cylinder to even a large thermos. Perhaps it was buckling or collision of larger sinking parts. Something made a very loud noise, right on the 7th Arc.
Rigorously challenging with dismissive language any evidence that doesn’t meet one’s own hypothesis or intuition seems to be the way of public debate. I appreciate your mention that I have taken a science-based approach. To me, that means being cognizant of our own biases and attempting to correct for them. It also means exploring credible leads, which doesn’t always lead to a single solution.
I suspect this is why my work got no mention at the MH370 research conference or in the ATSB report. ATSB even said that the plane could not be in multiple places at once. Presenting multiple search candidates, left them with much less confidence in any of them because they had to ultimately be mutually exclusive.
That is not the way I think, and certainly not my intent here. My path is premised on your good work, with additional evidence.
Thanks for allowing my comments here, and also for inviting others to assist with validation of my candidate. I am open to any collaboration.
@TBill
Thanks for breaking down the different proposed endpoint theories into subgroups. It does make it clear that getting a consensus as was the IG premise would be difficult. I also didn’t realize how broad the views were.
I also saw your condensed version as a tweet. A minor point is that you might list destinations beyond 10S to 8S, as that is the limit at the Java coast. (My anomaly event being at 8.36S.)
I realize why my candidate is lumped in with other maneuvered paths, but I think my approach stands alone as working backward from new evidence for a very specific location.
Your groupings do give me better perspective.
@370Location said: Rigorously challenging with dismissive language any evidence that doesn’t meet one’s own hypothesis or intuition seems to be the way of public debate.
I have never dismissed your work. I am neutral towards it. For me to warm up to it to the point where I would recommend it as a candidate search area, I would have to dive in to better understand and evaluate it, or trust the opinions of experts.
It would be an interesting experiment to drop fire suppression spheres or whatever you think might have caused the acoustic event at your location of interest to see if it matches the acoustic signature of the event you identified.
@370Location
I stand corrected, 8 South to 32 South for the range of more easterly active pilot path proposals.
Per your above post, when/what was the MH370 research conference?
@ VictorI
I was griping in general to uninformed but dismissive language by Mearns and many others. It was not meant personally. I realize I’m your guest on this forum, and grant you the full respect you are due.
Experiments dropping components were proposed and pursued by Don. I don’t know why it was rejected. It may take nearly resources to do that test as to search the sea floor at the candidate site.
@TBill
Thanks for the revision.
Griping again, I was referring to the conference referenced in the ATSB final report:
“In November 2016 experts from various organisations and agencies who had been closely
involved in defining the MH370 search area met for a first principles review. (the ATSB’s report of
the meeting can be found here: First Principles Review).”
https://www.atsb.gov.au/media/5772107/ae2014054_final-first-principles-report.pdf
“The meeting was to reassess and validate existing evidence and analysis and to identify any new analysis that may assist in identifying the location of the missing aircraft.”
The FPR notes:
” A presentation on the hydro-acoustic data at the time of the accident allowed meeting participants to determine that hydro-acoustic analysis did not contribute any useful new information to the search.”
That’s what I saw as the result of submitting too many candidates. I still think the work was well done, and the Gulden Draak acoustic candidate was prominent and specific, but it wasn’t where they wanted to look.
(Ref: the joke about looking for a lost watch under the streetlamp because the light is better. 😉
@370Location
I am quite interested in Gulden Draak event right now, because I believe you predict several candidate locations of the event.
The Java event you have well-documented and is of interest if Xmas region gets higher search priority in the future. The fact that Tony Abbott indicates Malaysian leaders thought it was pilot suicide, and presumably not the rumored negotiation scenario with Xmas/Java diversion plan, tends to further support the straight or semi-straight flight path to SIO 20-38 South.
@TBill
“The fact that Tony Abbott indicates Malaysian leaders thought it was pilot suicide, and presumably not the rumored negotiation scenario with Xmas/Java diversion plan, tends to further support the straight or semi-straight flight path to SIO 20-38 South.”
I certainly would not expect Malaysian leaders to support a negotiation scenario.
I can’t muster up anything convincing to support pilot suicide as the initial motivation for the diversion. Crashing became the only option after a negotiation failed. Hence, my preference for a Cocos or Xmas Island flight path.
@George G, Victor. George G’s, “.. I presumed that anyone seriously considering a re-search would be making their own analysis of where and most importantly in what order they would conduct a search.”
Yes, could be left to them.
There would be another couple of possible ingredients:
First, reducing a revised Area 1 end semi-circles to 32 nm radius (the allowance for the distance travelled after the LEP transmissions) from 74/2 = 37 nm, the further area excised would be 542 sq nm.
Second, should the 8.8 nm allowance either way along the arc for a turn after fuel exhaustion be that much? I suspect that extreme stems from Boeing simulations of descents in the alternative electrical configuration, i.e. the autopilot being disengaged at right engine fuel exhaustion.
Since the LEP transmissions would be 2 mins later, that would be 4½ mins before MEFE otherwise.
That would be beyond the fuel budget of the paper’s Fig 31.
As with it being necessary that the packs were off in the SIO leg to meet that budget, that same argument should exclude the alternative configuration simulations from consideration.
That done the 8.8 nm would drop to about 3.4 by my ruler, reducing Area 1 by two 5.4 nm (approx.) wide strips, 77 nm wide, an area of roughly another 832 sq nm.
The total Area 1 reduction from the current 6719 sq nm then would be, 1175(from earlier)+542+832 or 2549 sq nm, 61% of the new reduced area.
This would be immaterial of course were the search intention at the outset to include Areas 2 & 3; except for prioritising. However having to disregard fuel sufficiency to justify searching these, as distinct from saving the expense (cost vs the residual success likelihood) or searching other alternatives, might limit the search to just Area 1.
Days after the flight a retired Malaysian businessman discussed with me the political situation in Malaysia, explaining that Captain Zaharie had been caught up in it and that he was aware of a meeting Captain Zaharie had in the days before the flight.
I have known the gentleman for years and have no doubt of his integrity.
He did not know what actually happened to MH370 but he did know what was planned to happen.
He was quite categorical that Captain Zaharie had no intention of committing suicide.
Captain Zaharie’s intention was to ensure the plane landed safely and released the passengers.
Details of the plan and implications as I see them were outlined in a score or so of postings on this blog.
@370Location’s findings and final location are not inconsistent with the location that was suggested early on by my friend.
My above, correction. “That would be beyond the TIME budget of the paper’s Fig 31.”
@Sid Bennett,
To further investigate the 186 degree LNAV route, I did a number of case studies. A summary of those results is available HERE .
Table 1 in that document compares critical parameters for various cases of route fitting with different optimization functions and conditions. All route fits in this case study assume the air packs are always ON and the cross-feed valves are always CLOSED.
Case 1 is the route you proposed with a 186 degree true initial bearing at 18:39:30. It is flown in LNAV with LRC speed at FL390. I have left the results in the table blank for your fit, but maybe you can fill in some of them from your calculations. For my purposes, I only need the seven route parameters, which I have taken from the worksheet you provided to Richard.
Cases 2 through 5 are some of my new results.
In Case 2, I used your seven route parameters, and I defined the handshake locations by forcing the Ground Speed Errors (GSEs) to zero. These handshake positions, then, are simply what my flight model calculates along the great circle route, taking into account the GDAS local temperature and wind. In Case 2, the fuel probability is high (79%) as a result of assuming LRC at FL390. We already know that is the case, because this is the same speed setting and flight level we determined to be the global best fit at 180 degrees. At 186 degrees bearing, the primary weather change is greater headwinds late in the flight. We don’t expect a particularly high route probability with no allowance for GSEs, and this is indeed the case. The route probability is only 11%, and the compound (route X fuel) probability is 8%.
In Case 3, I allowed the GSEs to be non-zero and also to be consistent with the conditions laid out in our paper regarding magnitude, slope magnitude, and smoothness. This allows the handshake locations to move along the great circle path to maximize, in this case, the product of the route and fuel probabilities. The fuel probability does not change materially, but the route probability increases to 31%.
In Case 4, the GSE conditions are as given in our paper, but now the starting location (latitude and longitude), speed, and flight level are free variables which are adjusted to maximize the route probability. This is the same general method as used in our paper for the bearing study. So, in Case 4, the only assumed parameters are the 186 degrees in LNAV starting at 18:39:30. Everything else is adjusted to maximize the route probability. Just to be clear, I am following your bearing assumption of 186 degrees at 18:39:30, not at 19:41 (which was the convention we used in our paper). This leads to a bearing at 19:41 of about 185.95 degrees true.
The Case 4 results show a substantial increase in route probability, due to a significant change in starting latitude, a small change in starting longitude, and a substantial change in altitude (2,000 feet higher). Case 4 is optimized by maximizing the route probability. Here the route probability is up to 54%.
Case 5 uses the compound probability as the objective function to be maximized, but the results are not discernibly different from Case 4. So, again, as at 180 degrees, I see that the route fits don’t vary noticeably whether route probability or the product of route probability times fuel probability is maximized by the fitting process in a single fit at a given altitude. The altitude sensitivity is low enough that SOLVER won’t find the peak in probability with the flight level as an additional free variable (and neither will it find the best bearing that way). Instead, I have to step the altitude along manually to optimize it.
So, the bottom line in this case study is that there are two solutions, and one is better than the other other. You found one at FL390 that is better than the one we showed in our paper, but it is on the side of a second, larger peak at FL410.
The second item in the attachment is a plot of various probabilities versus flight level for this 186 degree route. This illustrates the difficulty in route fitting at 186 degrees caused by having two “local” peaks in the objective function. It’s hard to determine they exist, without a systematic altitude survey at a fixed bearing, much less to determine which one is the “global maximum”.
The red curve in Figure 1 is the route probability. The green curve is the fuel probability. The black curve is the product of the route and fuel probabilities.
You can see that, as it turns out, that there are two peaks in route probability for the 186 degree route. Our initial search in 2019 identified the one at FL370. You have found the side of another one at FL410. It has both a higher route probability and a higher fuel probability.
These studies indicate, as before, that fitting either the route probability or the product of the route probability times the fuel probability does not materially change the result when using SOLVER, although in principle a better optimizer might at least allow one to find one of the bearing/altitude parameters while holding the other one fixed. In this study, I found the fuel probability is essentially 100% at FL410, so one should not expect the two objective functions to produce different results.
What does change the result are the initial guesses for FL, latitude, and longitude. One guess lands the fit on one of the probability peaks. A different starting position and altitude can land the fit on a different probability peak.
This second peak shown in Cases 4 and 5 is better than our (and your) original solution, although it is still significantly lower in overall probability, compared to the 180 degree route (which seems to have only one peak in probability). Thus, 186 degrees has a route probability not all that different from many other nearby bearings (see the top panel in our Figure 15). The plot of probabilities for 186 degrees (Figure 1 in the attachment) demonstrates that a complete altitude survey at each bearing is necessary to identify the presence of multiple peaks and to discern the highest peak. Without that altitude survey, or a more effective optimizer, those bearings which have multiple peaks can lock onto a peak which is not the optimum for that bearing, depending on the initial guess for altitude.
My case study demonstrates that, at least at one bearing > 180 degrees, a high fuel probability is possible, and one might expect nearby bearings to behave similarly. When I have the opportunity, I will have a look at intermediate and larger bearings to see if they have more than one route probability peak, and I will update the route and fuel probability graphs in our paper accordingly.
@George G, Victor. I see from D1, page 115 that the abnormal configuration is not included anyway, suggesting to me that the 8.8 nm either way along the arc for a turn after fuel exhaustion could be reduced as outlined above.
@David,
Your potential refinements noted.
As stated previously, I have not yet reconciled the full implications of Table 1 in Section 8.4.6 and in absence of that would prefer to defer any specific comments re A1.
As I think the most likely, and highly likely, situation is that the flight southwards was made with an incapacitated or deceased pilot, then A3, even A2, become/s (in my opinion) irrelevant.
A final qualifier is, of course, is that all the above is in consideration of a “straight-line” path southwards, Post 19:41.
With respect to anyone seriously re-considering a re-search, it might be expected that anyone would be reviewing all previous search data very strenuously prior to any such consideration. Then they might be ensuring that they have proven methods to investigate very challenging bathymetry. The initial order of search might be based on the results of both the two previous, i.e. the data review and development of proven methods for searching very challenging bathymetry, and not necessarily upon wider considerations. (Just to explain my previous comment.)
@Sid Bennett,
Bobby requested “I have left the results in the table blank for your fit, but maybe you can fill in some of them from your calculations. For my purposes, I only need the seven route parameters, which I have taken from the worksheet you provided to Richard.”
I would much appreciate, if in addition you could clearly specify, whether in your view, there was an active flight plan, an active route, whether the waypoints IGOGU and ISBIX were used and when an active pilot ceased to control the aircraft.
In your paper dated 28th March 2020, you state:
(1) MH370 “continues on the N571 azimuth until at least waypoint IGOGU“.
(2) “The navigation mode is LNAV (at least until ISBIX, and possibly True Track thereafter)“.
(3) “the path overflies the ISBIX waypoint and we consider that this is the last waypoint used. Alternatively, the path coincidently passed very close to the ISBIX waypoint.“.
(4) “The aircraft is being flown using the automatic flight controls by manually entering commands and data in an alphanumeric display“.
If I understand you correctly, MH370 was in LNAV mode and the waypoint IGOGU was definitely used and the waypoint ISBIX may have been used. In any case, there were no waypoints used after ISBIX, so there was a route discontinuity.
If waypoint ISBIX was the last waypoint (which was reached at 19:32:41 UTC according to your spreadsheet), then as Victor has already pointed out, that following this last waypoint in LNAV mode, the aircraft would revert to a Constant Magnetic Heading (CMH) unless there was an active pilot who had previously changed the Heading Reference Switch from NORM (Magnetic) to TRUE and then the aircraft would revert to a Constant True Heading (CTH). Neither of these navigation modes reach anywhere near your end point of 37.3913 °S at 00:17:30 UTC.
Another possibility is, that you are saying that an active pilot at ISBIX selected the HDG/TRK switch on the MCP to TRK, entered a track of 186 (only 3 digits allowed) and pressed select. In this case, the aircraft would change to the Constant True Track (CTT) navigation mode and as you say this is a good approximation and reaches an end point of 37.4294 °S at 00:17:30 UTC.
Another possibility is, that you are saying that an active pilot at IGOGU selected the HDG/TRK switch on the MCP to TRK, entered a track of 186 and pressed select. In this case, the aircraft would change to the Constant True Track (CTT) navigation mode and as you say this is a good approximation and reaches an end point of 37.4286 °S at 00:17:30 UTC.
Please clarify, which navigation mode was used and when.
@TimR
@DennisW
Re: Xmas/Java Routes
Thank you.
Additionally there were social media accounts in the days after the crash, suggesting that at least one elected official was expecting MH370 to show up at a diversion airport.
So the “rumor” is semi-well supported. I just feel at this point, it seems like any such negotiation was over by IGARI. Or the plan was changed.
The rumor as we understand it, was an extortion plot. If ZS demands were met, MH370 would safely divert to Xmas/Java. We are told by TimR that ZS was also planning to safely divert to Xmas/Java if his demands were not met (apparent bluff). DennisW envisions, if demands were not met, the ultimatum was to crash, which is what we witnessed.
@Richard,
@Sid Bennett,
If the MCP were used to set a constant track angle, such as 186 degrees, that would only be a Constant True Track if the NORM/TRUE switch had also been set to TRUE. Otherwise the result would be a Constant Magnetic Track.
@DrB
I agree.
My point to @Sid Bennett was, that either a heading based or a magnetic based navigation mode (CTH, CMH or CMT) track ends up far away from @Sid Bennett’s end point, with no match to the satellite data.
Only a CTT loxodrome comes close to a LNAV geodesic.
That requires an active pilot to switch the heading reference from NORM to TRUE.
@DrB
@Richard
Thank you for further considering the 186T option. You have done so much work that I need to try and assimilate it before making any comments.
I had been working on a revision of my paper, but will put it aside for now and address your posts.
The only impediment is that my wife is trying to get me accustomed to playing on-line bridge :-). It is one of our many adaptions to the current situation.
As a brief comment on some of my recent studies, I redid the study that I did with Geoff Hyman in 2015 to determine the time of the FMT and the resultant azimuth (now using LRC at 39000ft). The time window for FMT has narrowed as has the distribution of possible azimuths. I will
@Richard
I prefer to take no a priori position on the route except that it starts at 18:22 on N571. The rest follows from the data. That the FMT seems to be at IGOGU and that the route seems to overfly ISBIX is highly suggestive of a LNAV route via known waypoints. However, that is an observation rather than a conclusion. If a end point is to be fine tuned, one of the approaches should be a IGOGU to to ISBIX route followed by a path that might depend on whether there was pilot intervention. But, first things first. (I tend to use IGOGU and ISBIX as a shorthand notation for their approximate location so as to help me visualize the scenario.)
You have mentioned a number of possible relatively minor path changes if indeed ISBIX is used as a waypoint and, again, I am not sure I have thought them through enough to firmly choose one. Considering the search area size, they are probably equivalent, but they all ought to be computed to see if any further insight can be gained.
https://www.dropbox.com/s/b9pstmt1crrp1a1/Preliminary%20Research%20Note%20041120.docx?dl=0
Just to update our previous study.
@DrB
You wrote:
“My case study demonstrates that, at least at one bearing > 180 degrees, a high fuel probability is possible, and one might expect nearby bearings to behave similarly. When I have the opportunity, I will have a look at intermediate and larger bearings to see if they have more than one route probability peak, and I will update the route and fuel probability graphs in our paper accordingly.”
To what extent have you studied LRC, CTT in the 180 – 186 degrees range for different FLs / are you intending to extend for CTT in similar fashion?
@Niels,
You asked: “To what extent have you studied LRC, CTT in the 180 – 186 degrees range for different FLs / are you intending to extend for CTT in similar fashion?”
I did look seriously at CTT some time ago, and near 180 degrees there may be reasonably good CTT fits. Doing that again in the future depends on how long it takes me to update the LNAV routes between 180 and circa 186 degrees for potentially better FLs. I will also see if there is a better speed mode, which is possibly M0.84 as an alternative to LRC (although this did not improve the 186 degree route at FL410).
In my opinion, CTT is much less likely than LNAV, because it requires setting the MCP track angle and changing the NORM/TRUE switch. Why would anyone change the switch, and why would anyone pick 186 degrees CTT?
@All,
Fuel modelling for MH370 was hampered in the past because we did not know the Performance Degradation Allowance or the Fuel Performance Factor for 9M-MRO. Finally the Operational Flight Plan for MH370 was leaked in the RMP report showing a fuel performance factor of 1.5%. We were also told in the Malaysian SIR that the right engine consumes on average 1.5% more fuel per/hour compared to left engine. I decided to use the ACARS data from MH371 to verify the Fuel Performance Factor and the Right/Left Engine Fuel Flow Rate Ratio
I used the Fuel Flow sensor calibrations scaling factors from the MHXX FOQA data as discussed in section B.2.2 of our paper. I used two methods to calculate the Fuel Performance Factor: (1) the fuel used method and (2) the specific range method.
Using the calibrated Fuel Flow sensors gives a fuel performance factor on average of 1.41% overall (for both methods) and a fuel flow rate R/L difference for the sensors of 1.53%.
Using the uncalibrated Fuel Flow sensors gives a fuel performance factor on average of 2.01% overall (for both methods) and a R/L difference for the sensors of 3.35%.
MAS Operations were regularly using data from ACARS downloads and quite likely were using the Boeing software tools to track the fuel performance factor of each aircraft in their fleet. MAS Operations were using the retained value method to update the fuel performance factor in steps of 0.5%. The 9M-MRO fuel performance factor was set at 1.5% and had not yet reached a sustained level above 2.0%, where MAS would increase the value to the next step.
If MAS Operations did not correct the raw Fuel Flow sensor readings, then they wouldn’t get an average fuel performance factor of 1.5%, nor a 1.5% fuel flow rate right/left engine difference. Using the fuel flow sensor calibration factors from the MHXX FOQA data and applying them to the MH371 fuel performance factor data collection, the average fuel performance factor and the fuel flow rate ratio between right and left engines, match the MAS values.
The detailed analysis can be found in the attached paper:
https://www.dropbox.com/s/0ef39vifgh09dnh/Performance%20Degradation%20Allowance%20and%20the%20Fuel%20Performance%20Factor.pdf?dl=0
@Sid Bennett
You stated: “You have mentioned a number of possible relatively minor path changes if indeed ISBIX is used as a waypoint and, again, I am not sure I have thought them through enough to firmly choose one. Considering the search area size, they are probably equivalent, but they all ought to be computed to see if any further insight can be gained.
A CTT path has a fuel exhaustion point 27 km from a LNAV path. This is within the A1 search area size.
A CTH path has a fuel exhaustion point 176 km from a LNAV path. This is not within the A1 search area size.
A CMH path has a fuel exhaustion point 684 km from a LNAV path. This is not within the A1, A2 or A3 search area size. It is a similar case for a CMT path.
@DrB
https://www.dropbox.com/s/hipueflj6bc9rjs/DrB%2BSid_041220.JPG?dl=0
I annotated your spread sheet with excerpts or computations from a spread sheet that I used for my recent paper.
As you would expect, the results match to within the range of values associated with slightly different met models and goodness of fit criteria.
The case I present is where there is an offset from N571 that is not cancelled prior to the turn. I believe that your cases 4 and 5 would be likely if the offset were cancelled before the turn and the turn was made from the center-line of N571. My modeled turn is a bit too sharp for an exact comparison.
Also I believe that the evidence supports a case of air packs off and a reduction in electrical load for the hour prior to 18:22.
When I was trying to compare met models with Richard, I believe I observed that the result likely lay slightly above 39000ft. The adjustment of altitude using the LRC model is analogous to adjusting M when using a constant altitude.
I have looked at this problem as one of step-wise refinement of the math model. However in the case of the fuel consumption, I wonder if we can consider the result “good enough”? If not, how can we proceed?
Based on this result, I think one can argue that there is only one high altitude path.
I look forward to your further comments.
@Richard,
I was considering the rhumb line selection by a pilot who didn’t want to bother entering a further waypoint.
In the case of a 180T path wouldn’t the rhumb line coincide with the GCP?
@Sid Bennett,
You asked: “In the case of a 180T path wouldn’t the rhumb line coincide with the GCP?”
My apologies to Richard for interjecting a nuanced exception. With no disturbances, the CTT path at 180 degrees true would match the LNAV (geodesic) path. However, with any variation in cross-track wind, CTT and LNAV are not the same. That’s because LNAV is following a prescribed path, whereas CTT is trying to maintain a constant direction of travel. The disturbances off the geodesic path will be completely corrected with LNAV navigation, but not completely by CTT navigation, which restores the direction of travel but not the lateral offset of the new path. So, CTT can slowly “drift” off the geodesic due to numerous small lateral displacements. I have estimated that this CTT error off the initial geodesic could amount to as much as 0.1 degrees of average bearing error.
@Sid Bennett,
You said: “I have looked at this problem as one of step-wise refinement of the math model. However in the case of the fuel consumption, I wonder if we can consider the result “good enough”? If not, how can we proceed?
Based on this result, I think one can argue that there is only one high altitude path.”
As I have demonstrated, at 186 degrees there are two candidate routes, with the higher one having a higher probability. It has a high fuel probability, so it is certainly feasible from a fuel perspective.
We can proceed by figuring the fuel probability using the method described in our paper. That puts the higher altitude 186 degree route into a similar position of importance as many of the bearings between 172 and 186 degrees. It has a fairly good overall probability, but it is still significantly lower than the 180 degree route, which has the highest overall probability and a unique “feature” in Figure 19 which has not been found at other bearings.
@Sid Bennett
You stated: “I was considering the rhumb line selection by a pilot who didn’t want to bother entering a further waypoint.
Do you mean, that the pilot on reaching waypoint ISBIX, selects Heading Reference Switch from NORM (Magnetic) to TRUE, selects HDG/TRK on the MCP to TRK and then presses HOLD, to initiate a CTT on the current track?
@Richard,
Something like that….
@Sid Bennett
The HDG REF switch is intended for use in polar regions, and only where the pilot needs to engage a HDG or TRK mode (ie HDG SEL, HDG HOLD, TRK SEL, TRK HOLD). In all other cases, the HDG REF switch is selected to NORM. The FCOM states:
“Use TRUE when operating in regions where true referencing is needed. Use NORM in all other regions.”
It is certainly possible to change the heading reference outside the polar regions, but as DrB asked above: “Why would anyone change the switch, and why would anyone pick 186 degrees CTT?” The likelihood of such a scenario is very low, in my opinion.
@Andrew
It matters little to me that SOP is to use NORM. The switch has a position and can be selected.
More importantly, the 186 path depends on nothing but the Inmarsat data.
To look at it another way, the pilot could have cranked in a 186T or whatever rhumb line azimuth would be the best approximation heading to the 186T path at about the location of IGOGU and called it a day. (Of course that is not how it happened.)
I’m not sure we could tell the difference. It needs to be computed.
Once we get away from the 180T hypothesis as the only solution, many options are open to testing.
(BTW, if there was something distinctive about the selection of CTT at ISBIX, it might help us understand the time when un-piloted flight began.)
For argument’s sake, let’s say the 180T and 186T paths have equal probability with respect to the satellite data, fuel, etc. Which path would you say is more likely – the one that requires unusual switching and an ‘odd’ choice of track (why 186°?), or the one that doesn’t?
My previous post should have been addressed to @Sid Bennett.
“Why would anyone change the switch, and why would anyone pick 186 degrees CTT?”
If you were going to “check out” at either IGOGU or ISBIX, I certainly would select true.
Why Switch ?: Two reasons.
(1) No one in the professional aviation world would think you would do so, so, confuse them (us) a bit more.
(2) Most important though, just look at the isogonic lines on any marine or air navigation chart of the IO.
Why 186 ?: Two reasons.
(1) He didn’t want to go anywhere near Australia and/or JORN (which he knew about).
(2) Without using an unreachable LNAV endpoint, prevailing westerly winds, particularly the “possibility” of encountering and crossing jet streams, would push it to the east. A 4 degree right offset would be a reasonable selection as an “averaging” countermeasure, indeed, it could have been 5 degrees, or more, and although the resultant straight path we think we see is 4 degrees, it may not actually be strait, it may have some minor “wiggles” in it, as it proceeds south through the variable ind fields, making it even harder for us to nut it out.
@DrB
Thank you for your reply yesterday 3:12 pm. I was not specifically aiming at CTT 186 deg. Personally I feel such path might end a bit far south in the light of indications from drift analysis.
For example I find really good BTO fits for CTT 183 deg for FL 374 and above.
Regarding control mode / navigation (why CTT): same can be asked for flying straight south by waypoint. Imo impossible to answer without knowing the exact intent of person in control.
With the great analytic tools that have been developed it is possible to leave it open, which I think is better (at the cost though of the incredible amount of time and effort you and others are spending on doing such complete analysis).
@Richard (cc DrB)
Thank you for your posting regarding fuel performance factor and flow sensor calibration. In the past days I have been reading more in detail about the fuel model error analysis and one of the main questions I have is what the impact would be if the estimated error probabilities for available and required fuel at 19:41 (which are assumed Gaussian distributed with zero mean if I understand correctly) would have a non-zero mean, for example due to a calibration error in the fuel flow sensors. It looks to me in that case the variance formula for error propagation would perhaps not be sufficient.
So I’ll read with great interest.
“Why would anyone change the switch, and why would anyone pick 186 degrees CTT?”
I am NOT a supporter of 38 South, but if I was, I would say perhaps the pilot had calculated the sunlight terminator and possibly had factors in his head for how many degrees track he needed depending on his arrival time at IGOGU.
@TBill
The terminator has been mentioned at times. How do you think it fits in the scenario?
@Andrew
Of course, all of our work has previously been done on a LNAV path. Once that path is considered probable, it is worthwhile to discuss any possible variations. So, whether the CCT is likely or not, changes the actual intersection with the 6th arc little from the point of view of the search.
@Andrew
You said:
“For argument’s sake, let’s say the 180T and 186T paths have equal probability with respect to the satellite data, fuel, etc. Which path would you say is more likely – the one that requires unusual switching and an ‘odd’ choice of track (why 186°?), or the one that doesn’t?”
The CCT is at the moment just a comment. The analysis, based on a start point at 18:22 on N571, revealed that, if a turn to the SIO at any azimuth was made and a LNAV mode was used, the turn needed to be made at about 18:40. The analysis further revealed that a turn at 18:40 had a best fit at 186T. (see my recent post on the subject where the data is linked)
Subsequently we realized that the turn occurred at IGOGU and passed over ISBIX. This could be a coincidence; but, it can be interpreted as continuing to fly on a standard waypoint path in LNAV. That is an interpretation, not a requirement.
Choosing 180T may be considered odd and arbitrary as well. It presumes a destination waypoint that, while not implausible, is not obvious.
@Andrew
I am lazy. Thanks for pushing me.
CCT LRC at 186T at 39000ft works just fine from IGOGU.
-37.67846 88.95534 at the 7th arc.
This is a preliminary result as I have not checked everything in the spread sheet but it looks good.
“CCT”=CTT
@Andrew
Let me withdraw the last post. I see some “minor” problems.
I don’t know whether I can get back to it today as I am expected to be an on-line bridge partner….
@Sid Bennett said: Choosing 180T may be considered odd and arbitrary as well. It presumes a destination waypoint that, while not implausible, is not obvious.
To say that the SouthPole is not an obvious waypoint is bizarre. It is easily entered and is consistent with creating a path that will end as far south as possible upon fuel exhaustion. In fact, I can’t think of a more obvious waypoint.
I seriously doubt that the pilot selected a navigation mode in which the plane flew in CTT mode over a distance of thousands of kilometers. That said, a custom waypoint could have easily been entered to fly a great circle path in LNAV mode until fuel exhaustion and achieved nearly the same path.
The advantage of either a great circle or rhumb line with a track of 186T near IGOGU is the simplicity over the BEDAX-SouthPole path–the entire path is flown at cruise speed and cruise altitude. The disadvantages are the lower route and lower drift probabilities (drift probability near zero, according to David Griffin’s model).
Bobby’s statement that there is sufficient fuel at FL410 to reach 37.5S latitude increases the probability of this path. The question is whether or not the probability increases to the point where it becomes a candidate search area. I have my opinion, but I’ll let Bobby and Richard weigh-in first, as they have studied this more than me.
@MH370Location
You stated “Fuel endurance for my published path at FL150 is within 50 km of the 333 kt MRC exhaustion documented by Boeing in SIR Appendix 1.6E“.
Be careful of using the Boeing Appendix 1.6E, because they got the winds the wrong way around.
The Boeing Segment 1 starts at 17:06:43 UTC and ends at 17:28:19 UTC and FL350 is maintained throughout.
At 17:06:43 UTC the ACARS data and the GDAS data show a wind speed of 17.13 knots and a wind direction from 070°T. The MH370 Heading was 26.70°T (according to the ACARS data) and there was a head wind of 12.75 knots.
By 17:21:12 UTC the GDAS data shows a wind speed of 14.48 knots and a wind direction from 92.4 °T. The Heading was then 32.62 °T and there was a head wind of 7.60 knots.
The ca. 180° turn back then follows, which ends at ca. 17:24:09 UTC. During these 3 minutes, the wind is fairly neutral, partly against you and partly with you.
4 minutes later, at the end of the segment at 17:28:19 UTC the GDAS data shows a wind speed of 15.05 knots and a wind direction from 90.3 °T. The Heading is now 226.03 °T and there was a tail wind of 10.54 knots.
Appendix 1.6E shows an average tailwind of 14.1 knots, whereas the flight path experienced an average headwind of 3.77 knots.
This of course, changes the fuel consumption.
Apart from the winds, Boeing list in their assumptions that they used the “standard day atmosphere“.
The ∂SAT averaged 10.1°C during Segment 1.
This of course, also changes the fuel consumption.
@Dr B. In the paper the fuel probability drops to zero around -37.3 judging from the figure. Now, if I’m reading correctly, it would appear that Sid’s 186 route ending -37.6 is judged feasible with high altitude route. With packs on. I don’t understand. What has changed?
@paul smithson,
You asked: “@Dr B. In the paper the fuel probability drops to zero around -37.3 judging from the figure. Now, if I’m reading correctly, it would appear that Sid’s 186 route ending -37.6 is judged feasible with high altitude route. With packs on. I don’t understand. What has changed?”
You must have missed reading my previous comment HERE .
The high fuel probability doesn’t actually occur for the 186 degree route at FL410 with packs on, but the same route flown with packs off has a high fuel probability.
@paul smithson,
If the link above doesn’t work for you, paste this in:
https://mh370.radiantphysics.com/2020/03/09/new-report-released-for-mh370-search/#comment-27866
For some reason the link is keeping a parenthesis at the end.
@paul smithson,
@DrB,
Confusion reigns.
Figure 37, Route Probability, in the joint report, or paper, and repeated in the top panel of Figures 5 and 15 was presumably prepared as part of the Route Analysis prior to the Fuel Analysis having been conducted. Derivation is part of Appendix G, but the overall Route Probability is not presented there, as it would appear that derivation of the Final Fitted SIO Route outweighed the overall probability in perceived importance.
Your confusion, Paul, was similar to my initial reaction.
But it soon became apparent that the route probabilities that DrB has recently tabled [such as 54.4 per cent for Trial#916 at FL410] were well below the highest route probabilities within Figure 37.
That there was a high fuel probability for a specific route example of relatively low route probability thus became less important.
But the question remains: What does the second-to-top panel of Figures and 15 represent ? This is Figure D-3 from Appendix D.
DrB: Please: Does this represent the fuel probability for the specific optimum routes whose probabilities are plotted in Figure 37 (and the top panels of 5 and 15). ?
If so, the second panel is dependent upon the first (where-as the third and fourth panels are completely independent).
@Dr B. I share @Paul Smithson’s confusion. Lines 6 and 38 say the packs are on and 38 the same. Your comment to Paul indicates that they were off. Maybe two earlier versions have been replaced by these?
I cannot find where in your comment 2786 this is clarified. In its para 2 it says they are on.
@Dr B. My problem is this. I had understood that you have maintained that a terminus south of ~37S is simply not fuel feasible. Specifically, Figure 15 p6/177 of the report showing “probability of the fuel model matching the known endurance” indicates probability <10% for everything south of 35.7S and zero for everything south of 37.3S.
I interpret your commentary on Sid's route (which ends around 37.6S) to be saying that it is fuel feasible at FL390, LRC and even more so at FL410, LRC – in both cases with packs on (albeit with start point shifted south ~0.3 degrees).
The "fuel required" (row 17) is 33,751kg for cases 2,3 and 33,599kg for cases 4,5. I am not sure what benchmark of "fuel available" you are comparing these to? In my estimation, fuel remaining at this point is 34,244kg – comfortably adequate with ~0.5T to spare.
In short, this commentary on the 186 degree route study appears to demonstrate that a final latitude of 37.6S is attainable. With packs off (about another 7 minutes?) and dipping into the 1 sigma error margin (about another 4 minutes) should get you down to ~39S.
My enquiry (and confusion) is not about the specifics of Sid's route, but whether you have revised your views on whether latitudes south of 37S are reachable. The issue is important because (as sk999 earlier noted) the fuel feasibility is the main factor that elevates the combined probability of your search zone compared to areas further south.
In addition to above questions:
For Cases 2 through 4, the value in Rows 17 and 22, The tabled Required Fuel on Board, is numerically equal to the (my) calculated Fuel Available on Board.
For example: Case 4: 201,205 – 174,369 = 26,836
I found this because I was interested if the fuel available produced a shortfall or excess.
For clarity,
That is, in addition to the above questions from Paul, David and George.
@Richard
Thank you for the GDAS wind computations vs Boeing approximations. They did say they only sampled winds twice at 1800 and 0000 and interpolated, so perhaps why their values are off.
They also fly at constant speed regardless of weight (and my path speeds may be worse).
Winds would not be favorable for the ENE segment of my path vs their SE heading, either.
Still, I take their fuel endurance as a ballpark figure. I think it would take a large FE estimate shortfall to rule out a specific location where a noise was heard. It would have to be enough to make the destination unflyable.
My path would be 68 km shorter if the plane flew direct from XMAS to the 7th arc.
Just curious, Appendix 1.6E notes that there’s an overspeed control law that automatically increases angle of attack, and it takes pushing forward on the column during an alarm to override it. Presumably that was taken into account for the end of flight scenarios. (Only works for level flight?)
While on the subject of latitude discriminators, allow me to comment on the drift study results described in Appendix H. The commentary on Figure H-1 states “Similarly, crash latitudes south of 37°S have very low probability (although the uncertainty is higher in this region because the number of drifts is low).
The Table H-1 describes the Girffin et al CSIRO 10 Nov 2018 as comprising “Crash latitude range 8 – 36S”. I can’t understand how the results can include latitude 36.0 – 37.0 if the source model was limited to 8S – 36S. I also don’t understand how “the number of drifts is low” south of 37S for the same reason.
If the drift model did not extend to crash latitudes south of 36 (or perhaps 37?) then the absence of results south of that is a limitation of the model parameters, not an “zero drift probability”. Since 36.0-37.0 is the mode in figure H-1, it would be very surprising if the actual probability distribution dropped abruptly to zero.
So what exactly is the evidentiary basis of the oft-repeated assertion that drift model results counter-indicate southerly termini?
@DrB. As now I understand it at the 18:39:30 start time at least 33,599 kg of fuel was required but that would need to be reduced by the packs-off 452 kg savings to get to -37.5+ S.
@Sid
Re: Sunlight on 38 South paths, the flight would be mostly in darkness but there would be sunrise just before the crash/landing. Some 38 South proponents cite that as the proposed strategy of the pilot. Presumably that assumes the pilot was active and attempting to execute a ditch-style landing, possibly with a glide.
@MH370Location
You stated regarding the Boeing Appendix 1.6E “They did say they only sampled winds twice at 1800 and 0000 and interpolated, so perhaps why their values are off“.
I agree, but my point about getting the winds the wrong way around was based on the ACARS data at the start of Segment 1 at 17:06:43 UTC. It appears that Boeing took the ACARS wind data from the aircraft showing a wind speed of 17.13 knots and a wind direction from 070.0°T and misinterpreted it as 17.13 knots to 070°T.
From the ACARS data, the resulting TAS is 484.4 knots and GS is 472.1 knots. Boeing state the average TAS was 478 knots and the average tailwind was 14 knots and you might falsely conclude that the average GS was 478 + 14 = 492 knots, when in fact Boeing probably meant 478 -14 = 464 knots.
I only pointed out that the ACARS matched the GDAS data, which shows for the ACARS position at 17:06:43 UTC of 5.299°N 102.183°E, altitude of 35,004 feet, a wind speed of 18.16 knots and wind direction from 76.1°T, to show the general alignment between the ACARS data and the GDAS data. I agree that the Boeing interpolation of the GDAS data may also have been in error.
In addition the official ADS-B data shows at 17:06:43 UTC a position of 5.289°N 102.803°E, heading of 25.4°T, altitude of 35,000 feet and GS of 469.3 knots.
Further the Kota Bharu TAR radar shows at 17:06:43 UTC a position of 5.285°N 102.801°E, track of 26.4 °T and GS of 475.3 knots (assuming an altitude of 35,000 feet).
Following the Boeing flight path through Segment 1 shows an average TAS of 484.0 knots (not 478 knots) and average GS of 479.9 knots (not 492 knots), based on Boeing’s assumptions.
The bottom line is you cannot rely on the fuel analysis from Boeing in Appendix 1.6E being accurate for our flight path modelling.
@370Location
You asked “Just curious, Appendix 1.6E notes that there’s an overspeed control law that automatically increases angle of attack, and it takes pushing forward on the column during an alarm to override it. Presumably that was taken into account for the end of flight scenarios. (Only works for level flight?)“.
Yes! This was taken into account for the end of flight scenarios.
The autopilot disconnects after dual engine flame out.
@Andrew has previously suggested, in order to explain the roll input necessary in order to achieve the downward acceleration in the required timeframe during the end of flight, there are only limited possibilities:
(a) An active pilot at the controls, helping the dive.
(b) The dead-weight of an incapacitated pilot, slumped over the controls after the autopilot disconnected.
(c) The asymmetric yaw from an unlikely momentary engine relight.
@370Location: To follow up on @Richard, the overspeed protection only occurs when the flight control mode is NORMAL. After the second flameout and power is lost for both transfer busses, the flight control mode transitions to SECONDARY. Even after the APU comes online and power is restored to the main and transfer busses, the flight control mode remains in SECONDARY, unless the Flight Control System (FCS) switch position is manually cycled, and then only until the APU shuts down.
@TBill
Yes, I have heard that explanation. I just wondered if there were any other factors to consider.
If that were the case, what sun angle to the flight path would be most advantageous during the descent?
@Richard
I didn’t grok on the first reading that Boeing actually flipped the wind direction 180. Thanks for making that clear.
Thanks also for the recap and details on the overspeed discussion. I was not around for that. Very Helpful.
@VictorI
So, no overspeed correction after second flameout without pilot intervention, if I understand right.
Thanks once again.
@paul smithson
You stated: “I can’t understand how the results can include latitude 36.0 – 37.0 if the source model was limited to 8S – 36S. I also don’t understand how “the number of drifts is low” south of 37S for the same reason“.
David Griffin’s and the CSIRO analyses covers from 7°S to 45°S.
In the CSIRO first report they concluded:
“There is a region within the 36-32°S segment of the arc, near 35°S that is most consistent with all of the following lines of evidence, taken together:
(1) absence of detections during the 2014 surface search .
(2) absence of findings on the WA coastline.
(3) July 2015 arrival time of the flaperon at La Reunion.
(4) December 2015 and onwards (only) arrival times of other debris in the western Indian Ocean.
We therefore conclude that while the whole 36°-32°S region is prospective, the subset region near 35°S appears to be the most likely location of the aircraft.
In the subsequent CSIRO reports, this conclusion was confirmed each time.
Therefore David Griffin suggested, that he only need give us the data from 7.5°S to 36.5°S for our analysis, as below 36.5°S was not possible in his view.
@Sid
The 38S sunlight theory I am not the expert, but I assume it presumes the pilot wanted to see the surface of the water for a ditch. So perhaps about sunrise +15-30min would give adequate surface visibility.
@Richard, thank you for this clarification. Then the “probability of the CSIRO Drift Model matching the 9M-MRO Debris Reports” was assessed as far as 36.5S and the region beyond that was “not assessed” in your reanalysis rather than being probability=0.
However, it is simply wrong to say that “below 36.5 S is not possible”. That is not what the data shows and it is not what the authors say in their interpretation and commentary.
The Part 1 report debris results basically concluded that debris items came from between 32S and 39S. “Are other regions also prospective? If the flaperon had remained the only piece of debris found we would have to say ‘perhaps’, but now many debris items have been found, we can conclude that regions north of 32°S and south of 39°S are both less likely. Drift modelling suggests that debris items originating north of 32°S would probably have been detected by the surface search, and that items would have probably arrived in Africa before December 2015. Regions south of 39°S are not prospective either, because debris from those regions would more likely have turned up on Australian coastlines than west Indian Ocean ones.” Discussing the effect of local NW/SE currents along the arc and its influence on subsequent trajectory, they also argued (p23) that “This absence of findings argues against three latitude bands as potential entry locations. These are near 33-35°S, 36-37°S and 39-42°S, leaving sites north of 32°S and bands around 35-36°S and 37-39°S as being more consistent with the absence of Western Australia (WA) debris findings.”
The Part II report updated these results with important insights gained from the drift characteristics of an actual flaperon – travelling faster than they had assumed in their original model, and to the left of wind direction by 10-20 degrees (their empirical mean 16 degrees). The updated conculsion on the origin of the flaperon? “The July 2015 arrival date of the flaperon at La Reunion island is consistent with impact occurring between latitudes 40°S and 30.5°S.” They also cited additional observations (width of undersea search to date, absence of debris in Australia and null result of the aerial search) to say that they favoured 35S as “the only one that is also consistent with other factors”. The Part III report also updated their drift simulation to inlude high windage debris items (figure 4.1)
Part IV report focuses more on the consistency of the Pleiades imagery with the purported 35.5S origin. However, at page 21 I noted that even from this preferred location “Panel 3 shows that there is only a very small chance that any of the low-windage debris would have washed up on the coast of Australia. Panel 4 shows that a few items of high-windage debris – if they were still afloat – are hindcast to have washed up at some remote locations on Australian shores.” So it appears that even the non-recovery of drifted items from Australia is also not quite the binary qualifier that it is sometimes depicted as.
I have responded at some length because I happen to have re-read these reports today and I think it is important not to misrepresent their findings and conclusions.
Still on drift… The executive summary of the report says:
The third panel in Figure 5 (the grey curve) is the probability that the CSIRO debris drift model predictions are consistent with both the locations and the reporting dates of MH370 debris. A novel method for combining time and location was applied to provide a single figure of merit (probability) for each crash latitude. Crash latitudes between 35 °S and 33 °S have the highest debris drift probability.”
The panel in question exhibits a maximum at 36.0-37.0 (right before it has been cut off). 35.0-36.0 has a high probability that is virtually indistinguishable from 33.0-34.0. That doesn’t quite align with the statement in the last sentence above.
Let me offer a status report, in the hope that comments from readers will assist in the analysis.
I have constructed a scenario comprising a start at IGOGU with ISBIX as a waypoint. Subsequent to ISBIX as a discontinuity, the path continues as a loxodrome at the entry azimuth to ISBIX. I fixed the altitude at 41000ft with LRC (constant M at about 0.84 is similar). I obtained quite good results and a reduction of about 70kg in fuel consumption. The end point moves slightly North along the 6th arc.
Exploring the effects of start time and start latitude on cost, it appears that changes of 15 secs (current step resolution) and 0.05 in latitude of the start are meaningful changes. This suggests an unique start point. However I expect that a GCP starting at a similar point would also be considered a fine fit.
Since some of the details of the path near IGOGU are really difficult to model in the type of spread sheet that I am using, I raise the question that I posed about 6 months ago as to whether one of the better flight simulators could help in refining the start conditions for the southern leg.
I particular, whether the turn was made from the N571 center-line or
a path offset to the North (and how far North). A program which obeyed the FMC rules would be the most straightforward approach. It is not a good use of my time to learn to run one of the simulators, but perhaps there is a reader who wishes to collaborate.
If this is not be best place to do that, can anyone recommend a suitable site to try?
@David, George G, paul smithson,
Let me address your questions in a general sense with a brief summary of how we calculate the route probability in our paper. There is a description of this in Appendix D, but it is unclear on one point (due to some inadvertently missing text), and this may be causing some confusion. I shall add that missing text to that section to make it very clear.
1. There are 9 Cases (numbered 1-9) of pre-19:41 routes which produce 9 estimates of available fuel at 19:41. These are intended to cover the range of possibilities.
2. There are four post-19:41 Options (A, B1, B2, and C) which address the four possible post-19:41 aircraft configurations.
3. Thus, there are 9 x 4 = 36 possible combinations, of which 9 are excluded due to incompatibility, leaving 27 viable combinations.
4. Each of those 27 viable combinations has a unique value of fuel shortfall/excess. The smaller the shortfall/excess, the higher is the probability.
5. To standardize the route fitting method, and to minimize the amount of work involved, we fit all routes with Option A, which is the air packs ON and the cross-feed valves CLOSED.
6. We generally show the required fuel available at 19:41, for a particular route, assuming Option A.
7. The required fuel at 19:41 may be calculated for the other three Options (B1, B2, and C) from the Case A value by scaling, as we showed using the percentages given at the top of Table D-3.
8. Thus, we only need to fit Case A, and then we can simply find the fuel shortfalls and probabilities for the other three options by scaling.
9. When we quote a “fuel probability” for a given route fit, we select the MAXIMUM probability among the 27 viable combinations. In most situations, this occurs for Case B1 (air packs OFF).
10. So, while we fit a route using Case A assumptions (air packs ON), the route probability we generally quote is for the highest probability, which in most cases is Option B1 (air packs OFF). This maximum fuel probability is what is plotted in Figure D-3 and the second panel in Figure 15, and it corresponds to the same SIO route fits whose route probability is shown in the top panel in Figure 15.
I think this last item is creating confusion. The method we chose is intended to separate, as much as possible, the route fitting process from the fuel probability determination. We can’t fit each SIO bearing for 27 combinations of pre-19:41 fuel availability and post-19:41 fuel requirement. So, we fit one post-19:41 route assuming Case A, and we can then compute the fuel probabilities for the other 26 viable combinations. Then, we find the highest fuel probability among the 27 values. The intended description of that last step, selecting the maximum value, got lost somehow in the paper preparation process, and I shall put it back.
To demonstrate this methodology further, I modified the table of 186-degree fits that I showed previously, to include the fuel probabilities for the four post-19:41 Options. That allows one to see what the fuel probability is with air packs ON and with air packs OFF (and with cross-feed valves CLOSED and OPEN).
The extended table is available HERE .
I also added a route fit using M0.84 at FL370, which is the original peak found in the route probability and used in our bearing study.
@paul smithson,
You asked: “So what exactly is the evidentiary basis of the oft-repeated assertion that drift model results counter-indicate southerly termini?”
It is primarily the lack of debris finds in Western Australia, which appear to increase rapidly to the SW along the 7th Arc.
David Griffin’s latest data set extends somewhat beyond 36S crash latitude, to about 36.5 S.
To illustrate the effect, I have made a new plot of the probability that a drift that beaches somewhere, actually lands in Western Australia. It is available HERE .
This plot shows that for all crash latitudes north of 31.5S, less than 3% of the beached debris should land in Western Australia and nearby islands. With about 28 debris, that corresponds to an expected value of less than one debris find. The plot shows how rapidly the probability grows with more southern latitude. In only 5 degrees farther south, at 36.5S, the probability is up to 12%, so one out of every eight beached debris land in Western Australia. With ~28 debris, that is 3-4 expected finds in WA. Clearly, this is unlikely to have actually occurred, because there were concerted efforts to find MH370 debris on WA beaches, and none were found. So, crash latitudes below 35S generally become more and more improbable. There are some narrow variations with latitude due to localized currents, but the general trend is quite clearly shown by the CSIRO predictions.
The black dashed trend line in the figure indicates that the probability of beachings in WA is expected to be even higher for crash latitudes south of 36.5S, and the discrepancy with actual debris finds grows even larger. This large discrepancy is what drove us to the conclusion that a far south crash is improbable, because the probability generally decreases rapidly the farther south you start the drifts.
The novel drift probability formulation we developed was, of course, not used by Griffin et al, although private communications indicated David thought our formulation was a useful single metric that combines all the available information (beaching location, drift days, flaperon, non-flaperon, etc.). It has a high peak with essentially constant probability between 33 and 37 degrees south latitude. We believe that beyond 37 S the drift probability declines fairly rapidly to negligible values. It would be nice to have more drift predictions in that latitude range, to better define the drop-off, but as far as I know there are no plans at CSIRO to do this.
@DrB
Thank you very much.
Please allow time for consumption. 😀
@paul smithson
(1) Misrepresenting the CSIRO findings as showing a MH370 end point at 39°S.
CSIRO Report – The search for MH370 and ocean surface drift – 8th December 2016
Conclusion: “We therefore conclude that while the whole 36°-32°S region is prospective, the subset region near 35°S appears to be the most likely location of the aircraft.”
“Latitudes south of 39°S are quite strongly contra-indicated by the arrival times of the flaperon and other debris reaching Africa, and the fact that those items were many while findings anywhere on the Australian coastline were nil”
CSIRO Report – The search for MH370 and ocean surface drift Part II – 13th April 2016
Conclusion: “In summary, our conclusions with respect to the location of the aircraft are unchanged.”
“Modelling the flaperon’s drift as being 20° left of the wind, and 10cm/s in excess of the Stokes Drift, is very consistent with the July 2015 arrival time of the flaperon at La Reunion. But this is true for all potential crash locations between 40°S and 30.5°S, showing that the arrival time at La Reunion of a single item is, unfortunately, not a precise guide to the location of the crash.
CSIRO Report – The search for MH370 and ocean surface drift Part III – 26th June 2017
Conclusion: “Assuming that some of the objects identified in the Pleiades images are indeed debris items from 9M-MRO, we have shown that there is an impact location that is consistent with those sightings, as well as all the other evidence reviewed by the First Principles Review. This location is 35.6°S, 92.8°E. Other nearby locations east of the 7th arc are also certainly possible, as are a range of locations on the western side of the 7th arc, near 34.7°S 92.6°E and 35.3°S 91.8°E.”
No mention of 39°S.
CSIRO Report – The search for MH370 and ocean surface drift Part IV – 3rd October 2017
Conclusion: “We stand by our earlier conclusion that the surface search had a fairly high chance of detecting a debris field if the impact had been near the segments of the 7th arc postulated at the time of those searches”
No mention of 39°S.
(2) Misrepresenting our findings as showing a MH370 end point from 36.5°S southwards is not assessed.
We have completed 46 MH370 drift analyses of MH370 floating debris from 10°N to 50°S, many of which have been published on this web site and presented to CSIRO, ATSB and Ocean Infinity.
We have reviewed in 17 MH370 drift analyses by renowned oceanographers.
We have participated in MH370 drift analyses by renowned oceanographers and our work on MH370 drift analyses has been cited by renowned oceanographers.
A summary of our assessment can be found at the following links:
https://www.dropbox.com/s/kvopmlhyxej0cbu/Drift%20Analysis%20of%20MH370%20Floating%20Debris.pdf?dl=0
https://www.dropbox.com/s/savkhqzrjxbz1qd/Bobby%20MH370%20Debris%20Drift%20Model%20Analyses%20%28published%29.pdf?dl=0
@DrB (cc Richard)
You wrote: “David Griffin’s latest data set extends somewhat beyond 36S crash latitude, to about 36.5 S”
Is there a difference to the data used for the second CSIRO report? There (figs. 3.2, 4.1) starting latitudes down to -42 degrees have been included.
@DrB. Thank you for your most helpful explanation and the expansion of your 186˚ LNAV Table 1.
Supposing I have it right, packs-off from 18:39:30 in Cases 4 & 5 would extend those fuel savings by (33,599 – 26,836)*0.017, another 115 kg.
@Richard.
“Misrepresenting the CSIRO findings as showing a MH370 end point at 39°S.” Who said that?
What I did say is that it is NOT correct to characterise the conclusions of CSIRO reports I-IV as declaring that south of 36.5 is impossible. I stand by that.
As you are well aware, the conclusions of the CSIRO reports drew upon the convergence of multiple criteria (such as the width of search along the arc to date, the coverage of the aerial search) in their assessment of “the most likely” locations along the arc. Their preferred/recommended locales between ~32S and ~40S draw upon those additional observations.
CSIRO’s quantitative DRIFT results for non-flaperon debris are shown in lower 3 panels of Figure 3.2.1, page 18 https://publications.csiro.au/rpr/ws/v1/download?pid=csiro:EP167888&dsid=DS1
CSIRO’s updated quantitative results for “genuine flaperon” inclusive windage and 2 variations (10 degree left, 20 degree left) leeway angle are shown in Figure 3.2, page 14. Quantitative results for high windage items are shown in Figure 4.1, page 15 of the same report.
https://publications.csiro.au/rpr/ws/v1/download?pid=csiro:EP172633&dsid=DS4
Rather than blustering and setting up a straw man, you might care to address the facts at hand.
@Dr B. Thank you for your comments on drift analysis.
1. I second Niels request for clarification on the dataset that you are referring to. How does this differ from that used for the CSIRO Part I and Part II report?
2. “We believe that beyond 37 S the drift probability declines fairly rapidly to negligible values. It would be nice to have more drift predictions in that latitude range, to better define the drop-off, but as far as I know there are no plans at CSIRO to do this.” Although the dataset you allude to doesn’t extend that far, the published results of CSIRO’s quantitative analysis do. And I believe that their results are somewhat more nuanced than a steep drop-off beyond 37S.
3. I acknowledge the general tendency for the beaching probability Western Australia:West SIO ratio has a *general* tendency to increase the further south along the arc you go. However, the overlay of the effect of local currents has a surprisingly large effect on W Australia beachings, to the extent that Part 1 report says: “This absence of findings argues against three latitude bands as potential entry locations. These are near 33-35°S, 36-37°S and 39-42°S, leaving sites north of 32°S and bands around 35-36°S and 37-39°S as being more consistent with the absence of Western Australia (WA) debris findings.” I also acknwoledge that this differention of specific latitudes that tend not to send debris to W. Australia is less pronounced (though still evident) in the case of high windage items.
4. The new plot that you provided on “the probability that a drift that beaches somewhere, actually lands in Western Australia” is elegant and informative. Is this low-windage items? Of course CSIRO didn’t depict their results in this ratio form. Nonetheless, your results appear quite different to those depicted in figure 3.2.1, at least as regards the 35S “lacuna” in W.Australia beachings. Would you care to comment?
@paul smithson
I addressed all the misrepresentation that you made.
@Sid Bennett
Victor stated “The question is whether or not the probability increases to the point where it becomes a candidate search area. I have my opinion, but I’ll let Bobby and Richard weigh-in first, as they have studied this more than me.”
I do not believe your MH370 end point is a candidate search area, for the following reasons:
(1) Compared to our baseline flight path which has a composite probability of 72.7%, your baseline flight path has a composite probability of 0%.
(2) Your flight path does not match the drift analyses, in particular the absence of findings on the Western Australian coastline as both Victor and Bobby have already pointed out.
(3) The combined route and fuel probability is at best 53.5% and then only changing the flight level to FL410, changing the start point to near waypoint ANOKO and using fuel option B1 (air-conditioning packs off, no rebalancing and cross feed valves closed). Our combined route and fuel probability is 86.0%.
(4) The random data trials performed by Bobby on a LRC path show a track of 180°T and an end point of 34.25°S with a route probability of 93.0%. Random LRC path data trials do not show a flight path near 186°T.
Here is a link to a comparison table in more detail:
https://www.dropbox.com/s/sh2muxavdr4doin/Flight%20Paths%20Comparison.png?dl=0
@Richard. “I addressed all the misrepresentation that you made.”
Oh dear. There goes another one.
@Richard. Re: your comments on “Sid’s route”.
Your composite is zero because it is scored “0” on drift probability. By your own description above, your drift model used here does not cover latitudes beyond 36.5S. Sid’s route terminus is indicated variously as 37.4S-37.6S.
The main paper Figure 5 panel 2 shows fuel probability of zero at 37.3 and beyond. Your table referred above now shows fuel probability for a route ending between 37.5 and 37.6 of >90%, even from the more northerly starting point at FL410 LRC. This is no longer consistent with Figure 5.
Thus of the two chief criteria previously cited to rule out flights ending in this zone, one is”not available/applicable” or “reconsidered/no longer applies”.
Since I don’t have a dog in this particular fight, I shall refrain from any further commentary on the merits or otherwise of Sid’s route. But it appears things are not quite as black and white as Fig 5 panels 2 and 3 might suggest.
@Sid
Trying to understand your case in pilot terms.
I think you are saying discontinuity at ISBIX. After that, is the aircraft flying south normally (magnetic heading)? Or did the pilot switch to True Track? Alternate case might be pilot never used waypoint but set to CTT at IGOGU and just happened to cut close to ISBIX, and perhaps used ISBIX as guidepoint vs. waypoint.
As far as flight sim, not sure what your question is, but it is somewhat complicated case coming off N571 Offset to an alternate heading with sharp turn >90 deg. That was one of the first things @Andrew did for us, he used a commercial flight sim to define how DrB’s earlier path would behave with FMT at IGOGU.
@paul smithson
I already explained our analysis covered 10°N to 50°S.
@richard. Nevermind, I see no point in continuing. My points have been made – and you have manifestly failed to address them.
@Paul Smithson
My position is much simpler than that. A waypoint route from IGOGU to ISBIX with no additional waypoints represents a discontinuity in the flight plan and the FMS handles the overflight of ISBIX by adopting the incoming azimuth to ISBIX as the true azimuth to fly subsequently. I have seen this described in a number of the 777 manuals.
As it turns out, the 186 route from IGOGU to ISBIX is essentially the same in loxodrome or GCP and probably cannot be distinguished except using other evidence or inference. The difference is in what the pilot did.
But, when a waypoint route is flown, after the discontinuity a loxodrome is flown, not a GCP. This slightly shortens the path.
Can you provide a reference for @Andrew’s work?
@DrB
As for your latest table:
In case 6 why did you start a full degree further North?
Also, since it is clear from previous discussions that the LRC and fuel model works better above 39000, why didn’t you run a case 2 at FL400 or FL410?
I have found that very small changes in the initial conditions of the route at IGOGU can optimize the path errors. But I would like to link this start point more clearly to a FMS-flown preceding route
Unfortunately, we only have a model and it is only an approximation to the conditions existing at the time. Except for a high altitude LRC, how would the pilot choose an altitude?
None of the fuel model cases address a situation where the air packs and most of the electrical load were off for the hour prior to 18:24. Also, one assumes that the electrical load subsequently was much lower than normal, and the fuel savings were not addressed. Since the amount of fuel needed to be considered between the various cases differs by only about 300kg, this is an important consideration.
To be clear, I am not proposing a specific route where the altitude, and starting position are exactly specified. I think it is close, but until this recent round of discussions, I have been content to describe the route as IGOGU-ISBIX +186T. A more precise definition is not needed to define a search area.
@Sid. Your first queries mis-addressed to me. Returning to sender 🙂
@Sid Bennett: But, when a waypoint route is flown, after the discontinuity a loxodrome is flown, not a GCP. This slightly shortens the path.
As a number of us have said, that’s false. That discussion occurred here years ago. After finding contradicting statements in manuals, Andrew resolved the issue by running experiments in a Level D simulator.
After a discontinuity in LNAV mode, the plane continues on a constant heading (while remaining in LNAV mode). Whether it is a true or magnetic heading depends on the position of the HDG REF TRUE/NORM switch.
@paul smithson
You appear to be rather obtuse. I included links to previous studies, which explain why we had discounted end points southwards of 36.5S, but it seems that you did not read them.
David Griffin also agrees that points southward of 36.5S do not match his drift analysis, but you choose to ignore this.
Meanwhile you harp on like a broken record and continue to cherry pick any statement, that you can twist into fitting your flight path model ending at 39.5S.
This area was not searched for a reason, because the fuel exhausts before you can reach it.
@Richard. Hell’s bells. I don’t know why I bother.
@Niels,
I have recently asked David Griffin about differences between the two prediction data sets, if any. I also requested the predictions down to 42°S. If that is forthcoming, I will extend the drift probability curve as far south as his data set goes.
@paul smithson,
You asked: “The new plot that you provided on “the probability that a drift that beaches somewhere, actually lands in Western Australia” is elegant and informative. Is this low-windage items? Of course CSIRO didn’t depict their results in this ratio form. Nonetheless, your results appear quite different to those depicted in figure 3.2.1, at least as regards the 35S “lacuna” in W.Australia beachings. Would you care to comment?”
On the first question, the answer is yes, that data set includes only the flaperon and low-windage non-flaperon debris.
Regarding the gap in Figure 3.2.1, it is evident in my Western Australia figure as the point at 2% and 35.5. I don’t see it as being “different” at all. There are two things which can affect such comparisons. One is that I used 1 degree wide bins for crash latitude. I needed that to get enough trials included to have reasonably good statistics. The other effect is that my drift probability is a compilation of 5 geographical zones, whereas the third column in Figure 3.2.1 is for Western Australia only. So, I would not expect my 5-zone drift metric to match the lower right panel in Figure 3.2.1, which is for a single zone.
@Sid Bennett,
You asked: “In case 6 why did you start a full degree further North?”
I didn’t pick a starting point. That’s what resulted from the route fitting process.
You also asked: “Also, since it is clear from previous discussions that the LRC and fuel model works better above 39000, why didn’t you run a case 2 at FL400 or FL410?”
Case 2 is not an acceptable fit, because it forces the GSEs to be zero. I included it as Case 2 as an academic exercise because I thought it might be useful to you to compare the ground speeds I got with your predictions for your best-fit route. I guess you didn’t do that.
You asked: “Unfortunately, we only have a model and it is only an approximation to the conditions existing at the time. Except for a high altitude LRC, how would the pilot choose an altitude?”
One way is to pick the optimum cruising altitude from the Boeing Flight Crew Operations Manual at the current aircraft weight.
You also said: “To be clear, I am not proposing a specific route where the altitude, and starting position are exactly specified. I think it is close, but until this recent round of discussions, I have been content to describe the route as IGOGU-ISBIX +186T. A more precise definition is not needed to define a search area.”
As you have been told several times, it is not possible for the aircraft to fly either a geodesic or a loxodrome after a route discontinuity, with an incapacitated pilot.
@TBill
Please see response above addressed incorrectly to Paul Smithson.
@Richard. One last attempt.
1. My interest in a terminus around 39.5 is no secret. This is certainly a motivation for my interest in southerly parts of the arc and a reason that I critically evaluate claims that it can be ruled out on the basis of evidence. I have not published my proposition, mainly because I have so far not found a scenario that reconciles it with available fuel.
2. If I have been “banging on about it” in my queries and critique over recent days, kindly point out the examples (pl.). Otherwise withdraw your mendacious statement.
3. Your personal belief that the weight of drift evidence completely rules out areas south of (roughly) 36.5S is plain and (you say, without citation) that Dr Griffin agrees with you. You further explained that this is why you didn’t bother including drift data further south than 36.5. Dr B offers a different explanation – that the new dataset did not extend further than that. Whichever the case, it is a matter of fact, not conjecture, that the drift model evidence employed for the purpose of compound probability of terminus does not extend beyond 36.5S. You may believe as righteously as you like your own interpretation of drift evidence. But please do not inflict your blinkered approach to evidence on the rest of us.
4. The CSIRO drift modeling, cited specifically in my previous posts, indicates that debris that reached Reunion and other western parts of the SIO could have originated pretty much anywhere between roughly 32S and 40S. Latitudes further north are counter-indicated by speed of drift – the debris should have shown up earlier. Latitudes further south are counter-indicated by the absence of debris finds in W. Australia and it is “generally” the case that the further south you go, the more likely debris recovery in W. Australia should be. This generality is overlaid with the peculiarity of initial current conditions along segments of the arc referred previously.
5. The CSIROs conclusions on most likely origins are clearly and explicitly based on multiple considerations. These considerations variously include: areas of the arc searched to date, width of that search, aerial search coverage and Pleiades imagery – as well as the timing and distribution of debris finds in Western SIO and the apparent absence of debris recovery on W. Australian coasts. They have been quite explicit about how they reached this recommendation: informed by the drift evidence plus additional considerations.
6. Nowhere in the CSIRO’s DRIFT evidence are locations south of 36.5S explicitly ruled out. On the contrary, with reference to the influence of local currents along the 7th arc, Part II p19 states: “It appears, from our modelling, that the initial direction of movement had a lasting impact on the long-term trajectories…The fact that no aircraft debris was ever found on Australian shores suggests that the aircraft is more likely to have entered the water in one of the latitude bands where the flow was westward.” Then on p23/38 “This absence of findings [in W. Australia] argues against three latitude bands as potential entry locations. These are near 33-35°S, 36-37°S and 39-42°S, leaving sites north of 32°S and bands around 35-36°S and 37-39°S as being more consistent with the absence of Western Australia (WA) debris findings. The point is that CSIRO (not I), state that various locations along the arc that were experiencing NW currents around and after 8 March are less likely to have beached in W Australia. The model of fine-scale local currents along the arc based on altimetry (and supported by SST observations and drifters) is shown in Part 1, Fig 3.3.1 on page 20 and the animated daily snapshots of fine-scale currents can be viewed here (go to date index for alternative dates)
http://www.marine.csiro.au/~griffin/MH370/br15_MH370_84102_1_tp3l1p2d_bh_arc7_4031/20140315.html
7. And by the way, since you mention it, I did read both reports that you cited in your earlier reply. Dr B’s report dated Nov. 2018 seems to be based on the same dataset employed in “The Final Resting Place of MH370” that does not extend beyond 36.5S. Your report dated July 2018 “used the GDP buoy data to build a model of the Indian Ocean from 20°E to 130°E and from 10°N”. This model provides a crude, low resolution, historic representation of ocean surface currents based mainly on drogued drifters. As such, it provides, at best, a qualitative impression of SIO circulation. Ironically, your discussion section includes the statement: “With the benefit of hindsight and the knowledge of the search results from Fugro between 39.5°S and 33.0°S as well as the search results from Ocean Infinity between 36.4°S and 25.0°S, we can rule out 34.5°S and 30.0°S as MH370 end points to a 97% level of certainty”.
@DrB said: One way is to pick the optimum cruising altitude from the Boeing Flight Crew Operations Manual at the current aircraft weight.
The optimum altitude for ECON and LRC is calculated by the FMC, is displayed, and can be selected.
Another strategy would be to choose the maximum altitude, recognizing that the optimum altitude will increase as fuel as burned.
@Sid
OK I see it now.
So you need either (1) an active pilot at ISBIX to reset the A/P controls to True Track at the time of the ISBIX discontinuity (approx 1941) or (2) the aircraft was already flying in True Track mode and it happened to pass by ISBIX.
Bumped into this classic earlier paper by Richard and DonT:
http://www.duncansteel.com/archives/2321
Talks about hybrid path reverting to magnetic course after discontinuity near 37S.
As far as Andrews earlier work, it goes back to early days of Victor’s blog here, but what is the question you have about it? Whatever Andrew discovered is embedded in DrB’s 2016/2017 path to approx. 35S. So you could adopt that path if you like it, or you could adopt the new path, which is slightly different. DrB has a fantastic list of links to all of his papers.
@VictorI, @DrB
I believe that the magnetic correction table is in the AIRDU. The display is on the dashboard.
If you turned the switch from TRUE to NORM, I would guess that the displayed azimuth would change from a heading shown with respect to true North to a heading with respect to magnetic North. The plane, of course would keep flying in the same direction. You could wait a while and switch it back, and it would come back to the original value. (I think.)
It seems to me that the function of the switch is so that instructions for headings given to pilots by ATC are given in degrees, where it is assumed that the instructions are in degrees magnetic. In polar latitudes
the magnetic tables change much more rapidly and using true tracks are more accurate.
Right now you wouldn’t want to believe that the actual magnetic heading in the France/UK area is numerically correct when obtained from the aircraft navigation system. The location of the North geomagnetic pole is changing rapidly and the tables are out of date. But they are out of date for everybody, so things stay organized.
Its sort of like a thermometer display. I can get it in C of F, but the temperature is the same.
@Dr B. Thank you for the clarification. Since timing and distribution of debris on the W side of SIO is a lamentably poor discriminator of starting location along the arc, the absence of debris recovery in Western Australia assumes particular importance. It is clear that from most locations along the arc – even the more southerly ones – debris is more likely to beach in Africa than Australia. The question is to what extent, and that is why I think your ratio approach of Aus vs Africa is an appealing and interesting one.
Given the CSIROs finding that local current conditions exercise a surprisingly large effect on probability of beaching in W.Australia, it is important for such an exercise to use suitably fine resolution boxes for model start segments. It would also be interesting to see the empirical results for arc segments south of 36.5.
For a more complete view, I think high windage items should also be included since a high proportion of recoverable debris – the shattered composite panel – should be of a highly buoyant, low-draught nature. In CSIROs modeling, they found that high windage items from every section of arc sometimes beached in W.Australia.
Whereas previous discussion of the absence of finds in W Aus was quite categorical about the high likelihood of debris identification and recovery there, this (Part III, p21) uses rather more value-laden language: “Panel 4 shows that a few items of high-windage debris – if they were still afloat – are hindcast to have washed up at some remote locations on Australian shores.”
The likelihood of items beaching being seen, identified/recovered and reported is largely the subject of speculation. I am personally of the view that it is not as likely as most folks seem to believe. According to Wikipedia, 92% of W.Australia’s rather small population lives in the SW corner. Judging by this depiction of population density I find it surprising that absence of debris finds there is considered to be remarkable.
The link for W Australia population density referred above was dropped from the post. That’s quite a lot of coastline and not a lot of people. See here:-https://en.wikipedia.org/wiki/Western_Australia#/media/File:WApopDist2006.png
@All
We have made some clarifications and additions in the paper in the download link above. Apologies for the confusion caused!
In Section D.4.2 immediately after the Table D-4 we have added a clarification as follows:
“If no particular post-1941 Option (A, B1, B2, or C) is identified, then generally we choose the maximum fuel probability among those four Options. This is the quantity that is plotted in Figures 5, 15, and D-3.”
In Section D.5, we have added a clarification as follows:
”Figure D-3 shows the maximum fuel probability (of the four post-19:41 Options) calculated using the method presented in this appendix.”
In Section 5.5, we have made a correction as follows:
“David Griffin kindly provided us with the data of the drifts modelled from start points along the 7th arc from 7.5 °S to 36.5 °S for both flaperon . . . .”
In section H.3 following Figure H-1, we have added a clarification:
“Figure H-1 shows that crash latitudes north of 27 °S have very inconsistent predicted and actual landfalls, and therefore they have low probability. Intermediate latitudes, from 27 °S to 37 °S have significant probability. The crash latitudes from 33 °S to 37 °S have the highest probability because they best match both the observed locations and the actual drift days. This includes the 34.2 °S latitude of our BEDAX SIO Route at the 7th Arc, shown by the dashed red line in Figure H-1, which has an estimated drift probability of 95%.
Crash latitudes south of 37 °S are expected to have low probability based on two factors: (1) the increasing inconsistency of predicted drift days due to the longer drift durations required to make landfall at the find locations (especially Africa), and (2) the lack of debris finds in Australia, which is inconsistent with the expected high percentages in that zone. Figure H-2 illustrates this second point.”
We have added a Figure H-2, MH370 Debris Drift to Western Australia, and the following text:
“In Figure H-2 we plotted the fraction of debris trial predicted to make landfall somewhere (within the allowed time window) which were predicted to make landfall in Western Australia. At crash latitudes north of 25 °S, only about 0.3% of the predicted landfalls would occur in Western Australia. That fraction increases very rapidly for more southerly crash latitudes. It rises to about 3% at 34 °S. With 27 debris, that corresponds to an expected value of less than one debris find. The black dashed trend line in the figure indicates that the fraction of beachings in Western Australia is expected to be even higher for crash latitudes south of 36.5 °S , and the discrepancy with actual debris finds grows even larger. At 36.5 °S the probability is up to 12%, so one out of every eight beached debris would land in Western Australia. With ~27 debris, that is 3-4 expected beachings. Clearly, this is unlikely to have actually occurred, because there were concerted efforts to find MH370 debris on WA beaches, and none were found. So, crash latitudes below 36 °S are expected to become more and more improbable, because the predicted drift days become too long to match the find dates and because there is an inconsistency between the predicted and actual number of debris finds in Western Australia. There are some variations with latitude due to localised currents in this area, but the general trend is clear.
Our drift probability curve in Figure H-1 is based on a large data set provided by David Griffin which only extends to 36.5 °S. However, the CSIRO drift studies were done down to 42 °S [Griffin, DA, Oke, PR and Jones, EM (2016). The search for MH370 and ocean surface drift. CSIRO Oceans and Atmosphere, Australia. Report number EP167888. 8 December 2016]. Their Figure 3.2.1 illustrates the decreasing probability, for flaperon and non-flaperon debris, of far south crash latitudes. This figure specifically illustrates the first point mentioned previously that the predicted arrival times are late, and especially so in Africa. In fact, the probability of timely arrival drops by a factor of about two at 37 °S and beyond for non-flaperon debris. This figure also displays the generally high probability of predicted debris arrival in Western Australia, with far south crash latitude, which did not occur.
To quote from CSIRO’s 2016 report: “Latitudes south of 39°S are quite strongly contra-indicated by the arrival times of the flaperon and other debris reaching Africa, and the fact that those items were many while findings anywhere on the Australian coastline were nil.” Crash latitudes between 37-39 °S are also contra-indicated, although not as strongly as south of 39 °S. Therefore, between 37 °S and 39 °S the drift probability declines from a very high value to a very low value. The exact shape of this decline is not known at the moment, but two conclusions are unchanged – at circa 36 °S the drift probability is very high, and at 39 °S the drift probability is very low.”
The following link (added for convenience) is the same as the link above:
https://www.dropbox.com/s/lszarw2w8qb2a3p/The%20Final%20Resting%20Place%20of%20MH370%20-%207th%20March%202020.pdf?dl=0
@Sid Bennett: We were discussing the behavior of the autopilot in LNAV mode after reaching a route discontinuity. You claimed (incorrectly) that track is held constant. We know that heading is held constant, and we believe that the reference is true or magnetic based on the position of the HDG REF switch.
You said that it does not matter if magnetic variation tables are outdated as long as everybody uses the same outdated tables. First, there is no guarantee that everybody uses the same outdated tables. But also, it is not uncommon for heading indication systems to use integrated magnetometers, which do not need tables to convert from true heading to magnetic heading.
@Richard and co authors. Thank you for those additions. That sounds reasonable.
@VictorI
I should have bookmarked the documents I scanned through, but didn’t.
Surely the 777 navigation system only uses the magnetic compass as a manual instrument of last resort. Can you find it referenced in any description?
@Sid Bennett: I never said the 777 navigation system uses a magnetic compass. It surely does not. However, other (much smaller) planes use magnetometers to indicate magnetic heading.
@DrB
Thank you! Yes it would be important, if possible, to extend the drift probability curve to the south.
@VictorI
But the subject under discussion is how the M370 nav system functioned, not others…
@Sid Bennett: We know how the autopilot of a B777-200ER behaves when it reaches a route discontinuity in LNAV mode: it maintains a constant heading. That was confirmed by a Boeing reference and also in a Level D simulator. This was discussed and resolved several years ago on this blog. End of story.
@Richard
In Section D.5, you have added a clarification as follows:
”Figure D-3 shows the maximum fuel probability (of the four post-19:41 Options) calculated using the method presented in this appendix.”
Please consider also adding the following sentence:
The maximum fuel probability plotted in Figure D-3 is that in the second panel of Figure 15. The fuel probability plotted is that for the SIO route fits with route probability shown in the top panel of Figure 15.
That additional sentence helps in understanding.
DrB has said:
“This maximum fuel probability is what is plotted in Figure D-3 and the second panel in Figure 15, and it corresponds to the same SIO route fits whose route probability is shown in the top panel in Figure 15.”
@ George G
You proposed adding in section D.5 “The maximum fuel probability plotted in Figure D-3 is that in the second panel of Figure 15. The fuel probability plotted is that for the SIO route fits with route probability shown in the top panel of Figure 15.”
In Section D.4.2 immediately after the Table D-4 we have already added a clarification as follows: “If no particular post-1941 Option (A, B1, B2, or C) is identified, then generally we choose the maximum fuel probability among those four Options. This is the quantity that is plotted in Figures 5, 15, and D-3.”
Are you proposing to repeat a similar clarification 3 pages later?
@ Richard
You said:
April 16, 2020 at 2:07 am
QUOTE:
@ George G
You proposed adding in section D.5 “The maximum fuel probability plotted in Figure D-3 is that in the second panel of Figure 15. The fuel probability plotted is that for the SIO route fits with route probability shown in the top panel of Figure 15.”
In Section D.4.2 immediately after the Table D-4 we have already added a clarification as follows: “If no particular post-1941 Option (A, B1, B2, or C) is identified, then generally we choose the maximum fuel probability among those four Options. This is the quantity that is plotted in Figures 5, 15, and D-3.”
Are you proposing to repeat a similar clarification 3 pages later?
END Quote.
Richard, Sorry for the confusion.
My proposal is to document/state/record that the fuel probability plotted is that for the SIO route fits with the route probabilities shown in the top panel.
Nowhere in the report have I yet found such a statement, but of course I may be mistaken.
It may be implied by the placement of the fuel probability plot directly beneath the route probability plot, but excepting by this inference, I can find no statement of the fact in the report.
I asked recently:
“DrB: Please: Does this represent the fuel probability for the specific optimum routes whose probabilities are plotted in Figure 37 (and the top panels of 5 and 15). ?”
And he replied, in part:
“This maximum fuel probability is what is plotted in Figure D-3 and the second panel in Figure 15, and it corresponds to the same SIO route fits whose route probability is shown in the top panel in Figure 15.”
The statement linking the fuel probability plotted to the specific optimum routes whose probabilities are plotted, is what I was requesting.
(by such as my suggested additional ” sentence”).
Reason:
To increase understanding that some non-optimum routes (routes with poor Route Fit and thus not plotted) may actually have a fuel requirement closely matching fuel availability even though they might otherwise be quite unrealistic.
@Victor
Your comment yesterday was quite interesting about magnetic heading possibly being generated by the aircraft itself. Until now we’ve been assuming 2005 magnetic tables used by the aircraft, which if I recall comes from ATSB to IG. The exact magnetic translation makes a big difference in path projections. In flight Sim I use 3 different tables pre-2000, 2005, and 2017 and for the MH370 flight path, it varies from substantial curve to much less curvature (recent years), presumably due to Earth’s magnetic south pole moving around a lot down there.
@Sid
I don’t know if you saw my comments above April 15, 2020 at 2:16 pm. You can still have the flight path you wanted, you just have to require that the pilot switched over to True Track before or after ISBIX. That’s why unintentional/accident flight theory does not work well, because to fit the data, we have to use True Track or LNAV which imply intentional flight.
@TBill: You are misunderstanding my statement. I was referring to other (mostly smaller) aircraft, not Boeing transports.
@All
We have made one more clarification in the paper in the download link in the article above.
Thank you @George G for pointing out the need for clarity.
In Section D.5, immediately below Figure D-3:
“The maximum fuel probability is what is plotted in Figure D-3 and in the second panel in Figure 15. It corresponds to the same SIO route fits whose route probability is shown in the top panel in Figure 15.”
The following link (added for convenience) is the same as the link in the article above:
https://www.dropbox.com/s/lszarw2w8qb2a3p/The%20Final%20Resting%20Place%20of%20MH370%20-%207th%20March%202020.pdf?dl=0
@TBill
Thank you for reminding me of your post. I agree that the pilot could have selected True Track at any point, or actually entered a DIRECT TO in the flight plan.
I haven’t thought about unintentional/accidental causes in years. The question for me is whether the pilot was in command at 00:11.
But the pilot could have done either of the actions mentioned above at any time after 18:22 when the power was apparently restored and the plane configured for automatic flight.
@All
The aerial search for MH370 in the Southern Indian Ocean began on 18th March 2014. AMSA published a chart of the planned search area, depicting two possible flight routes given to them by the NTSB, who in turn got the analysis from Boeing. The estimated MH370 end points were at 48.3°S 82.0°E and 46.2°S 86.5°E. These were both straight line paths at MMo based on fuel exhaustion at 00:19:37 UTC but without consideration for the required or available fuel.
Two days later, these estimates were revised to 46.0°S 82.0°E and 44.5°S 82.0°E. These were now LNAV paths on an initial bearing of 191.7°T and 188.3°T respectively. Both flight paths were at FL400 and used the constant mach speed mode. A week later a minor revision was made to one of the estimates.
On 28th March 2014, these two estimates were abandoned and three new estimates replaced them. This time the average TAS was specified as 475 knots, 469 knots and 400 knots respectively. The first two estimates were still at flight level FL400, but the third estimate was at FL350. Various speed modes were considered including MRC, CI=52 and LRC INOP.
The MH370 end points were given as 31.5°S 88.8°E, 34.0°S 88.8°E and 31.1°S 96.7°E based on initial bearings of 189.3°T, 188.6°T and 181.5°T. For the first time, the new estimate at 31.1°S 96.7°E showed an MH370 end point close to the 7th Arc at only 28.9 km east of the 7th Arc. All previous end points were between 247 km and 618 km east or west of the 7th Arc. The next day, only the new LRC INOP estimate was shown in the search plan and for the following 4 search days, only the area around this new estimate was searched.
0n 4th April 2014, ULB detections were made by Haixun 01 and Ocean Shield. The same day Curtin University announced that they had picked up an acoustic anomaly using the IMOS hydrophones HA01 at Cape Leeuwin. The aerial search moved from around 31.1°S 96.7 °E to around 20.0°S 104.5°E, a distance of ca. 1,460 km further north.
The details are in the attached presentation. It is interesting to note that the three routes, shown for the first time in the search plan on 28th March 2014, are included again in the Boeing analysis in the Malaysian SIR Appendix 1.6E. It is also interesting to note that Boeing were very close to the MH370 end point of 34.3°S defined in our current paper, based on a LNAV180 LRC flight path at FL390. Boeing were 6 years ahead of us, despite making a few mistakes in the urgent situation to define the aerial search area.
https://www.dropbox.com/s/ji539we0q3y943p/AMSA%20ATSB%20NTSB%20Boeing%20Flight%20Routes.pdf?dl=0
@Richard
Important background, thank you. I did not realize there were so many Boeing/NTSB paths. I had seen prior reference to 400 knot NTSB path.
Was it the acoustic anomaly or something else that inspired them to move so far north to search for the ULB detections?
Richard wrote “ the IMOS hydrophones HA01 at Cape Leeuwin“
I’m sure you meant to write [CTBTO] IMS HA01 hydrophone array. IMOS is the Australian Integrated Marine Observing System.
Dr Alec Duncan at Curtin did attempt to supplement the CTBTO data with the IMOS recorded data. As I recall, the IMOS hydrophones are only single source devices thus not providing any directional information. The IMOS hydrophones operate over a much wider bandwidth but only recorded on a 50% duty cycle. Being submerged and autonomous, the IMOS hydrophone recorder time of day clocks lacked UTC synchronisation & exhibited drift.
@Richard. That is a very interesting trip down memory lane. I’d be interested to know a bit more about the provenance of these various estimates. Way back I spoke to someone at NTSB (I can’t even remember who it was not) about these early, deep-south path estimates. I was told that they were well aware that these went well beyond the 7th arc. Since pings were hourly, the early interpretation was that it had gone down somewhere between Ping 7 and an anticipated Ping 8 that hadn’t happened, so maximum travel distance beyond Ping 7 was an hour. The person I spoke with didn’t sound as if they had first hand knowledge and may have been speculating rather than explaining actual rationale.
I also understand that these paths were an early arc-derived path. I’d have thought that Inmarsat might be the main analytical brains behind that, rather than Boeing.
I do recall having some difficulty scaling an accurate GE overlay to estimate the actual lat/long. In the end, I got a better overview of those paths and where they came (over the NW corner of Sumatra – consistent with Arc 1) from from some video footage around that time where the charts were on a big screen in the background.
If memory serves, the main prompt for the abrupt shift to much more northerly search area (28th) was the confirmation of high speeds in the flight over the peninsular and therefore more limited fuel range. None of the paths from 28 onwards were attributed to “NTSB”.
Could you comment on how/why you believe that Boeing was behind those “NTSB possible paths”? Boeing surely knew enough to tell that the plane could not have got that far.
@Don Thompson
Many thanks for spotting my mistake!
I had just re-read the Curtin report on the IMOS Scot Reef and IMOS Perth Canyon and obviously had too much IMOS on the brain. I meant to write, that I concluded that it was the CTBTO HA01 at Cape Leeuwin, that first reported a detection on 4th April 2014 and help caused the change of location by AMSA to 20°S near the 7th Arc. I think AMSA was more excited by the ULB detections from Haixun 01 and Ocean Shield, though all 3 detections coming at the same time, was not to be ignored.
I have updated the attached presentation:
https://www.dropbox.com/s/ji539we0q3y943p/AMSA%20ATSB%20NTSB%20Boeing%20Flight%20Routes.pdf?dl=0
@Richard and Authors
There appears to be a grammatical error in the sentence beginning with, “In Figure H-2 we plotted…”
I’d like to raise a point about the treatment of northern routes. I realize that they are not compatible at all with a straight path, but I would hope that the drift predictions in your report fully take them into account.
I’ve mentioned recently that I don’t think early arrival of debris should be a problem, because most of the later finds were when someone took the initiative to go looking. (Recall that Roy was first discarded because it was smelly).
You have added that David Griffin provided drift data from 7.5S (to 36.5S), but the first drift Figure H-1 cuts off at 20S, where probability appears to be increasing going north.
(The aerial search probability figures likewise cut off at around 20S but we know there were no 7th Arc searches beyond that).
Far northern drift probabilities may be artifically low due to a penalty applied if the debris arrived earlier than the modeled time minus 10% ,with 47 days (?) allowed for discovery. For the flaperon, that would be a penalty if there was more than 98 days between prediction and discovery, which presumably applies to my site near Java.
(I recall a report that the flaperon had been found previously and considered as a table for cutting fish, but can’t seem to find the article.)
Does this minimum time penalty affect only northern crash sites where drift is directly west?
A +30% maximum time penalty also may not reflect late debris discovery. Johnny Begue found a concave piece of debris in 2016, a year after he found the flaperon, that might correspond to grey and blue paint above the wing.
https://twitter.com/RideSoulSurf/status/706094798558490624
Even if it does not change your detailed report, I am very curious to see what Figure H-1 would look like without the time penalties, and extended to 8S. I’d truly appreciate the visual if it’s not too much effort.
@Richard
Interesting slides you shared; thanks!
The estimate 8 route (MRC) ending 34S with initial bearing 188.6 degrees, what navigation mode would that be?
@ paul smithson
You ask “Could you comment on how/why you believe that Boeing was behind those “NTSB possible paths”?”
You state “Boeing surely knew enough to tell that the plane could not have got that far.“.
Response to your question.
Boeing state in their Event Report in the Malaysian SIR Appendix 1.6E:
“This event is being investigated by the Malaysian Ministry of Transportation (MOT) with the assistance of accredited representatives from the United States National Transportation Safety Board (NTSB), the Australian Transportation Safety Board (ATSB), and the United Kingdom Air Accidents Investigation Branch (AAIB). Boeing is providing technical support to the US NTSB“.
The ATSB state in their Final Report:
“The work of many organisations and individuals from Australia and around the world was coordinated by the ATSB. Of particular note was the contribution of members of the search strategy working group (SSWG) including; Inmarsat, Thales, Boeing, the Air Accidents Investigation Branch (AAIB) of the United Kingdom, the National Transportation Safety Board (NTSB) of the United States, the Defence Science and Technology Group (DST Group) and the Department of Civil Aviation Malaysia. Other significant contributors were the Commonwealth Scientific and Industrial Research Organisation (CSIRO) and Geoscience Australia“.
Also ATSB state formally:
on page 159, that they sent a draft copy of their report to Boeing.
on page 160, that they received a submission from Boeing.
In Appendix B:
(1) “that no current investigations or assessments are currently being undertaken by Boeing into the identification of the most probable final location of flight MH370, but the appendix provides a copy of the analysis as provided post a Joint Investigation Team (JIT) briefing to AMSA on 2 April 2014“.
(2) The report includes the results of calculations made by Boeing: “The altitude was recorded as 35,000 feet and from the other recorded parameters Boeing calculated a ground speed of 473 kts“;
(3) “Boeing undertook a number of performance calculations varying the speed and altitude to determine the range of the aircraft“;
(4) “The first proposed search areas were established by using Boeing’s performance predictions and the criteria that for a track to be valid it must reach the 6th arc“;
(5) “Boeing’s analysis of the aircraft’s movement from the last ACARS reporting position and the end of the primary radar coverage showed that the aircraft had accelerated from 473 kts to 500 kts as it transited across the Malaysia Peninsular and along the Straits of Malacca. This was confirmed by the last two Royal Malaysian Air Force air defence radar returns“;
(6) “In this refinement Boeing used the performance based flight tracks, previously identified, and compared the Doppler that these tracks generated with the Doppler information obtained from the OBF“;
(7) “The final refinement to the underwater search area was obtained by overlaying the results of the refined Inmarsat Doppler analysis, Boeing refined Doppler and range analysis, and air route M641;
(8) “Boeing analysis using a combination of aircraft performance and Doppler data, obtained from the satellite, to generate a range of probable best fit tracks. This work was supported by a Root Mean Square analysis that took account of a number of variables;
(9) “Flight planning carried out by MAS independently showed that there was sufficient fuel onboard the aircraft to reach the positions determine by the Inmarsat and Boeing analysis“;
(10) “The length of the arc that defined the most probable area was obtained from the overlay of the results of the Inmarsat and Boeing approaches“.
Response to your statement.
MAS did the fuel analysis independently of the Boeing and Inmarsat approaches. I assume Boeing also did a fuel analysis, but their first estimates were clearly without regard for the required or available fuel. The MAS fuel analysis may have been at a later point in time. Even by the time the DSTG produced their analysis, there was no agreed fuel model, resulting in the DSTG assuming “infinite fuel“. I believe that our paper is the first flight route analysis based on a validated fuel model.
@Richard. The questions below intended in spirit of factual enquiry. I’d like to understand how much of the info that you have kindly shared in this doc is “as provided by third parties” and how much of it is your assumption/estimate/derivation.
1. Are you quite sure that the terminus of “NTSB possible paths” version 18th and 20th are different? Are the lat/long of your slide headers estimated by you or provided to you? The AMSA slides are not mercator and there is a shift in projection angle. By my eye, judging from alignment with seafloor features, they end at the same latitude as far as one can tell.
2. You have also attributed the yellow (eastern) path on slide 28th March and 29th March to “NTSB (Boeing)”. What is the basis for this attribution? I can see that the grey/orange paths on the slide from 28th correspond with the earlier NTSB possible routes but the yellow done doesn’t.
3. Your slide on p6/10 is headed “AMSA estimated MH370 end point – assumptions”. Whose assumptions are those – yours, AMSA’s, NTSB’s, Boeings? What is the basis for the estimated start time and location of the NTSB paths?
4. Your slide on p7/10 provides details for Estimates 1 through 10. Of the parameters that you have tablulated for these first six (the ones that went to 40+S), can you explain which of the parameters shown you have assumed/derived yourself (FL, TAS, Mach, Speed mode, duration, range, initial bearing, endurance, average groundspeed, etc) and which were provided by AMSA/NTSB/Boeing or other third parties?
Thanks in advance.
My second post crossed with your first response above.
I am familiar with the Appendix 1.6E and that work is clearly attributable to Boeing. However, I’m not aware of any reason to suppose that Boeing were involved with derivation of those “NTSB possible paths”.
@Richard
Thank you.
@paul smithson
You state “I’m not aware of any reason to suppose that Boeing were involved with derivation of those “NTSB possible paths”.
I already gave you most of the following 7 reasons. I don’t think I could be much clearer, but I will give it one more try:
(1) Boeing was providing technical support to the NTSB from the outset.
(2) Boeing were a member of the ATSB search strategy working group (SSWG) together with the NTSB.
(3) The ATSB Final Report Appendix B provides a copy of the analysis as provided post a Joint Investigation Team (JIT) briefing to AMSA on 2 April 2014 of which both Boeing and NTSB where active participants.
(4) Appendix B is the formal protocol of the “Identification of the most probable final location of flight MH370 (Issue 2)”. It specifically states “This document records the development of a process, up to 2 April 14, to determine the most probable final location of Flight MH 370“.
(5) The protocol states “Boeing undertook a number of performance calculations varying the speed and altitude to determine the range of the aircraft“.
(6) The protocol states “The first proposed search areas were established by using Boeing’s performance predictions“.
(7) Nowhere in the protocol does it mention a NTSB contribution, only Boeing is mentioned and then in 10 places in the protocol as the organisation providing position, speed, altitude, range and performance predictions.
I don’t dispute that a whole bunch of organisations were working together. Who exactly contributed what is another matter. AMSA slides clearly attribute those early “possible routes” to NTSB. I was interested to learn if you had an specific insights into their provenence and the assumptions underlying them. It is of no tremendous consequence so if you don’t have anything further to add then let me not labour the issue.
Could you offer clarification on the question about which columns in your tables are “data” and which are your estimates/derivations?
I dont understand, why all of you are not discussing Ed Andersons story which is supported with some evidence, and yet you have only statistics
Why is Ed Anderson so ignored here?
@Sultan. Ignored? Not too sure he has been. Even so, if his theory has not been given the attention it warrants, part of the reason I think is concentration on the current review of the BRVA paper proposing a new search. That proposal has been offered to OI for consideration. As such it is a clear and present candidate, warranting close and early examination.
Its data support is excellent and that has withstood an array of questions to date. I would have thought that amounted to “evidence”.
@Dr B et al. Putting all that to one side I take the opportunity here to continue with that review theme. To be balanced, apart from prompting questions and praise the review should identify weaknesses in the proposal also.
One is how the characteristics of the final transmissions resulted without an active pilot.
Banking of the aircraft by a relight would be unlikely, as per your paper.
The remaining possibility raised there, of a pilot being slumped over the controls, might explain it though that would suppose his body had not interfered earlier with autopilot operation.
There needs to be a reasonable likelihood too that the characteristics of the final transmissions would result, particularly their timing. Two minutes after MEFE suggests a slow induced downwards acceleration or bank. Yet some descent examples I have posted that illustrate pitch down as the descent’s cause suggest that would be initiated briefly before the transmissions, not two minutes, whatever prompted it.
About bank, with dihedral tending to stabilise the aircraft the initial bank rate would need to be enough to overcome that and yet take 2 mins for the bank to become steep. That might be hard to model.
Another reservation I have is that it quite possible that the APU auto-start explanation for the powering of those transmissions, if at high altitude, might be precluded by vapour lock in its fuel supply.
A solution that included an active pilot would not be bound in some of the above ways: not that that proves there was one!
Added to the above there is also of course the earlier unsuccessful search of much of the area close to the LEP. If added into the probabilities of the paper, that would reduce them.
Incidentally a passing observation. While packs off for the SIO leg would have led to an inactive pilot, I speculate that the converse might not be the case. Because there might have been depressurisation may not mean necessarily the packs were off, particularly after IGARI. Since the outflow valves normally are little open at altitude given the high differential pressure and lowered mass bleed rate, conceivably opening them wide manually would realise depressurisation, though slowed, the packs operative still. The aircraft would be warmer.
@Niels
You ask “The estimate 8 route (MRC) ending 34S with initial bearing 188.6 degrees, what navigation mode would that be?“.
An excellent question.
The ATSB Final Report Appendix B states on page 10 of the appendix “It was concluded that in order to be assured of flying a required track, the aircraft lateral navigation would probably have been selected to the ‘track’ mode. This would maintain the desired track with the increasing magnetic variation being compensated for“.
I calculated the Boeing assumed start point on Flight Route N571 at 18:28:27 UTC as 6.942°N 95.597°E. The MH370 end point, described as the investigation team’s 469 knots path (estimate 8 in my list), ends on my estimation from the AMSA chart dated 28th March 2014 at 34.0°S 88.8°E. A geodesic with an initial bearing of 188.578°T would be required to fit the calculated start point and estimated end point.
Since the magnetic declination at 34.0°S 88.8°E on 7th March 2014 was 23.16° West, the CMT navigation mode was not used by Boeing otherwise the depicted track would have a greater curvature.
The CTT navigation mode could have been used, but that would require an active pilot to switch the heading reference from NORMAL to TRUE. Boeing may have considered CTT as a possibility.
The LNAV navigation mode could have been used and an ultimate waypoint of 45S 86E fits the initial bearing exactly. Boeing may have considered LNAV as a possibility.
The LNAV navigation mode could have been used and an ultimate waypoint of 45S 86E fits the initial bearing exactly. Boeing may have considered LNAV as a possibility.
Interesting.
The 00:00 utc surface terminator for 08Mar14 at Lat 45.00°S was Lon 086.49°E.
(45S 86E was 00:02 utc)
Just saying.
@TBill
You asked “Was it the acoustic anomaly or something else that inspired them to move so far north to search for the ULB detections?“.
Excellent question.
In the ATSB Final Report Appendix B we are told that it was a combination of factors: “The final refinement to the underwater search area was obtained by overlaying the results of the refined Inmarsat Doppler analysis, Boeing refined Doppler and range analysis, and air route M641“.
Initial Inmarsat Doppler Analysis.
“Inmarsat analysis showed that the best fit for the Doppler frequency was at a ground speed of 400 kts, with slightly ‘less’ best fits at 375 and 425 kts. A Monte Carlo style analysis, using a number of different starting positions on the 2nd arc also gave a best fit at 400 kts. From this approach a most probable speed range of 375 to 425 kts was selected“. (note: This was before the eclipse effect on the BFOs was taken into account)
Initial Boeing Performance and Doppler Analysis.
In carrying out the Doppler and performance analysis, two scenarios, 1A and 1B, were developed. Scenario 1A required the aircraft to fly in a southern direction after it crossed the 1st arc. Scenario 1B required the aircraft to fly a northern route through waypoint IGREX and waypoint LAGOG, before flying south. The LAGOG waypoint was included as it was close to a supplied, high confidence position labelled ’19:12Z’.
The “NW Point” or “19:12Z” point was marked with a Yellow Pin in a folder entitled Report Maps in Annexe I of the Malaysian Preliminary Report dated 9th April 2014:
https://www.dropbox.com/s/gwafdzsi3o6o2y5/Yellow%20Pin.pdf?dl=0
Refined Inmarsat Doppler Analysis – End Point 23.4°S.
“Inmarsat reran their analysis using the 19:12Z position as a starting point”.
“Starting from position 19:12Z, the best fit is shown in Figure 9. It is within 1 Hz of the prediction for the final three data points, and results in a crossing of the 7th arc at Latitude 23.4°S, Longitude 102.8°E”.
Refined Boeing Performance and Doppler Analysis – End Point 20.3°S to 22.2°S.
“In this refinement Boeing used the performance based flight tracks, previously identified, and compared the Doppler that these tracks generated with the Doppler information obtained from the OBF. The difference between the Doppler values was then classified as red, yellow, green or blue, with red being the ‘best fit’°. (note: OBF is now called BFO)
The best fit red area defined by Boeing was between 20.3°S 104.3°E and 22.2°S 104.1°E.
Air Route M641 – End Point 20.7°S.
“The track following the initial left turn off the planned route was towards Penang, from there the aircraft appeared to follow air routes to the 19:12Z position. The use of stored waypoints in the aircraft Flight Management System (FMS) suggests that the navigation was carried out using the Automatic Flight Control System (AFCS) in the lateral navigation mode. When the aircraft departed LAGOG the next major waypoint to the south was COCOS, which could be linked to the M641 air route”.
The intersection of M641 and the 7th Arc at 20.7°S 104.2°E became the AMSA priority search area.
Underwater Locator Beacons (ULBs).
Both the FDR and the CVR have Dukane Underwater Locator Beacons. AMSA were concerned that the battery life would not last much longer. The minimum battery life is 30 days from impact with water and the 2nd April 2020 was already 25 days after the impact.
“Consideration was also taken regarding the area that the towed underwater detector could cover before the predicted life of the batteries in the Dukane beacon expired”.
AMSA decided to follow Inmarsat’s 23.4°S, Boeing’s 20.3°S to 22.2°S, the ATSB/AMSA’s own view of 20.7°S based on the M641/7th Arc intersection and on 4th April 2014 the search moved north. A possible ULB was detected by Haixun 01 on 4th April 2014 and by Ocean Shield on 5th April 2014. Curtin University also reported an underwater acoustic detection on 4th April 2014, that came from the direction of the search area.
Summary.
AMSA decided to move the search north to around 20°S, based on the presentations from Inmarsat and Boeing, their own scenario involving the flight route M641 and in consideration that the battery life of the ULBs would soon expire.
@paul smithson
You asked “Could you offer clarification on the question about which columns in your tables are “data” and which are your estimates/derivations?”
(1) The end point positions are taken from the AMSA charts as shown in the linked presentation.
(2) The average speed is taken from the AMSA chart dated 28th Arch in the linked presentation.
(3) The BTOR errors are calculated using my MH370 satellite model.
(4) The Boeing Assumed Start Time, Start Position, Start Fuel, Flight Level, Assumed TAS, Assumed Mach, Assumed Speed Mode, Assumed Time (Duration) and Assumed Range are taken from Boeing data in the ATSB Final Report Appendix B, the Malaysian SIR Appendix 1.6E and published Boeing data.
There is one exception: in Appendix B it stated “The length of these arcs was constrained by the maximum speed of the aircraft, which was initially set at a ground speed of 652 kt“. I considered 652 knots as a typo and was probably meant to read 562 knots.
(5) The Aircraft Start Weight is calculated from the Start Fuel and the ZFW of 173,469 kg.
(6) Initial Bearing, Range, Endurance, Average GS, Fuel Rate, Specific Air Range and Mileage are calculated using my flight model.
(7) The last column MRC mileage is taken from Boeing documentation.
@Richard. Thanks.
@Richard: The LAGOG waypoint was included as it was close to a supplied, high confidence position labelled ’19:12Z’.
It’s never been explained why the position at 19:12Z was initially considered to be “high confidence” and later completed ignored. That position was based on a mobile radar source belonging to Singapore. Details surrounding this source have never been disclosed. That’s unfortunate because whether or not MH370 targets were received, the radar data could be used to allow or dismiss certain paths.
@paul smithson
You asked “AMSA slides clearly attribute those early “possible routes” to NTSB. I was interested to learn if you had an specific insights into their provenence [sic]”
The ATSB Final Report Appendix B, Section “Initial Predictions of the Aircraft Flight Path”, Sub-Section “Development of Northern and Southern routes” states “Boeing undertook a number of performance calculations varying the speed and altitude to determine the range of the aircraft. The speed chosen affected where the aircraft crossed each of the arcs. This resulted in a family of solutions along the arc generated by the satellite data from the 6th handshake. These northern and southern solutions are shown in Figure 3 and are bounded by the low and high speed flight paths which terminate on the final position arcs (6th arc)“.
The southern high speed flight paths shown in Figure 3 appear rather similar to the two possible routes shown in the AMSA chart dated 18th March 2014 and attributed to the NTSB. NTSB were the accredited representative in terms of ICAO Annexe 13 and Boeing were asked by the NTSB for technical support, as they were the aircraft manufacturer.
@Victor
I agree! The lack of transparency is indeed unfortunate. The Malaysian military radar data has been given to the ATSB, DSTG and Boeing, but never published. The only statement about the NW Point at 19:12 UTC was in the ATSB Final Report page 44 and Table 19, where the ATSB state “1912 NW point (80 35.719’N, 92035.145’E) reassessed as invalid and no longer used by flight path reconstruction groups.
In my view, it is not credible to base a search costing A$198M on a “yellow pin” defined as a “supplied high confidence position” on 2nd April 2014, which is a short time later deemed as “invalid” on 14th June 2014.
@Sultan
“Why is Ed Anderson so ignored here?”
It is not ignored. Several months ago Victor introduced Ed’s work as serious scientific effort that is perhaps being under-valued. That was an important endorsement. Victor has also summed up the technical questions, and IG members suggested experiments that could help rule-in or rule-out the close-to-Java acoustic observations. Some of these discussions with Ed have been on Twitter.
There are many theories on MH370 end point. Various groups are making proposals to OI where to search (IG et al/Captio/etc).
@Richard. “The southern high speed flight paths shown in Figure 3 appear rather similar to the two possible routes shown in the AMSA chart dated 18th March 2014 and attributed to the NTSB.” I agree that they bear a passing resemblance. However, the text says and the figure shows that these end at the 6th arc; whereas the “NTSB possible routes” end a good deal further south (as you you have demonstrated). As I said, it’s only a matter of historic curiousity so please don’t devote any further time to it on my account.
@Richard
That was great explanation above! thank you. To summarize, there was early period when 20-22 South became temporarily favored, coinciding with the remaining battery life of the ULB’s.
I remain very interested in the 400 knot options, so I can perhaps understand why that looked promising. The early days of the search make much more sense with your explanation above.
@Victor
Nice add re: 1912
@TBill
Many thanks for the kind words!
@Richard
Regarding possible navigation mode assumed by Boeing/NTSB: First of all, I’m not really sure slides 4 and 9 match very well.
In slide 9 it looks like bearing is changing at arc crossings, perhaps as to make given GS / distance covered match to subsequent arc location?
Is there any indication how they incorporated effects of wind?
One of the issues that was raised regarding my recent proposal for a route combining a waypoint route including IGOGU and ISBIX and continuing on CTT at the discontinuity was that the selector switch had to be set to TT instead of Heading.
Well, take a look at this thread:
https://www.pprune.org/tech-log/355864-mnps-nats-crossing-techniques-fmc.html#
You will note that the date is well before the M370 incident and can therefore be considered an unbiased input.
So, what was the MY SOP and what was the practice of experienced pilots?
The resultant path intersects the 7th arc at-37.426 with LRC at 41000ft and consumes 160kg less fuel than the 186GCP.
The path was computed from 18:22 with the offset cancelled as part of the turn South to ISBIX.
I have no doubt that further refinement could be made, but since this is good enough, I prefer not to fine tune it.
@Sid Bennett: You are conflating sooo many topics…
Whether track or heading is displayed as “up” depends on the configuration preferred by the airline, and is independent of what is flown after a discontinuity.
Regardless of the display configuration, and independent of the position of the HDG/TRK switch, when in LNAV mode, at a route discontinuity, without further input, a B777 continues by maintaining a constant heading, either magnetic or true, depending on the position of the HDG REF switch.
That said, after a route discontinuity, a pilot can choose to fly a true track by leaving LNAV mode and selecting either HDG/TRK HOLD or HDG/TRK SEL (depending on whether a change in track is desired) and ensuring the HDG/TRK switch is in the TRK position and the HDG REF switch is in the TRU position.
@Niels
I agree that there is a poor match between slides 4 and 9.
As you point out, slide 9 from Boeing is simply made up of straight lines between the arcs.
In the ATSB Final Report Appendix B, there is no mention of winds or air temperature at altitude.
I find this strange, when Boeing make it very clear in the Malaysian SIR Appendix 1.6E, that winds and air temperatures were incorporated.
“Wind data during the time period and covering the region of the flight were obtained for two time periods during the flight (18:00 UTC and 00:00 UTC) and at 8 altitudes (400 feet, 2500 feet, 4800 feet, 9900 feet, 13,800 feet, 18,300 feet, 23,500 feet, and 30,000 feet). The data contained time, latitude, longitude, wind speed, wind direction, and altitude. These data were applied to the available radar data to calculate the true airspeed of the airplane that would be used in the fuel burn analysis. The wind data were also incorporated into the analysis to determine the possible paths of the airplane using the constraints of the satellite data. Linear interpolation of the wind data occurred at the location and time of the assumed flight path in cases where known wind data was not available“.
@VictorI
The blog addressed both issues. Did you read it? Sometimes I find manuals too cryptic.
The IGOGU+ISBIX+CTT path would appear to be executable, with one remaining question.
The path could have been entered in the FMC with the ISBIX discontinuity.
After the offset is selected, the pilot can climb to 41kft to avoid crossing traffic and then let the pane fly itself.
But, the offset is not automatically cancelled at IGOGU since the turn is not 135deg or greater. But I have assumed it is. Is the offset cancelled prior to ISBIX? All of these “minor” details would be important to understand if the hypothesis tended to support an un-piloted flight after about 18:30.
Sid Bennett,
Several years ago I also went down a hole trying to make an IGOGU-ISBIX-constant track route work, with the last stage being due to a route discontinuity such that it all could have been set up at 18:30. It doesn’t work. The reason has been beaten into you ad infinitum – the plane will follow a constant heading, not track, at a route discontinuity. The pprune link you posted above (which I also read several years ago) does not address the issue. Boeing aircraft (and I have checked the 737, 747, 757, 767, 777, and 787) all have the same behavior. There is a lot of misinformation posted on the pilot forums, and even in vendor and training documentation – be careful of what you read.
(I am actually unclear how a 737 behaves – LNAV is disconnected at a discontinuity.)
@sk999
I have a very thick skull.
I also have found that the criteria for cancellation is given as 90deg turn, but the Boeing documentation (somewhere) gives 135 degrees. Nothing is certain or simple.
Perhaps you could read that thread again and explain what happens when the pilot flies tru rather than mag? It appears that that is what the discussion was about.
@sk999
Since I retired from industry 20 years ago I have practiced patent law. I am quite comfortable asking inventors dumb questions 🙂
Hard habit to break now.
@Sid Bennett said: The blog addressed both issues. Did you read it?
The blog comments you cite are concerned with configurations and settings that affect the navigation display (ND), i.e., heading up versus track up, normal (magnetic) reference versus true reference, and track versus heading. In LNAV mode, these settings and selections have ZERO effect on the great circle path that is navigated, and have ZERO effect on whether a track or heading is flown after reaching a route discontinuity (other than we believe the HDG REF switch determines whether the constant heading is magnetic or true). The settings DO affect how a pilot might compare while in-flight the direction of the plane with the direction included in the log generated before the flight.
You are asking questions that were studied and addressed here three years ago. At this point, we have little question about how a B777 behaves in LNAV mode at a route discontinuity. Please move on.
@Victor/Richard/DrB/Andrew
Do you believe the diversion of MH370 was motivated by suicide. “Don’t know” is not an acceptable answer. No one knows. “Don’t care”, is equally not acceptable since it has such a large impact on the route selection.
Just tell us what you believe.
@DennisW: If you are asking whether I think there was a negotiation that occurred before the murder-suicide, I would say probably not, for a number of reasons, including:
1. Other than the story that @TimR has relayed, we have no evidence that a negotiation occurred. I think @TimR is an honest broker. However, I have less confidence in his source, or his source’s sources, nor do I think a negotiation could easily be kept secret.
2. I don’t think it’s possible that the captain could control the passengers and crew without incapacitating them by depressurization.
3. The civilian radar data suggests a climb after the turnback from IGARI. That is consistent with a depressurization.
@DennisW
You asked “Do you believe the diversion of MH370 was motivated by suicide. “Don’t know” is not an acceptable answer. No one knows. “Don’t care”, is equally not acceptable since it has such a large impact on the route selection.
Just tell us what you believe“.
In two comments above, I made my views about the psychological state of ZS very clear, having listened to a trained psychologist Sabine Lechtenfeld on the subject.
https://mh370.radiantphysics.com/2020/03/09/new-report-released-for-mh370-search/#comment-27621
https://mh370.radiantphysics.com/2020/03/09/new-report-released-for-mh370-search/#comment-27646
@Sid Bennett
RE: “Perhaps you could read that thread again and explain what happens when the pilot flies tru rather than mag? It appears that that is what the discussion was about.”
The PPRuNe discussion was about the use of a true north heading reference* and TRK SEL when operating in Minimum Navigation Performance Specification (MNPS) areas such as the North Atlantic and northern Canada. The discussion was not about the aircraft’s behaviour on reaching a discontinuity with LNAV engaged, and it is not relevant to MH370.
To give you some background, before entering MNPS airspace pilots are required to independently check the full lat/long coordinates of non-database waypoints entered in the FMC against the clearance provided by ATC. Some airlines also require that pilots check the initial true track and distance between those waypoints by comparing the OFP with the FMC data. The latter procedure requires pilots to temporarily select the heading reference to TRU so that the FMC displays the initial true track between waypoints. The heading reference would ordinarily be restored to NORM after completing the check, in accordance with Boeing’s procedures.
Regarding discontinuities, the manuals caused some confusion because the Honeywell B777 FMC manual states the aircraft maintains the current track on reaching a discontinuity, while Boeing’s 777 FCOM states the aircraft maintains the current heading. It was confirmed several years ago that Boeing is correct; with LNAV engaged and no other inputs, the aircraft maintains the current heading. If the HDG REF switch is selected to NORM, the heading will be magnetic unless the aircraft is within a polar region, in which case the heading will be true. If TRU is selected, the heading will be true regardless of the aircraft’s position.
It IS possible to program the FMC to fly a specified track after reaching the next waypoint, using the ‘intercept course from’ function. In your scenario, that could only be done if ISBIX were the active waypoint; the aircraft would need to have already passed IGOGU, or the pilot would need to have executed a ‘direct to’ ISBIX before he inserted the ‘intercept course from’. The aircraft would then reach ISBIX and turn to fly the specified track. Again, the heading reference for that track (ie magnetic or true) would depend on the position of the HDG REF switch, which would ordinarily be selected to NORM.
[*For interest, at ICAO’s 13th Air Navigation Conference held in 2018, Canada proposed moving from magnetic to a True North reference system. That proposal is currently the subject of a feasibility study.]
@DennisW
I suspect the diversion was motivated by ZS’s profound disillusionment with the political situation in Malaysia. It was intended to send a message, which necessitated his own suicide and the murder of 238 others.
@Ventus45
I recently commented to @Niels on the Boeing analysis”The LNAV navigation mode could have been used and an ultimate waypoint of 45S 86E fits the initial bearing exactly. Boeing may have considered LNAV as a possibility.”
You responded “Interesting. The 00:00 utc surface terminator for 08Mar14 at Lat 45.00°S was Lon 086.49°E. (45S 86E was 00:02 utc) Just saying.”
As you know, in our recent paper, we state the MH370 end point at 00:19:37 UTC as 34.2342°S 93.7875°E.
The NOAA Solar Calculator shows an apparent sunrise at this position on 8th March 2014 at 05:38 Local Time (7th March 23:38 UTC).
The muslim custom for dawn prayers is to face Mecca. I did consider whether at dawn MH370 was turned toward Mecca.
At 23:38 UTC, MH370 would be running low on fuel. I calculate the position of MH370 at 28.9514°S 93.7875°E. Mecca would be on a great circle path with an initial bearing of 307.7°T. At 480 knots and a bank angle of 25°, it would take about 2 minutes to turn the aircraft from a 180°T track to a 308°T track. In order to match the BTO at 00:11:00 UTC, 00:19:29 UTC and 00:19:37 UTC, we know that MH370 could not have remained on a track of 308°T.
I then considered whether it was possible, that MH370 turned toward Mecca for a short time (say 2 minutes) and then reverted to the original track. This whole hypothesised turn process might take 6 minutes from say 23:36 UTC to 23:42 UTC from 180°T to 308°T back to 180°T. These two turns through 128° plus a 2 minute straight flight at 480 knots toward Mecca, leaves MH370 about 41.7 NM west of the original flight path. We know this did not happen, as the BTOR errors from 00:11:00 UTC onwards are in excess of 240 µs (standard deviation 29 µs) for a longitude of 92.997°E.
This leaves only the possibility of a more complex set of turns from a 180°T to a 308°T for 2 minutes, then a 180° turn to a 128°T track for 2 minutes, then finally a 52° turn back to the original 180°T track. This whole manoeuvre would take about 10 minutes and leaves MH370 about 31.8 NM further south than the start point of the manoeuvre. If MH370 had carried straight on from the start point of the manoeuvre at 480 knots, the aircraft would be 48 NM further south after 10 minutes. This more complex manoeuvre costs 16.2 NM of progress in a southerly direction.
The average GS for the final leg is 470.2 knots, so 16.2 NM represents 124 seconds of flying time. The average fuel rate for this final leg is 5,607 kg/hr for air conditioning packs on and cross feed valves closed. 124 seconds represents 193 kg of fuel. In addition there would be ca. 50 kg of fuel required for the turns.
The fuel prediction error for the whole journey from 17:06:43 UTC to 00:17:30 UTC is 427 kg and the fuel exhaustion error is 255 seconds, so 243 kg of fuel or 124 seconds of time, although significant, fits within the fuel budget prediction error limits.
In summary, a 10 minute detour for a 2 minute prayer at dawn toward Mecca is complex, unlikely, but feasible, assuming there was an active pilot. “Just saying.
(note: By the terminator, we do not mean Arnold Schwarzenegger.)
@Andrew
If the diversion was meant to send a message, I find it odd that ZS did not make it more explicit. A suicide motive for personal reasons would be confusing competitor to a “message to the government” motive.
The following will not be well-received. I realize that, and I have been reluctant to air it. Please do not take it as anything resembling criticism of tedious and high quality work that has been going on.
Relative to the latest analytics – we have all seen this movie many times before. It has never had a happy ending. To expect one now seems a bit optimistic.
There is a consistent underlier for this result history. It is Maslow’s hammer – “if your only tool is a hammer every problem looks like a nail”. So it goes with the math and physics endeavors. (I have, of course, labored in that domain extensively as well).
What is currently being under-considered, IMO, is significant peripheral information.
> A ZS WeChat moments before takeoff with an unidentified recipient (false ID SIM purchase)
> Malaysian high level interference early in the S&R (uncharacteristically noted by ICAO)
> ZS suicidal ?? He was a Malaysian patriot (Sabine’s conclusion as well)
> ZS was active in Malaysian politics, and troubled by the rampant corruption
> A lack of transparency relative to data release (radar, prior flights,…)
The diversion seems unlikely to have been a suicide at inception. It might have become one after a different intended purpose failed.
The post FMT flight paths for aircraft recovery are toward the Cocos or Xmas Island. The “logical” post FMT flight paths for suicide are more Westerly. There is little reason to believe a 34.2S 93.8E terminus makes (human) sense for either scenario. Plus that, it has been searched.
@Richard
I came across this image today.
https://www.pprune.org/rumours-news/535538-malaysian-airlines-mh370-contact-lost-368.html#&gid=1&pid=1
It illustrates those “NTSB possible routes”, the related initial aerial search area and their relationship with the ping rings. The picture illustrates what I relayed previously from my exchange with NTSB: that the first search zone and the terminus of those possible routes was predicated on the notion that the flight must have ended between Arc 6 and one hour’s travel time beyond.
@Richard
It is interesting that you raise the subject of dawn prayers again.
This subject was raised long ago by Edward Baker on his blog.
http://mh370apilotperspective.blogspot.com/2015/12/my-hunch-about-mh370s-pathand-it.html#comment-form
At the time, I posited that it was most likely that he would have turned east south east, (125 true) heading away from Mecca.
http://mh370apilotperspective.blogspot.com/2015/12/my-hunch-about-mh370s-pathand-it.html?showComment=1451187997939#c2764630644869832555
There are two reasons.
(1) 23:30 – 23:40 is my time for:-
(a) “Top of Descent” – for the ditch at dawn (and I am further south and west on 188 true than both Ed and you folk – thus the left turn to 125) and:
(b) He has to remain in the dark, and descend under the first glow of the predawn twilight, to arrive at the surface precisely as the sun rises, (the surface solar terminator) as precisely as possible.
(2) So, at TOD, he turns left to 125, and commences descent. Once he is established on descent, he has about a “twenty minute window” for final prayers, so he could pray kneeling on the cockpit floor, facing aft, directly at Mecca, in front of the cockpit door, before he has to get back into the left seat. It is my understanding that prayers are conducted in twilight, and are to be completed by dawn.
Re: SunRise/Twilight
Of course at altitude, the sun is rising earlier about 20 mins. Twilight is coming much earlier, if I recall as early as 22:50 at altitude by my prior calcs, depending on how one defines twilight. If the pilot is active, I tend to envision he is descending by at least by 23:00 if not sooner, as the skies get lighter.
@DennisW,
To answer your question about ZS’s motivation, I believe:
1. The primary motivation was to bring worldwide attention to the corruption of the Malaysian government.
2. The secondary condition was to achieve plausible deniability of his suicide, which would shame his family if it were proved.
Achieving these goals requires that no one survives the flight. It also rules out (a) flying directly into Petronas Twin Towers and (b) leaving behind a manifesto or any evidence of planning.
ZS’s very clever plan was well executed, successfully disappearing the aircraft and all souls on board, and achieving his goals. I think he would be pleased to learn the RMP’s report clears him of wrongdoing, despite the fact that the Malaysian government knew within days that he was responsible.
Thx, Bobby.
@Andrew
Thank you for your explanation. I find it odd that the two manuals disagree and one of them has not been corrected after all of these years.
Most of what you say seems unambiguous, but I am still a bit uncertain about “true track” and “initial true track” vs “heading (whether magnetic or true”. If the plane flies a track, my understanding is that the winds have been compensated by the heading and the cross-track error is zero.
I believe you are saying that the performance of the nav system after a discontinuity is a fixed procedure and that the “heading” displayed to the pilot would be determined by the Norm/Tru switch. Again, the actual path of the plane would be the same. Correct?
Do you have a URL for the ICAO Conference?
@Victor
(other than we believe the HDG REF switch determines whether the constant heading is magnetic or true)
In such an instance the plane is affected by cross-winds and is diverted from a rhumb line. Is that correct? Some years ago DrB showed such a path.
I shall limit my comments on the subject.
@Authors,
I retract any note of a grammatical error at Figure H-2. On third reading, it makes perfect sense.
(Still very curious about what Fig H-1 would look like without an arrival time penalty.)
@Sultan,
Thanks for the attempt at getting more attention on my candidate. I’d much prefer opening up constructive discussion with questions. Still, I have wondered for over a year why kooky theories get media coverage when my approach gets none. Something about the delivery, perhaps. I know why several scientists have been unresponsive. It takes them away from their current projects, and whether true or false, there’s potential for embarassment by being associated with kooky theories, and possible negative media coverage/commentary.
On this forum, I recognize that I’m a recent guest with an outside-the-box scenario while long-held approaches are being finely tuned.
@DennisW, @TimR,
I actually have been ignored by Malaysian officials. Zero response. Crickets. As conspiracy fodder, if someone there didn’t want the plane found, and knew my candidate was far fetched, they would probably just humor me 😉
@TBill
Thanks also for the reminder that Victor did invite me, encouraged discussion, and has constructively pointed out weak points in my presentation.
@Andrew, @Sid,
I offer my simplified NORM/TRUE track interpretation for a reality check.
ATC vector instructions and listed runway approach headings are assumed magnetic for most of the world, except in polar areas where local policy is to list them as relative to true north. Boeing recognizes this, and not only has a database for converting track/heading to True, but also where True should be used. In the NORM mode the correct track mode will be chosen. TRUE mode can be selected for long range flight planning.
Left in TRUE mode, a plane might diverge from assigned ATC vectors, or misalign the glide path (if somehow flown by track).
Is that even close?
Prompted by the Mecca info, I’d like to answer my own previous question about the best approach angle for ditching into high seas. I’ve since learned that pilots are trained to land parallel to the swells, and attempt to make contact along the crest, not into a trough. For my candidate, Nullschool says the fetch wind was from 95 ESE, so any piloted ditch might have been on a heading of 5 or 185 degrees.
RE: ” I believe you are saying that the performance of the nav system after a discontinuity is a fixed procedure and that the “heading” displayed to the pilot would be determined by the Norm/Tru switch. Again, the actual path of the plane would be the same. Correct?”
No. If the aircraft maintains a constant heading, its path will be affected by the following as the flight continues:
1. Changes in the magnetic variation (declination), if the heading reference switch is selected to NORM and the aircraft is outside the polar regions (ie the heading reference is magnetic).
2. Changes in the wind.
RE: ”Do you have a URL for the ICAO Conference?”
https://www.icao.int/Meetings/anconf13/Documents/WP/wp_114_en.pdf
Also: https://www.canso.org/airspace-q3-2019-true-stories
Apologies, my previous comment was for @Sid Bennett.
@paul smithson
You commented “@Richard
I came across this image today.
https://www.pprune.org/rumours-news/535538-malaysian-airlines-mh370-contact-lost-368.html#&gid=1&pid=1
It illustrates those “NTSB possible routes”, the related initial aerial search area and their relationship with the ping rings. The picture illustrates what I relayed previously from my exchange with NTSB: that the first search zone and the terminus of those possible routes was predicated on the notion that the flight must have ended between Arc 6 and one hour’s travel time beyond“.
Nice try, but the graphic is a fake!
Please see the attached link:
https://www.dropbox.com/s/ebehz7avfp3q046/Scott%20Henderson%20Manipulation.pdf?dl=0
The graphic you posted was done by Scott Henderson aka (@_antialias_), a graphics designer from Melbourne, Australia.
It variously purports to be sourced from Reuters or from the BBC and/or AMSA.
Scott produced (or more accurately manipulated) the graphic and posted it on Twitter on 20th March 2014. It has since been removed. Unfortunately for Scott, it was reposted the same day on the FlightRadar24 forum.
On 1st October 2014, Scott Henderson tweeted “Whoa! My original Apr 30 #MH370 search logic overlay of @ChristineHHChan’s map may turn out to be close to the mach“. (note: Scott could not remember he posted it on Mar 30, not Apr 30)
I also attach the original from Christine Chan, who was a Graphics Journalist, Asia for Reuters at the time and was based in Singapore. She is now the Graphics Editor, Americas and based in New York. She can be found in LinkedIn.
CORRECTION: “mach” should read “mark”.
@Sid Bennett said: In such an instance the plane is affected by cross-winds and is diverted from a rhumb line. Is that correct? Some years ago DrB showed such a path.
Yes. In true heading mode, the path is affected by cross-winds. In magnetic heading mode, the path is affected by both cross-winds magnetic variation.
As @Andrew said, more correctly, once established on a magnetic heading, it is a change in magnetic variation and a change in wind direction that causes the true track (course) to change.
@Richard Reading your recent response to @DennisW, I am reminded that I never did thank you for the extensive response at 27621. It was informative. Thank you. Of course, many people are dissatisfied with their governments, many have personal problems/issues and relationship problems. ZS must have had a serious character flaw if he reacted in this way.
I still find it difficult to accept that he would commit suicide in this manner for a personal problem or to accept that he would be naïve enough to believe that the Malaysian government would yield to a ‘hijacker’. I think there is a big piece(s) of the puzzle missing.
It is disappointing that even now, six-plus years later and after much very competent and extensive analysis and consideration, we still face considerable uncertainty. We seem to have two main areas of interest, separated by 1,500 nautical miles or more. I had hoped that careful consideration of ‘motivation’ would show a strong preference for one area or the other. Not sure that it does.
For anyone considering spending mega-bucks on another search – it’s a very risky call. Perhaps it would be better to use the money and see what can be learned by bribing, rewarding, coercing … people who may know something about these events and can at least reduce that 1,500-mile spread.
Hello Ed, David and TBill,
I did watch this from start, Jeff’s net and what I see now is that Ed, Ed brings a new solution not based on statisics and fuel models, I like comments of DennisW, but it was VictorI bringing Christams island scenario and Dennis too, I am missing comments on Ed’s endpoint. That is all.
Christmas. Sorry
Ed, it is lot of work. I dont want to scrap it all? Why believe it was not piloted? Maybe Dennis will count it
My proposal. Check Ed’s endpoint a then when nothing go Dennis way, do nothing.
@Sultan
You asked:
(1) “Why is Ed Anderson so ignored here?”
(2) “I don’t understand, why all of you are not discussing Ed Andersons story which is supported with some evidence, and yet you have only statistics”.
(3) “I did watch this from start, Jeff’s net and what I see now is that Ed, Ed brings a new solution not based on statistics and fuel models, I like comments of DennisW, but it was VictorI bringing Christmas Island scenario and Dennis too, I am missing comments on Ed’s endpoint. That is all”
I have been in contact with Ed Anderson since 2016.
I published a paper on Duncan Steel’s website on 8th August 2016 entitled “Hydrophone Data and MH370”. This was before Victor started this website in 2017.
This paper available at the following link:
https://www.dropbox.com/s/kvz9482cdh2lmzx/Hydrophone%20Data%20and%20MH370.pdf?dl=0
This paper was reviewed by Ed Anderson, Alec Duncan (Curtin University) and Tom Kunkle (Los Alamos).
A large number of contributors to Victor’s website have analysed the acoustic data from the Comprehensive Nuclear-Test-Ban Treaty Organisation (CTBTO) and the Integrated Marine Observing System (IMOS), including Don Thompson, Mike Exner, Barry Carlson, Henrik Rydberg, Victor, Bobby and myself amongst others.
You specifically mention Victor’s article on “An MH370 Flight Path Further North on 7th Arc” posted on 8th June 2018. I also wrote a guest article on “Drift Model Says MH370 Might Have Crashed Further North on Arc” posted on 20th July 2018.
When Ed Anderson launched his web site http://370Location.org on 21st March 2019, he emailed Don, Mike, Victor, Bobby and myself to let us know. We have had many interactions with Ed both on-line and off-line over the years.
Ed Anderson has considered many candidates and investigated many events (aircraft impacts, aircraft flybys, aircraft plumes and contrails, implosions, earthquakes, underwater volcano eruptions, antarctic ice break ups, lightning strikes, underwater geological surveys, meteorites, meteors, fireballs, bolides, …). Ed has reviewed together with us a large number of other reports from Curtin University, Los Alamos National Laboratory, the Nature publication by Osama Kardi et al. to name just a few. Duncan Bosworth at the ATSB and David Griffin at CSIRO also reviewed Ed’s work and we have exchanged views. The Java Anomaly candidate at 8.36°S 107.92°E in January 2017, the MH370 Acoustic Triangulation from CASY, MAW and DRV seismic stations at 25.9385°S 104.6275°E in February 2017, the Gulden Draak Seamount candidate at 28.75°S 99.25°E in March 2017, … have all been discussed and analysed in full.
Flight routes to various end points have been modelled such as BEDAX, PILEK, YPCC, (Perth) or IGOGU, NOPEK, BEDAX, ISBIX, POSOD, YPCC Cocos, YPXM Christmas, LADIR, TOPAR, LEMUS. Ed even used my old spreadsheet V17.0 for his analyses.
We have raised many questions with Ed over the years regarding various candidates, such as BFO errors, onboard fire theory, no debris finds in Java, debris drift to Africa too early, no detection from Ocean Infinity underwater scans, …
Ed has dismissed some of his original candidates based on various input he has received. As far as Ed’s “Consistent MH370 Waypoint Path to a Specific 7th Arc Location” published 23rd February 2019, I personally find the flight path first to Cocos Island, then to Christmas Island, then towards Jakarta (International Airport ICAO:WIII) as far as waypoint LADIR, then towards Yogyakarta (International Airport ICAO:WAHH) as far as waypoint TOPAR and finally towards Semerang and the Jenderal (International Airport ICAO:WAHS), only to run out of fuel 35 NM before the coast of Java as somewhat contrived and just trying to show that his candidate MH370 end point was feasible. It fails to answer the question why no debris finds have been reported on the coast of Java and it is way off the timeline of the arrival of the many debris items on the coast of Africa, Madagascar, Reunion, Mauritius and Rodrigues.
I agree with you, that acoustic events are physical evidence, but so are items of floating debris. So far, no acoustic events have been identified as being specifically from MH370, whereas a number of floating debris items have been confirmed as coming from MH370. Some acoustic events are likely to have been from MH370, but there are many more floating debris items that are likely to be from MH370.
We hold Ed’s work in high regard, but none of his candidates match the high probability of a MH370 end point, as described in our current paper.
@DennisW
You stated “Just tell us what you believe”.
Victor responded “If you are asking whether I think there was a negotiation that occurred before the murder-suicide, I would say probably not, for a number of reasons, including:
1. Other than the story that @TimR has relayed, we have no evidence that a negotiation occurred. I think @TimR is an honest broker. However, I have less confidence in his source, or his source’s sources, nor do I think a negotiation could easily be kept secret.
2. I don’t think it’s possible that the captain could control the passengers and crew without incapacitating them by depressurization.
3. The civilian radar data suggests a climb after the turnback from IGARI. That is consistent with a depressurization.”
Richard responded “I made my views about the psychological state of ZS very clear, having listened to a trained psychologist Sabine Lechtenfeld on the subject”.
Andrew responded “I suspect the diversion was motivated by ZS’s profound disillusionment with the political situation in Malaysia. It was intended to send a message, which necessitated his own suicide and the murder of 238 others”.
Bobby responded:
“1. The primary motivation was to bring worldwide attention to the corruption of the Malaysian government.
(2) The secondary condition was to achieve plausible deniability of his suicide, which would shame his family if it were proved”.
Now you have heard from each of us, have your views changed?
What are your current views on:
(1) Reason for the diversion.
(2) Timing and location of diversion after waypoint IGARI.
(3) If nefarious, motive(s) of the perpetrator.
(4) Negotiation with the Malaysian Government.
(5) Air Conditioning Packs being switched off.
(6) Cabin depressurisation.
(7) Climb to FL385 (40,538 feet) following diversion.
(8) Fly by Penang.
(9) Co-Pilot’s mobile detection.
(10) Radar detection heading north-west on N571.
(11) Lateral offset after waypoint MEKAR.
(12) Descent to avoid radar.
(13) FMT route.
(14) Kate Tee’s observation.
(15) Flight route into the SIO.
(16) Satellite data.
(17) Fuel data.
(18) Fuel exhaustion time.
(19) MH370 last estimated position.
(20) Active or passive pilot at the end of the flight.
(21) MH370 surface impact position.
(22) Aerial search.
(23) Floating debris finds.
(24) Drift analysis.
(25) Satellite data.
(26) Fuel data.
Apologies: Points 25 and 26 are repeats.
@Shadynuk
Many thanks for your kind words!
You stated: “I think there is a big piece(s) of the puzzle missing“.
I agree.
@Ventus45
Many thanks for the further insights.
I was not aware of the MH370apilotsperspective blogspot by Edward Baker.
I also had not thought of flying directly away from Mecca and facing aft on the cockpit floor.
@Richard
RE: “I also had not thought of flying directly away from Mecca and facing aft on the cockpit floor.”
That reminds me of the time I was flying from the Middle East back to our home port in East Asia and a flight attendant called the cockpit to ask if Mecca was towards the front of the aircraft or the rear. I somewhat facetiously replied: “It depends; do you want the long way or the short way?”
@Ventus45
Previously I noted that a turn to the ESE after 00:11 would not have made a significant (detectable) change in the BTO value at 00:19. What you are suggesting now is that the turn was made somewhat earlier. The sensitivity of the BTO and perhaps BFO at 00:11 to the assumed time of turn would need to be investigated.
@Richard
First of all, thank you all for the candid replies to my pilot suicide question and, of course, for all the work you have put into an LEP determination.
That is a long list Richard. Rather than provide a point by point response, I will try to address your post thematically.
I have long regarded the terminus question as a latitude question. The satellite BTO data is by far the most reliable data we have. The physics is very simple and very precise. Unfortunately the BTO data cannot distinguish latitude. All the other data is subject to various forms of degradation. I think your paper does a very good job of capturing that fact, and quantifying reasonable bounds on it.
Having said that, I find it very interesting that the seminal Inmarsat paper has a terminus very close to your most probable LEP, and it was published more than five years ago. Long before most of the data except the satellite data was available.
The flight path between IGARI and the fly by of Penang has interest only with respect to how it affects fuel consumption. I have no issues with your selection, and it closely matches my own conclusions. Whether the aircraft was depressurized or not during this part of the diversion is subject to speculation. I am of the opinion it was not based on the accuracy of the BFO logged at 18:25. The maneuvers between 18:25 and the FMT are something I gave up trying to model years ago, and I do not reject your lateral offset path model. I also have no objections to any of your conclusions regarding the phone registration, Kate Tee, radar detection, or possible radar avoidance.
Your fuel/weather model is no doubt the “best of breed”. I have previously expressed my disappointment in the earlier Boeing modeling. It seems casual by comparison. As far as the end of flight is concerned I believe the aircraft began a gradual descent at 00:11, and accelerated to the ocean surface in a steep dive at 00:19 without a recovery and glide. If the PIC wanted to make a shallow approach to the ocean surface he would have done so before fuel exhaustion.
My opinion relative to the reason for the diversion is unchanged, but I am unable to see how that is helpful to our determination of the LEP.
@Andrew
You said:
That reminds me of the time I was flying from the Middle East back to our home port in East Asia and a flight attendant called the cockpit to ask if Mecca was towards the front of the aircraft or the rear. I somewhat facetiously replied: “It depends; do you want the long way or the short way?”
For some reason that reminded me of the Jean-Paul Sartre story below:
Jean-Paul Sartre is sitting at a French cafe, revising his draft of “Being and Nothingness”. He says to the waitress, “I’d like a cup of coffee, please, with no cream.” The waitress replies, “I’m sorry, Monsieur, but we’re out of cream. How about with no milk?
@Dennis said: I am of the opinion it was not [depressurized] based on the accuracy of the BFO logged at 18:25.
Due to the high bit error rate (BER), Inmarsat has advised that this value is meaningless. Mike Exner also studied this event and believes there was likely a packet collision between MH370 and another AES. On the other hand, the excursion and stabilization of subsequent BFO values is consistent with a warm-up.
If you are proposing that the SATCOM was not powered down (I’m not sure you are), how do you explain the ACARS messages at 18:03 not received (disabling the ACARS SATCOM link prevents transmitting, but not receiving, messages), and the log-on at 18:25 without a preceding “normal” log-off message?
@DennisW
Many thanks for your summary! You have addressed all the points I requested.
Congratulations on getting all the authors to share their personal (but now no longer private) views on the reason for the diversion!
We had decided to write the paper neutrally with respect to the pilot, who remained unnamed. We did give an argued opinion about the pilot wanting to be seen by radar heading NW initially and later not seen by radar at the turn south. We did not see that any unfounded speculation about the reason for the diversion, changed the MH370 end point. I agree with you, when you state: “My opinion relative to the reason for the diversion is unchanged, but I am unable to see how that is helpful to our determination of the LEP“.
@Victor
I have no explanation for the satcom behavior between IGARI and 18:25. Powering down the aircraft electrical system has always “seemed” to me to be a drastic step with no apparent purpose.
Yes, the accuracy of the 18:25 BFO with respect to aircraft speed, track, and position could be serendipitous. I am just not inclined to think that way.
@Richard
@DennisW
“Congratulations on getting all the authors to share their personal (but now no longer private) views on the reason for the diversion!”
Yes I feel that was a very significant discussion above. Also important was @Andrew’s background info on Honeywell vs. Boeing account of Heading vs. track after discontinuity. Especially DrB input is important to me, because he has been less convinced over the years of pilot intent vs. accidental overflight of some kind.
The net effect is, after 6 years, we have technical consensus that a straight flight path to SIO that meets BTO/BFO cannot have (in all likelihood) resulted from an accidental overflight due to mechanical issue. In addition, if the flight path was not strictly straight, it also has to be intentional flown to meet BTO/BFO.
There is no apparent way to argue fire or mechanical issue, except to invoke something extremely unlikely and inexplicable happened that made the overflight appear like a hijacking. Which is a self-limiting explanation, because it is unlikely.
Questions for the group:
My observation is that at this point, our discussion of new facts or insights is slowing. I believe that one area that merits further investigation is the quality of the sonar data near the LEP, but that is not easy for this group to evaluate.
Either Ocean Infinity will decide to resume the search (with or without the support of Malaysia), or it will not. That decision is out of our hands.
So, what does this group believe are the areas that need further investigation? Have we reached the point where we’ve taken it as far as we can?
@Richard
thanks for your reply, I did not want to be rude at all, I was writing it on the roof, in the middle of the night hunt.
You all have my respect for your work.
I did try let my 10 y old girl and 30 y old wife drive a plane in MS F X… There is a novel from Tom Block: Mayday
@Victor
I think we have reached a limit to what can be extracted from the information we currently have. It could be argued that more information i.e. raw rader data, previous 9M-MRO flight data,… might shed additional light on our conclusions, but it might not.
From a purely theoretical perspective, it would be interesting to take a look at what decision theory / game theory says relative to a new search. What would be more valuable? A negative new search from 36S to 31S or a negative new search from 25S to 20S? Forget about the probability of finding the aircraft, and minize the maximum loss that could result from a new search.
From Wiki below:
Minimax (sometimes MinMax, MM[1] or saddle point[2]) is a decision rule used in artificial intelligence, decision theory, game theory, statistics, and philosophy for minimizing the possible loss for a worst case (maximum loss) scenario.
@DennisW: If there is a new search, it is likely to be the last one for a long time. In this light, I think the strategy should be to search the area with the highest probability of finding it.
There was the same result, when they were trying to fly. I think, lot of people were fascinated with automated flight and final major turn. And instead it was piloted in some way. This is why I am asking Ed scenario is not discussed or Captio…
@Victor,
Yes, I understand your point of view.
In a previous life I interacted with Knuth at Stanford on various approaches to the “Mastermind” game. You can make a guess which is optimal from the point of view of being correct (there are many such guesses) or you make can make a guess which minimizes the possible number of remaining solutions (much more difficult) – entropy reduction.
As you might imagine, the long term view proved to be the best. Your opinion on the liklihood of additional searches is short sighted. Not to say it is incorrect.
“Science is what we understand well enough to explain to a computer. Art is everything else we do.” – Donald Knuth
@VictorI
You wrote “So, what does this group believe are the areas that need further investigation? Have we reached the point where we’ve taken it as far as we can?”
I still have some points for discussion regarding your paper, and some general thoughts to share, however currently lack the time to enter a detailed discussion. I’ll try to share next weekend.
@Sultan
You stated “thanks for your reply, I did not want to be rude at all, I was writing it on the roof, in the middle of the night hunt
You were not rude, you asked some very good questions. I fully understand that you like the work of Ed Anderson, because he is very competent and has investigated the acoustic events very thoroughly.
We have also analysed the Captio flight path in detail and had a number of exchanges with Jean-Luc Marchand.
@DennisW
Sir, you ordered a Flight Path sunny side up without BFO, but we have run out of BFO, would you take your Flight Path without BTO instead?
Thanks Richard. We do care in central Europe too. I dont follow Twitter or Facebook, i did watch for years version of final major turn but no more. Try to look elsewhere
@Richard
I’ll have to “Ask Maryilyn”.
I am trying to look. That is all. Ed has some interesting things on his website.
Okay, my opinion,
Ed Anderson is right!
A few days ago the debate regarding the NORM / TRUE switch setting arose again. We all understand, of course, that SOP requires the switch to be in the NORM setting except when the flight traverses latitudes where the magnetic variation is changing rapidly, i.e. nearer the poles, and at these latitudes TRUE is selected.
So, consider the situation where the pilot flying has decided, at or about the time of the FMT to the south, has already decided that he wanted to dispose of the aircraft as far south in the SIO as possible, and as far from land as possible.
Selecting LNAV to a distant waypoint, the South Pole, would certainly be an option. Manual insertion of such a waypoint is a trivial exercise to an experienced pilot. But an experienced pilot would also understand that an extended track far to the south that relied on a magnetic heading would curve toward the East, and progressively moreso the further south the aircraft flew. Recognising that this would occur, an experienced pilot might, alternatively, select TRUE, such that the aircraft continued on a heading based on a TRUE reference following a route discontinuity.
I’m not arguing that this is the case. I’m just proposing that selecting TRUE at some point [around the FMT, for example] which would normally be considered strange, could be considered a perfectly rational decision, [but not SOP], by someone hell-bent on disposing of the aircraft. [Not a rational decision, I hasten to add.]
@Brian Anderson: The fit of true heading paths is not good due to the crosswind. With no pilot inputs after 19:41, the fits to LNAV and true track path are much better.
@Brian Anderson
WRT NORM/TRUE – I agree, as previously stated.
@Modellers – with the latest spreadsheets.
A suggestion.
Let’s assume that the switch was made to TRUE – at some point.
The question then becomes – where/when did the switch occur.
It would seem that it would have to have been done, sometime after the FMT, and probably at – or before – the equator.
Assuming that is correct, would it be possible to analyse the effects of a switch at various latitudes between the FMT and the equator, for different headings (at each whole latitude say) and might that generate more paths of interest ?
@Brian
I’m not arguing that this is the case. I’m just proposing that selecting TRUE at some point [around the FMT, for example] which would normally be considered strange, could be considered a perfectly rational decision, [but not SOP], by someone hell-bent on disposing of the aircraft.
It is hard for me to warm to the idea that the PIC was hell-bent on disposing of the aircraft. To me this is a fantasy given the state of the art of search capabilities at the time. The mystery of “where is MH370” is more likely to be accidental rather than some preconceived plan on the part of the PIC. How could any experienced airman believe he could effectively hide the terminal location of a 777.
@Brian Anderson, Ventus45, DennisW, et al.
Earlier today Victor and I exchanged a series of emails that helped me clarify my understanding of how LNAV handles a discontinuity and how the track hold and track select relate to the “true track” case of the Bayesian Methods paper. i appreciate Victor’s patience, although I am not sure he appreciates my obstinacy.
(Please note that this post is composed after a Zoom cocktail party.)
Talking about possible paths requires simulation once a scenario has been proposed. Otherwise it is just speculation since it can be shown by experimental example that potential solutions are very sharply defined when computed as actual paths.
What has always bothered me about the 186T scenario with the FMT is that the reason for 186T was only supported by an error analysis (previously posted). Yet the path passed so close to ISBIX that it must have been a waypoint in LNAV. Then the behavior after the discontinuity at IBEX is problematical, particularly as Victor has stated.
Well, no problem. A LNAV waypoint including ISBIX as the last end point was entered. At some time after the turn at IGOGU, the track hold button was pushed. This froze the track at close to 186T (I speak from memory, but it is about 185.9). Winds are compensated. Alternatively, the pilot determined the initial true azimuth to ISBIX as 185.9 and entered 186 and pushed track select.
If you look at the early portion of the GCP, it takes a long time for the azimuth to deviate meaningfully from 185.9, So there is very little difference in the actual paths. The GCP would be slightly further south. Using a true track saves about 150kg of fuel.
I need to sleep on this and carefully check the spread sheet as I have not combined waypoints and rhumb lines before.
This still does not give any insight into why the plane was not found already.
@Victor. I conflate two of your most recent posts.
“So, what does this group believe are the areas that need further investigation?”
“….I think the strategy should be to search the area with the highest probability of finding it.”
What to me could do with some work is where to search after A1, if needed and there is willing, whatever A1’s size and shape.
Since a piloted SIO leg is largely ruled out by the paper’s packs-off final leg, is the priority for A2 and or A3 higher than other candidates?
Judgements could be made on what alternatives might offer in comparison, say a search further up north or down south than has been searched to date.
One yardstick might be the probability per unit area. The area would be enlarged by it being glide dependent.
Dennis: Re 18:25 BFO data…There was definitely a packet collision. BER and SNR data both clearly show that fingerprint. That BFO data is not reliable.
@Sid Bennett
RE: “Well, no problem. A LNAV waypoint including ISBIX as the last end point was entered. At some time after the turn at IGOGU, the track hold button was pushed. This froze the track at close to 186T (I speak from memory, but it is about 185.9). Winds are compensated. Alternatively, the pilot determined the initial true azimuth to ISBIX as 185.9 and entered 186 and pushed track select.”
You omitted a step. The pilot would also need to select the HDG REF switch to TRUE. Otherwise, the ‘frozen’ track would be 186M, not 186T.
@ALSM
I don’t dispute that, Mike. The fact remains that both the BTO and BFO data are what you would expect them to be at 18:25.
Dennis: I understand what you mean, but in fact, we should expect the first BFO value following a cold start to be in error by 100 Hz or so, based on the other cold starts observed (MH371 had one for reference).
Dennis: Take a look at this comparison of the 12:5 and 18:25 cold starts:
https://bit.ly/2VJht2y
@DennisW,
You said: “How could any experienced airman believe he could effectively hide the terminal location of a 777.”
ZS did just that, and not because he was lucky.
@DennisW
RE: “For some reason that reminded me of the Jean-Paul Sartre story…”
Thanks – an interesting question. I prefer mine ‘with no cream’!
@ALSM
I agree that your comparison reference is compelling.
@DrB
We certainly have differences of opinion. I think for the most part they are healthy. Your response to my “suicide question” evoked a tangent in my thinking that I had overlooked previously.
@Richard
Interesting 2016 background paper on the acoustic anomalies that you wrote. Thank you.
Here is my frustration, although in the past I always felt we should focus on Arc7, now I am at least equally open that there might have been a longer flight after Arc7. So I am open to crash times later than 00:20, and distances farther from Arc7. If that is true, then historic acoustic analysis and drift calcs based on Arc7 at 00:20 are less useful. I know you tried to do some off-Arc7 drift calcs for us at one point.
@Andrew
Yes, of course. But True North might easily be the selection for an oceanic trip. The most significant evidence in favor of it is the data. The 186T route, whether it is a GCP or a rhumb line is surprisingly consistent with the observed data. This is true since the actual paths are so similar.
It would be better to find an explanation consistent with as many of the physical/operational constraints as possible and which is not prohibited by any of them.
We seem to be avoiding the discussion of why the initial search and the follow up searches of the sea bed found nothing. Was it due to an inadequacy of the search equipment or method?; was it that the wrong area was searched?
I would like to see a tabulation of the current models (not speculations) of the flight path with the proponents best written description. We can then more adequately focus on the comparison of the potential locations.
https://www.dropbox.com/s/if7osw7t5qe2o0v/Track%20hold%202-posted_042020.xlsx?dl=0
Good morning. Today is a bridge day so I will be off and on…
The spread sheet I posted is typical of a number of iterations I have made altering the parameters slightly. It is not the “best”, but highly representative. The key points are LRC at 41000 feet, a start at IGOGU, overflying ISBIX on a True track of 185.89 deg T.
I have also done full paths from 18:22 which are close to this, but I have not spent enough time fiddling with the size of the track offset, nor do I really know if that portion of the path is ECON or LRC. But the important point is that the path is consistent from 18:22 and thus from take off to fuel exhaustion.
Recall that the fuel computation is computed on the basis of both engines with the same PDA, so the fuel first engine fuel exhaustion slightly before 00:11 reduces the fuel consumption thereafter.
Certainly, inspect the remainder of the spread sheet, but remember that there is a “funny” in col O where a change in true initial azimuth may need to be hand propagated. If you have a problem and would like to discuss a detail, please let me know and I will try to help.
Again, thanks to Victor and the group for correcting some of my misunderstandings.
@Richard,
Thank You for your synopsis of my work, and my interactions with you and other researchers.
That acceptance means a lot to me.
If some reporter should ever want to know background on 370Location.org I’ll point them to your comment rather than tooting my own horn.
Your characterization of my scenario is fair and appreciated, though I thought I had addressed the objections of no Java debris, and debris timing.
Winds and currents were consistently offshore and westward from my candidate site, which would take the debris away from Java. More surprising perhaps is that no ships reported passing through a debris field, since it would have crossed shipping lanes.
Debris from near Java would have gone north of Christmas Island. First arrival should have been Cocos, but plastic debris researchers and cleanup volunteers were not on alert there. (I asked). There might still be debris evidence on Cocos if Java was the origin.
Debris arriving in area months or even years before it was found should not be a reason for exclusion. Likewise, also know that even a direct path can have very circuitous drift components. A modeled direct path could be much faster than the real path along the same route.
@Sultan “Ed Anderson is right!”
Again, I appreciate the sentiment but don’t think that’s going to win hearts and minds among experts. It implies that others are wrong. It’s a vote with no explanation. If someone were giving me the same pitch, I’d want to hear a reasoned argument for or against.
Yes, I do have a lot of reports on my website. I should probably mark as expired some of the older ones that didn’t pan out (like tracking thermal imagery), while some of the very old reports do have recent updates.
@Richard, @DennisW: “Sir, you ordered a Flight Path sunny side up…”
That got me! This is not the Path I would have chosen. 😉
@VictorI,
> “So, what does this group believe are the areas that need further investigation?”
I believe the focus will continue to evolve in ways that we can’t anticipate.
I’m still working on multiple algorithms with the acoustics.
‘Moment of Velocity’ and spectral whitening ‘frequalization’ are producing new results.
There may yet be surprises that favor your candidate.
> “Have we reached the point where we’ve taken it as far as we can?”
This forum is the best place to openly exchange real MH370 research in a thoughtful way.
Despite any atrophy of original contributors, my hope is that you will keep this valuable resource
online as a reference, and open to new contributions until the plane is found.
If discussion degenerates, before shutting it down please consider moderating, setting rules, or delegating.
@370Location: No doubt, the work you are doing is technically excellent and original. It may eventually lead to a breakthrough.
We don’t really have a problem here with commenters that distract from the discussion. We’ve had a handful over the years, but they’ve either voluntarily or involuntarily found other venues.
@370location
My apologies for missing the points you made about floating debris and offshore currents/winds and early arrivals in Africa from the Java area. I agree that ocean drift can suffer from random events, such as gyres, eddies, storms, etc. I have sailed through a gale force nine in the Indian Ocean. I also appreciate we have a small sample of 28 floating debris items, that are either confirmed or likely from MH370, but I think some of the 28 floating debris items would have arrived and been reported much earlier than we have observed, as David Griffin explained.
With a crash site around 35 NM offshore, I think fishing boats would have spotted a large floating debris field from an aircraft crash. If 28 floating debris items have been found and reported, there may have been several thousand debris items in the crash area at the time just after the impact. The larger tankers and container ships are probably used to the fact, that the world’s oceans are full of floating junk, because they create a lot of it. Apart from disinterest by larger vessels, who prefer to watch their radar screens, rather than perform lookout duty, the floating debris will soon disperse, as we have seen with finds as far apart as Tanzania and South Africa.
Ed, I think that Richard’s answer was very fair. I did not know about your cooperation. But do I think right when I will write, that controlled glide was possible? Why not all parts of flight?
There is why I believe that you did the breakthrough, supported with some evidence not based on FMT or satellites.
@Sultan
I do not understand why you accept the acoustic evidence from Ed, but appear to reject evidence from other sources such as the aircraft performance data, satellite data, fuel data, debris data and aerial search data.
In my view (and I believe Ed would agree with me), you need to weigh all the evidence.
The only reason, why we did not include an analysis of the acoustic data in our paper is, as Victor has stated above, that although there are many excellent studies (done by Ed, Curtin University, Los Alamos and others), there does not appear to have been a break through, to define a MH370 end point yet.
There are a large number of interesting acoustic events, but none that have been proven to match a location near the 7th Arc and the time (or not that much later than) of the fuel exhaustion, a crash or an underwater implosion. Due to significantly higher water pressure following an underwater descent of debris items like aircraft fire extinguishers or oxygen cylinders, they will implode when the external water pressure is greater than the structure can take. @Don Thompson has analysed the acoustic events and in particular the possibility of an implosion in detail.
@DennisW
You stated. “What is currently being under-considered, IMO, is significant peripheral information.
> A ZS WeChat moments before takeoff with an unidentified recipient (false ID SIM purchase)
> Malaysian high level interference early in the S&R (uncharacteristically noted by ICAO)
> ZS suicidal ?? He was a Malaysian patriot (Sabine’s conclusion as well)
> ZS was active in Malaysian politics, and troubled by the rampant corruption
> A lack of transparency relative to data release (radar, prior flights,…)“.
Let me give you the reasons for my opinion, that ZS is responsible for the loss of MH370:
1) The ZS flight simulator evidence.
(2) Last person in control of the aircraft.
(3) Capacity to divert the aircraft.
(4) Opportunity to lock the co-pilot out of the cockpit.
(5) Climb to a higher flight level, depressurisation and air conditioning packs switched off.
(6) Passing several airports in Malaysia, Thailand and Indonesia at Kota Bharu, Penang, Langkawi, Phuket and Banda Aceh without an emergency landing.
(7) Sending and receiving a SMS to/from unlisted numbers in Egypt (SMS OUT to +20-810123823984, SMS IN from +20-910123035499) between 1st January and 7th March 2014 (although ZS and MAS do not fly to Egypt).
(8) ZS’s WeChat last log-in activity was recorded at 00:40:02 UTC, just after runway 32 alpha 10 line up clearance at 00:38:43 UTC and before departure clearance at 00:40:38 UTC.
(9) The short time interval between the last radio message and the diversion.
(10) The timing of the diversion at a FIR boundary.
(11) No mobile detections from any passengers.
(12) Co-pilot’s mobile telephone detection when passing Penang Island.
(13) Flying at a normal cruise altitude to ensure radar detection at waypoint MEKAR heading north-west.
(14) Descending below the radar for the FMT.
(15) Political activism and profound disillusionment with the corruption in Malaysia.
(16) Psychological state showing a serious midlife crisis and unravelling, frequent political and anti-corruption ravings to a total silence on the subject and finally an inner emigration.
@Richard said: Sending and receiving a SMS to/from unlisted numbers in Egypt (SMS OUT to +20-810123823984, SMS IN from +20-910123035499) between 1st January and 7th March 2014 (although ZS and MAS do not fly to Egypt).
How do you think this relates to the disappearance? Do you think it implies collaboration?
@Richard
Yes, lots of reasons to assign the diversion to ZS. A couple of additional thoughts.
DrB’s reply to my suicide query resulted in a change of thinking on my part. While I don’t agree with DrB that a reasonable person would assume they could hide the terminal location of a 777 for an extended period of time, much less indefinitely (Uri Geller perhaps), ZS had the motive for not wishing to embarrass his family with evidence that he was a murderer. Depressurizing the aircraft would show up on the FDR.
Sabine convinced me that there was nothing alarmingly wrong with ZS’s personal life (we all go through a “crisis” from time to time). His motive for the diversion did not readily fit a suicide scenario. He loved his family, his country, and the job he had.
@Victor
I think the SMSs require an explanation.
I could not find the numbers listed anywhere.
I rang both numbers and the first gives a recorded message in Arabic and English saying the number no longer exists.
When you ring the second number, there is no connection. The local code 91xx in Egypt is reserved for premium services. There is no premium service listed in the internet at this number.
I question why ZS was communicating with Egypt in the 3 months before the MH370, since MAS neither fly to Egypt, nor did ZS take any holiday.
@Richard
The SMS is new news to me. Any implication this was from aircraft SMS? I do not think we can get too much from it now (FBI probably would have followed up on that — and numerous other leads — up like a pit bull, but not Malaysia). It does raise the question if there is more to the MH370 story than we know, and of course, sure, there could be puzzle pieces we do not have.
Re: WeChat at 00:40 – I always like to point out that MH370 departed gate at 00:27 about 8 mins early compared to 00:35 scheduled gate departure. Agree that take-off clearance time is as you note above.
@DennisW
If we take deniability theory to the fullest, then I will be surprised if ZS allowed depressurization steps to be clearly recorded. My expectation is either cutting EEBay CBs or cutting RT XFER BUS or creating a false emergency to make the action appear justified.
@DennisW
Andreas Lubitz managed to keep his problem from his employer Germanwings and the Lufthansa doctors who gave him his regular medical checks for quite some time. He was the nicest guy you could hope to meet according to his flying club mates and had just bought two new cars (one for him and one for his girlfriend).
I have only met one person, who I found out later had committed suicide. He was young man, just completed his university degree successfully, had a nice girlfriend, just bought a car, had a job offer waiting for him and had made plans to travel the world. None of his friends saw it coming and we were all shocked when it happened.
@TBill
The SMSs are in the RMP report, but unfortunately they only give the timeframe and not specific dates and times.
There is no follow up on the SMSs and no further mention in the RMP report, as far as I can see.
@DennisW,
You said: “While I don’t agree with DrB that a reasonable person would assume they could hide the terminal location of a 777 for an extended period of time, much less indefinitely (Uri Geller perhaps), ZS had the motive for not wishing to embarrass his family with evidence that he was a murderer.”
First, I did not say “a reasonable person could assume they could hide the terminal location.”
I did say: “ZS’s very clever plan was well executed, successfully disappearing the aircraft and all souls on board, and achieving his goals.”
In other words, a senior B777 captain could believe that, in his part of the world, he could disappear a B777. The complex post-diversion route is evidence of pre-planning and incorporation of multiple strategies. I very seriously doubt he would carry out his plan unless and until he was confident he could succeed. So, I believe he thought he could succeed in preventing the aircraft from being found within a period of many years. That, as it turns out, is necessary to prevent incriminating evidence being found on the FDR, should it be recovered.
You also said: ” Depressurizing the aircraft would show up on the FDR.” I believe this is correct. There are two actions to make depressurization effective and rapid. One must open the autflow valve and shut off the air packs. I think both would be seen in the FDR data.
There could also be incriminating evidence on the CVR, such as people pounding on the cockpit door. That evidence cold be removed by restoring power to the L main bus circa 18:24 and letting it re-record over the old data for two hours. That’s the only reason I can see why the power was restored at 18:24. So, first it was useful to shut down the satcom capacity during 17:26 to 18:24, to prevent the flight crew from communicating. Once they were incapacitated, the power could be restored to restart the CVR and re-record over the diversion period. So, there are logical reasons for the captain shutting off the L Main Bus and for restoring power to it an hour later.
ZS made at least two slip-ups, but they have not as yet resulted in the FDR being found. First, he was unaware that Inmarsat recorded BTOs and BFOs for every satellite communication sent from the aircraft. Second, he was probably unaware that that the flight simulator program wrote some parameters on the hard disk even when no file was explicitly saved by him. In my opinion, these two pieces of evidence make him the prime suspect, but neither has yet led to unassailable proof of his culpability.
@Richard
Yes, there are proabably many examples that fit the pattern you describe above. Lubitz was receiving “diagnostics”, but medical disclosure rules in Germany (as elsewhere) are very strict.
cut-paste below:
The Düsseldorf University Hospital said in a statement that Mr. Lubitz had been seen in their clinic in February and a last time March 10 for what it called a “diagnostic evaluation.” The hospital refused to give further details, citing Germany’s privacy laws for medical records, including those of the dead, but denied reports that the co-pilot had been treated for depression.
I run into what “appears” to be a suicide a couple of times a year in my EMT duties. No real pattern is obvious except the people tend to be younger than you would expect. I am not qualified to opine on a cause of death, so my opinion in pre-hospital paperwork is irrelevant, and would be considered inappropriate. Never encountered a mass casualty event related to mental illness which is a whole new dimension to suicide.
Some insist that a suicidal pilot would not fly off into the ocean and disappear. I haven’t mentioned this before, but 34 years ago, a childhood friend of mine did exactly that. After taking off alone in a Cessna 172, he flew towards the ocean, and was never seen again. The wreckage was never found. He was only 25. (He had a history of mental illness.)
http://www.digifind-it.com/redbank/_1980-1991/1986/1986-05-27.pdf
@VictorI
I did see similar thing when i was young, my friend from next door, playing soccer, baseball (in europe!) and other things what children do, he did jump when he was 13 years old in the school, first we saw his shadow as he was falling, then ale of us in class rushed to windows. Next view was on him on ground in blood. What we learn later he was trying to jump earlier but guys on wc did stop him. He jumped from 4 floor when teacher and 25 children in his classroom were watching…
@Richard
I did some investigations in my life, will try to give some better answer on my view, I have now night shifts and I am only on my phone
Why there is controlled glide, if all simulation data, fuel mode and satellite data shows opposite?
@Victor, @TBill,
I stated yesterday “I think the ZS SMSs require an explanation“.
I have now found the explanation.
In the RMP report – folder 1 – page 192: The RMP report states that ZS sent an SMS to a telecommunications subscriber in Egypt at the number 20810123823984 identified as “SUB Telco Egypt”.
In the RMP report – folder 1 – page 193: The RMP report states that ZS received an SMS from the same subscriber also identified as “SUB Telco Egypt”.
Indeed the country code for Egypt is 20.
Different countries use an international dialling prefix of “00” or “011” or “010” or “0011” or …
Mobile phones generally use an international dialling prefix of “+”.
In the RMP report – folder 1 – page 192: The RMP report that ZS also sent an SMS to a telecommunications subscriber in Indonesia at the number 00628124675305 identified as “SUB Telco Indonesia”. The country code for Indonesia is 62, but this time the international dialling prefix of “00” is used. The number turns out to be a taxi service in Denpasar, Bali that ZS used when he flew to DPS airport.
If the Indonesian number was “0062”, why wasn’t the Egyptian number “0020”?
The answer is that ZS, who had a Nokia Lumia 925 and whose service provider was Celcom, bought a prepaid SIM from another Malaysian provider Maxis. The setup of the new SIM generates a SMS from his new provider Maxis with his number, with the prepend 2091 followed by the new number 0123 823 984. When ZS wanted to switch back to Celcom, he sent a SMS with the prepend 2081 followed by 0123 823 984 to Maxis.
The co-pilot did the same, but more frequently. The co-pilot had both a Blackberry Q5 with Maxis and an Apple iPhone 5S with Celcom. He bought 5 prepaid SIMs variously from Maxis and Digi.
In the RMP report – folder 2 – page 113: The RMP report states that FH received an SMS from 6 different numbers with a prefix “20”, variously from Maxis and Digi, but this time the subscriber is identified as “2091” or “2093” followed by a set of 10 digit number mobile phone numbers and not as “Egypt”.
In the RMP report – folder 2 – page 112: The RMP report that FH sent an SMS from 8 different numbers with a prefix “20” and the subscriber is identified as “2091” or “2081” or “2061” or “2093” followed by one of the same set of 10 digit numbers.
In the call details in folder 2 – page 11, you can see this process in detail. On 1st March 2014, FH had a day off work and was obviously trying out this process. At 17:54:35 he received an SMS from Maxis with the number 2093 0127 020 747. At 18:25:24 he sent an SMS to Maxis with the number 2093 0127 020 747. At 18:27:06 he received another SMS from Maxis with the number 2093 0127 020 747. He also called the Maxis Hot Line.
The RMP was misleading to say the two ZS SMS communications were with “Egypt”. Having found that the 14 SMS communications of the co-pilot were with “Egypt”, I could have started a new conspiracy theory. I could have added that the SMSs with Indonesia by both ZS and FH were with contacts who knew about radar operations.
Alas, no juicy conspiracy theory. All we are left with, is another mistake in the RMP report and pilots who regularly buy prepaid SIMs, when they travel internationally.
@Richard: Thank you for running this down.
I am not aware of any hard evidence to date that would lead us to believe that the pilot collaborated with others prior the diversion.
@Victor
I agree! ZS acted alone.
@Richard: Based on what we know, I think this is most likely, although we can’t be sure.
My last message was inclompete because of wearing gloves and me full retarded, trying to drive my phone, it was part of larger consideration. I am sorry to all.
Bobby Ulich,
I am replying to your post from April 7 regarding your discussion of the various correlation coefficients. I largely agree with your assessment of the statistical independence of the correlation coefficients, but note that their effectiveness as route discriminators needs to be proven by demonstration. To that end I have now incorporated them into my least squares merit function. I have added a second appendix to my report to describe my assessment of their imapct in the least squares. Although there are changes in detail, the overall conclusion remains that there is a strong correlation between start heading and start latitude such that there is a considerable spread in the predicted final location on the 7th arc.
https://drive.google.com/open?id=1boyQXl7y3NedPrlAdGeK8PRCh69vhissCcOtXAzPTVc
I looked at the documentation for Excel SOLVER and used it on a sample problem. It implements the gradient descent method, which is what I use,but to do so it needs to determine an large number of “tuning parameters”(such as parameter increments) automatically to get it to converge properly – there is no facility to input these numbers by hand, which is what I do. You have already noted this “feature.” Also, its various reports do not provide simple things like parameter error estimates, the covariance matrix, or other key information, which is a signficant deficiency. No wonder people have developed add-ons such as SOLVERAID and SOLVERSTAT, and even those have issues. Are you using any such add-on?
I do not know why you consistently arrive at a heading of 180 degrees with your Monte Carlo simulations. Physical intuition says there isn’t enough information in the data to constrain the heading (and thus the LEP) with such precision. If you post the BTO/BFO values for one case, I can run them through my code.
@Victor
Very interesting story above.
We lived in South Jersey at that time, but I do not recall that case.
@DrB. About your comment, “There are two actions to make depressurization effective and rapid. One must open the outflow valve and shut off the air packs.”
Z had several options:
• Rapid cabin decompression towards ambient pressure, outflow valves open wide, packs off.
• Stop that after a hypoxic 25,000 ft cabin altitude was reached to reduce the decompression risk to himself holding there as long as needed. From my earlier post, it would take about 7 minutes to get to that based on an outcome from Victor’s simulator .
• Open the outflow valves and leave the packs on. @TBill has simulated that at my request (thanks Bill). The time is about the same.
Thus supposing his and Victor’s simulators give similar results and they are representative then packs-on makes little difference.
• The first or second dot point followed by packs back on, on reaching his cabin altitude target.
Z could have done similar home simulations. There is no sign that he took or positioned warm clothing onboard. He might have discounted his supplementary electrical foot and shoulder heaters as being insufficient to overcome the cold; and power to those may not have been available anyway.
Leaving the packs on or restoring them as per the last option should have kept the temperature up some.
He might think also that if the timing difference is indistinguishable, leaving the packs on throughout could increase the ambiguity in the cabin.
I appreciate this would conflict with your paper’s packs-off continuing but on the face of it I would have thought that at least for the first decompression he would have taken the third or fourth option all the same.
As to the SIO leg, he had the choice to just repeat what he had done earlier; though based on your paper, he didn’t.
@Victor
You clarified regarding ZS acting alone “@Richard: Based on what we know, I think this is most likely, although we can’t be sure“. I agree, my original statement was not carefully worded.
I would also add for clarification:
There is no direct evidence that ZS is guilty of a crime, that would stand up in a court of law.
The FDR might deliver direct evidence, the underwater wreckage might deliver direct evidence and possibly even the CVR or a mobile found in the wreckage might deliver evidence.
At the moment, there is simply a large amount of circumstantial evidence surrounding motive, opportunity and means.
@David,
You said: “As to the SIO leg, he had the choice to just repeat what he had done earlier; though based on your paper, he didn’t.”
The fuel modeling results in our paper indicate it is more likely than not that the air packs were off for almost all of the time after 17:26. This includes the first hour after diversion and the entire SIO leg after the FMT. Insofar as I know, there is nothing in our paper to show that what was done in the first hour was any different than what was done in the last 4.5 hours. The best MEFE match actually occurs with the air packs off for the entire time after 17:26, although from a likelihood perspective we can’t distinguish between the air packs never being on after 17:26 and them being on for only an hour or so.
@Richard:
If I had to rank hypotheses about the disappearance, with the first item in the list being the most likely, it would be something like this:
1. MH370 was deliberately diverted.
2. The captain was at least partially responsible for the diversion.
3. The diversion was a demonstration of political activism.
4. The mental state of the captain was not well.
5. The captain acted alone.
@DrB
@David
David asked me to look at depressurization by leaving bleed air on, but outflow valves full open (below). For that test I used FSX/PMDG because the older FS9/777 (that ZS had used in 2014) is not very realistic for depressurization (although PSS777 will give an estimate).
Another possible scenario that I have mentioned (on Twitter), if the pilot wanted to turn off bleed air but maintain cabin pressure, he could have closed the outflow valves 100%. PMDG estimates a leakage rate of about 100-ft/min so an alive pilot would have to top off pressure once in a while. Of course actual leak rate would depend on tightness of 9M-MRO. This case offered because it was suggested an alive pilot could not tolerate FL390 pressure for very long, even with the pressurized O2 mask.
For the age old question, why did ZS do the sim work? strikes me @Andrews comment above – to get a feel for the magnetic curvature, is one possible explanation. However, that explanation requires postulating the sim case was 180S magnetic vs. the usual assumption of LNAV to NZPG.
FSX/PMDG Estimate – Outflow 100% – Bleed Air ON
Time Pres Rate
12:52 8000 4000
12:53 11800 3800
12:54 14700 3300
12:55 17800 2800
12:56 20400 2500
12:57 23000 2200
01:01 29600 1400
01:07 35600 600
01:10 37300 400
01:15 38300 50
01:20 38900 0
@sk999,
You said: “Although there are changes in detail, the overall conclusion remains that there is a strong correlation between start heading and start latitude such that there is a considerable spread in the predicted final location on the 7th arc.”
The strong dependence of the bearing and starting latitude is produced by the nearly perfect rotational symmetry of the handshake arcs. As I have said previously, besides the BFOs, the two things which allow one to solve for the bearing at all are the satellite motion (which translates the centers of the arcs), and the weather data, in particular the temperature and the along-track winds (which cause the ground speed to be location-dependent). It is clear from my work that the weather effects contribute significantly to improving the route selectivity. One must include all the correlation coefficients, including the one using along-track position errors, and one must use an accurate 4-D interpolation method for the weather data (at many points along the track) in order to maximize the route-fitter selectivity.
I will also point out that my fitter uses a different objective function that yours, and one should not expect them to behave identically. For instance, I require 3 conditions on the Ground Speed Errors (GSEs) be satisfied in the fit. Removing those conditions has a significant effect on the fit, and this also reduces the selectivity.
You said: “No wonder people have developed add-ons such as SOLVERAID and SOLVERSTAT, and even those have issues. Are you using any such add-on?”
I have tried several EXCEL SOLVER add-ins. None so far were useful because of various limitations, but I am still looking. As an example, it must allow circular references which are resolved by allowing multiple iterations. These circular references are embedded in the Vincenty range and bearing calculations, I also use them to advantage in the fuel model, because one must continually solve for the starting fuel load such that MEFE occurs at the correct time. I have found two techniques which help minimize the SOLVER convergence time. First, I solve for small deltas on top of nominal expected values. Otherwise, the initial steps SOLVER takes are generally far too large. Second, I linearize the objective function as much as possible. That means generally using a quasi-linear function (wherever possible) for each error component, as well as using a sum of absolute values of errors instead of RSS’ing them for the overall objective function.
You said: “I do not know why you consistently arrive at a heading of 180 degrees with your Monte Carlo simulations.”
I have never said that, nor have I ever tried it. What I said was that, at a fixed bearing of 180 degrees, the Monte Carlo simulations gave an expected value of the route probability of 50%, as it should. In fact, the bearing is indeterminate in Monte Carlo simulations. That is because the random BTO noise must be added to a large expected value for each BTO, and those expected values necessarily correspond to a particular assumed bearing. So, the expected value of the (best-fit) bearing, if it is allowed to vary in the Monte Carlo simulations, will simply be the assumed value used to compute the BTORs. In other words, you can’t find the route bearing using Monte Carlo method.
What you can find, in principle, is the statistical uncertainty in the bearing caused by BTO and BFO noise. MY attempts to solve for the bearing using SOLVER have been unsatisfactory. With the complex objective function I am using, and due to SOLVER’s limitations, I have not been able to get precise and repeatable bearing results, because they tend to track the initial guess. So, I hold the bearing fixed for each trial, and then I manually step the bearing from trial to trial. I see a similar effect with flight level and with the air speed setting. Thus, I have to run a great many trials, but this method assures I get complete convergence. Thus, I vary three of the route parameters manually (the 19:41 initial LNAV bearing, the speed setting, and the flight level). I use SOLVER to find the remaining route variables: the 19:41 latitude and longitude, and the four ranges along the geodesic to the next handshake time through 00:11. As a final step, I extend the route northward to an assumed starting time or latitude and southward to the 7th Arc.
I thought I would provide a brief status report to those still interested in alternative paths.
I considered the case where the offset from N571 was cancelled during the turn at IGOGU. The entire flight thereafter was a rhumb line on the initial azimuth from IGOGU to ISBIX (185.92T) and being part of a waypoint scenario. This is achieved, as has been suggested, by activating track hold with the reference being true North. The entire flight from 18:22 has been modeled as being at 41000ft and LRC using Barry’s spread sheet. I have hand entered the offset turn and the turn at IGOGU as part of the calculations.
The fit is excellent, but not much different than a 186T GCP. This should not surprise as the path is substantially meridional and the rhumb line and GCP are almost identical (at least from the point of view of defining a search area). One consequence of using the rhumb line is that it saves about 160kg of fuel with respect to the GCP, and on that basis could be said to be more likely. To reiterate, the fuel model assumes the same PDA for both engines, so I will have to do a hand computation for the last 10 minutes to provide a detailed forecast of the fuel exhaustion, and I will do it by tomorrow.
After completing the fuel computation, I will try to put together a revision of my recent paper that adds this result.
My continued interest in this path is motivated by:
a seamless join between the post and pre- 18:22 scenarios;
an excellent fit to both the BFO and the BTO data along the whole path;
a FMT that is sharply defined in azimuth and time space;
a simple waypoint route MEKAR+NILAM+IGOGU+ISBIX, with the last leg being converted to true track at IGOGU; and
sufficient fuel to reach the MEFE time and location.
In the past few days, I have connected with several pilots on PPRuNe who confirm that it is common for a pilot to do route planning and confirmation on oceanic legs by using the North reference and the track function.
The implication of adopting this route is that a pilot was in control as late as the turn at IGOGU.
If this work had been discussed 4 years ago, before the initial search had failed, I doubt that there would be any opposition. But the search has failed there, at 180T, and further North along the 7th arc, so why should this route be any less certain?
A recent discussion of the UGIB paper seemed to suggest that DSTG has not actually modeled the area south of about 37deg. Only a slight southern extension of the drift study area would obviate any objection on that basis.
@sid. Dstg probability distribution extended down to 39S.
@Sid Bennett
RE: In the past few days, I have connected with several pilots on PPRuNe who confirm that it is common for a pilot to do route planning and confirmation on oceanic legs by using the North reference and the track function.“
You really should stop exaggerating. There were only two responses to your question on PPRuNe. The first respondent didn’t understand the question and the second said something different.
[ https://www.pprune.org/tech-log/590746-fmc-track-bearings-versus-flight-plan-track-bearings.html ]
@Paul Smithson
Did it cut off abruptly at 37S as shown in H-1 of the UGIA paper? which comments that below 37S it is qualified by saying that “the uncertainty is higher”. If there is no useful data then it should be acknowledged or something other than zero ought to be shown since, the next lowest latitude bin is 100%. I had understood that the analysis was not focused on the region below 37S as it was not relevant to the hypothesis that the crash site was further North.
@Andrew
You should stop abusing me. 🙂
https://www.dropbox.com/s/4uxymacxmbdfr6g/92048165-777-MNPS-Oceanic-Guide.pdf?dl=0
Fortunately I downloaded this document as I can’t immediately re-locate it on the web.
See in particular 8.5.4.1
I have also found mention that some carriers prepare their oceanic routings giving headings in true and mag and have procedures such as the attached. Trying to do a survey of the percentage that do so would seem difficult, but the point is that pilots flying oceanic routes are likely to be familiar with the procedure.
Since no one knows what happened (yet) whether a route is plausible rests on a number of factors, and right now we differ on the weight to be given to each.
As Victor pointed out, setting the track using the true track mode is limited to integral 1 degree values by the display data entry granularity, so the same general approach would lead to a 186T track.
The track hold and true track paths are so similar that the only thing favoring one over the other is a slightly lower fuel consumption on the rhumb line.
I have also found mention that some carriers prepare their oceanic routings giving headings in true and mag and have procedures such as the attached.
You probably mean track, not heading.
As Victor pointed out, setting the track using the true track mode is limited to integral 1 degree values by the display data entry granularity, so the same general approach would lead to a 186T track.
What I said was using TRK SEL limits the selection to integral degrees, while TRK HOLD does not.
The track hold and true track paths are so similar that the only thing favoring one over the other is a slightly lower fuel consumption on the rhumb line.
It makes no sense to compare TRK HOLD with TRU TRK, as TRK HOLD can be referenced to either NORM (magnetic) or TRU. Do you mean to compare the LNAV (great circle) path with TRU TRK (rhumb line) path (either SEL or HOLD)?
A better question is, what are you trying to prove? We’ve known for years that a constant heading is followed after a route discontinuity in LNAV mode, and a TRU TRK path can be manually selected.
@Victor
As I have stated many times, my objective is not to abandon the 186T (nominal) path as a viable solution to the problem. Any one of the track alternatives with a true North reference is viable solution. We adopted the LRC 41000ft scenario so as to be more comparable with your study and calculate the fuel, and have recently adjusted the start point at 18:22 so that it can be argued that MEKAR+NILAM+IGOGU+ISBIX is a plausible base route for the flight.
But there is no concession by UGVA that it constitutes a viable candidate flight path.
You have chosen the DSTG study since it agrees with your hypothesis, rather than other studies which would have much less of a selective effect. But unless you are privy to data that is not public, your own paper admits that the drift study cannot answer the question for latitudes greater than 37.00000 deg. After all, we are only talking about a distance of 0.5 deg lower than the drift study data you present.
Perhaps you did not address it, but what is the latest time that your proposed path requires manual intervention?
@Sid Bennett: Even if we neglect the drift studies, our analysis suggests the LNAV180 path is preferred.
Your objective function is different than ours. Whether or not you agree with the methodology, the requirement that the satellite data show random errors increases our ability to discriminate among paths. Without that increased level of discrimination, many paths are possible. We all acknowledge that.
I tried to show the acceptability of a broad range of great circle paths in an article back in Oct 2017, where the initial track at 19:41 was fairly linear with the 7th arc crossing latitude, and BTORs and BFOs remained within reasonable limits over a range of paths.
@Sid
From my perspective, Victor asked DrB/Richard to resolve if there was enough fuel for your path. @DrB kindly did some checks, and admitted you found the “shoulder” of a sweet spot, which I interpreted to mean DrB agreed you found a 186T path to nominal 37S with approx 50% fuel probability. That resolved the insufficient fuel argument in your favor, more or less.
Assuming I am correct above on fuel, you can now focus on why else the 186T case does not rank as well? I can put it in my own words, which you may find hard to embrace. I have noticed 186T has almost perfect BFO fit out to Arc5. But my personal hypothesis (which is not exactly the same as DrB et al) is that BFO is actually drifting a bit during the flight. So I am not letting the *apparent* good fit of 186T to Arc5 on BFO sway me over to the dark side (yet).
@TBil
Thanks for the comments. My models give a good BFO fit at the 6th arc. One may quibble that I introduced a -100fpm descent at 00:11 anticipating a slight descent after loss of one engine. However, setting the descent to 0 changes the BFO error by only about 2Hz.
Your BFO model may differ. However, I did use my path model to check the UGIA LRC path on 180T from 19:22 and I had no problem with a fit. My quibble with the UGIA model is that it starts the leg at an arbitrary location and time that works, and then rationalized the path from 18:22 to that location and time.
The BFO IS drifting during the flight. In UGIA the BFO bias has drifted to 153.4Hz during the final leg. I have always used 154Hz based on different reasoning, which is of no consequence since we use the same value.
Off to a Zoom cocktail party. Tomorrow is another day…
@TBill, @Sid Bennett,
@TBill stated to @Sid Bennett: “@DrB kindly did some checks, and admitted you found the “shoulder” of a sweet spot, which I interpreted to mean DrB agreed you found a 186T path to nominal 37S with approx 50% fuel probability. That resolved the insufficient fuel argument in your favor, more or less“.
The Route x Fuel probability of our proposed flight path is 86.0%. The Route x Fuel probability to @Sid Bennett’s proposed flight path was 8.3%. The best Bobby could come up with, following a diligent search and after changing the flight level and the start point was 53.5%. That is not a finding in @Sid Bennett’s favour.
If @Sid Bennett does not believe us, then he should take a look at @sk999’s revised paper yesterday. Steve uses a completely independently model based on a least squares fitter. Steve does not incorporate GSEs and uses a Constant Mach 0.834 speed mode instead of LRC, but his result using a different objective function agrees 100% with our result. There is a clear peak at 34.3°S. The relative route probability for @Sid Bennett’s 37.4°S according to Steve’s analysis is around 2.0%.
@Sid Bennett has set himself up as the defender of the original IG end point in 2014, stating “I do not wish to abandon the IG original position as to the 6th arc intersection”. This refers to the first public statement from the IG, where we proposed a MH370 position at the 6th Arc of 36.02°S. That sounds so noble and laudable, but there is no sense of reality, when one denies the significant progress made over the last 6 years.
The IG issued four public statements in 2014. Both Victor and myself were signatories on all statements. The MH370 end points changed with each statement: 36.02°S, 29°S, 37.3°S and 37.71°S. Most of us, have come a long way since 2014 and Victor, myself and many other IG members (who were signatories to those pubic statements) no longer hold to a MH370 end point in the vicinity of 37.4°S.
Copies of all IG reports are available at the following links:
https://www.dropbox.com/s/7f3f245luy41xhv/Published%20IG%20Report%2017062014.pdf?dl=0
https://www.dropbox.com/s/01dpl980eg5eu7j/Published%20IG%20Report%2014072014.pdf?dl=0
https://www.dropbox.com/s/uc2mjccsfdozc9k/Published%20IG%20Report%2009092014.pdf?dl=0
https://www.dropbox.com/s/7j2w4zk2l26xp3o/Published%20IG%20Report%2026092014.pdf?dl=0
@Sid Bennett,
You said: “One may quibble that I introduced a -100fpm descent at 00:11 anticipating a slight descent after loss of one engine.”
I’ll quibble. That’s not how the autopilot works. Besides, you said you had not yet calculated the REFE time.
The combination of auto-pilot and auto-throttle will attempt to maintain the commanded Mach and the commanded Flight Level. The thrust from one engine is insufficient to do both. The aircraft will first slow down while maintaining altitude. When the speed reaches about 208 KIAS, the aircraft will begin to descend. There is enough single-engine thrust to maintain level flight at that maneuvering speed circa FL270, but the left engine will run out of fuel before that altitude is reached.
The bottom line is that, as Mike Exner showed way back when in a simulator, it takes several minutes for the speed to decay to the point where a descent will occur. During this deceleration period, the ROD is zero. When the deceleration begins, circa 00:14-00:15, the ROD will be quite a bit larger than 100 fpm. So, without pilot action, there can be no 100 fpm ROD, as you assume.
@Sid Bennett
I apologies if my language was indelicate; it wasn’t intended as abuse.
With the greatest respect, you are conflating two related subjects which have an important difference. The document you downloaded and the discussions you have referenced are all related to operations in MNPS oceanic airspace across the North Atlantic. There are specific procedures in place for such operations because of the high traffic density, closely spaced routes, and the large number of loss of separation incidents where pilot error was a factor. Some operators (eg Etihad) obviously do require their pilots to select the heading reference to TRUE while operating within North Atlantic oceanic airspace. However, many do not, as shown by the following PPRuNe discussion on the subject: https://www.pprune.org/archive/index.php/t-61635.html .
Operations in other oceanic areas are a different matter entirely. I operated B747 and B777 aircraft across the Pacific and Indian Oceans for many years. In my experience, there was NEVER a requirement to use a true heading reference while operating in those areas. The notion that pilots routinely use a true heading reference in all oceanic areas is, quite simply, WRONG.
@DrB and Sid,
Just to clarify . . .
Mike’s simulator result showed that the speed decay commenced almost immediately the first engine fails. The deceleration was observed to be linear at about 18.9 knots per minute. No altitude was lost in the simulation before the second engine failed, because the speed at that time was still above the level flight manoeuvring speed. Descent commenced very shortly after the second engine failed.
I recall that there was originally some indication from the 00:11 BFO that there may have been a gradual descent in progress at that time, perhaps 100 fpm.
@Brian
Yes.
@DrB. De-pressurisation. Thanks for your response. You conclude, “…we can’t distinguish between the air packs never being on after 17:26 and them being on for only an hour or so.”
After 17:26 if they were not on, even for just an hour and maybe for all the time to beyond the final turn, do you think for that finding to be seen as realistic, an explanation is needed as to how he would not be overcome by the cold in an hour or even over two, packs off?
Ambient temperature would be around -50˚C, allowing for some variation from ISA.
@David, @DrB, @TBill: I think it’s not easy to determine how long it takes for the thermal mass of the airframe, contents, and cabin air to cool with aircon packs off and outflow valves open. My guess is if the pilot wanted to survive the initial depressurization with limited discomfort and also provide manual inputs, it would not be the chosen configuration. The aircon packs on with outflow valves open is an interesting possibility for 17:21 until the air packs were later turned off.
@Brian Anderson,
You said: “I recall that there was originally some indication from the 00:11 BFO that there may have been a gradual descent in progress at that time, perhaps 100 fpm.”
Based on what? The 180 degree route has a BFOR at 00:11 of -1.7 Hz with a zero ROD. You don’t need a non-zero ROD to fit the BFO data within its expected noise and drift, and no one has proposed a method by which such a small BFO shift could be created. To be kind, picking an arbitrary ROD to force the BFOR to zero has been relegated to the dust bin of history.
@David, @DrB, @TBill: Another possibility is aircon packs off and outflow valves open to accelerate the initial depressurization, but then aircon packs on (with outflow valves open) to provide some heat.
@Victor Iannello,
@David,
Victor said: “The aircon packs on with outflow valves open is an interesting possibility for 17:21 until the air packs were later turned off.”
If the passengers and other crew were incapacitated for the remainder of the flight, and in less than an hour, by simply opening the outflow valves, then why would anyone shut off the air packs later? I don’t think it was to conserve fuel, since the airspeed was not selected to do that. Perhaps it was to commit suicide, but that could be done by simply leaving the outflow valves open. So, I can’t see a good reason to shut off the airpacks, for the first time, after 18:24.
I can see the scenario in which the air packs were turned off and the outflow valves were opened circa 17:26 (or several minutes before then). By 18:24 the pounding on the door had ceased, and the flight deck had grown uncomfortably cold. Closing the outflow valves and turning the air packs on then would warm the flight deck and allow normal breathing within maybe 10 minutes or thereabouts. That would assure the upcoming maneuvers (a descent, multiple turns, and a climb) to be successfully carried out as planned. Once that was done, no additional pilot actions were needed. Then, circa 19:41, the air packs could have been turned off, but possibly the outflow valves were not opened. In that case, the cabin pressure and temperature would decline more slowly. Perhaps that was desired as a gentler means of suicide.
Our fuel modeling indicates that the air packs were off for many hours, but it can’t tell us when that occurred, nor can it tell us the state of the outflow valves.
“To be kind, picking an arbitrary ROD to force the BFOR to zero has been relegated to the dust bin of history.” That’s a bit rich, considering the treatment of 1840 BFO.
@DrB said:I don’t think it [turning off the aircon packs] was to conserve fuel, since the airspeed was not selected to do that.
The selection of LRC speed demonstrates that both range and time were considerations, which is why neither Mmo nor MRC speeds were selected. On the other hand, aircon packs off would increase range with no time penalty.
@Victor
“I think it’s not easy to determine how long it takes for the thermal mass of the airframe, contents, and cabin air to cool with aircon packs off and outflow valves open.”
I agree, not easy to estimate. For MH370 the only way we would know cabin cooling versus time would be if Boeing or somebody had a model or data for it.
For chem plant safety, sometimes for risk studies we have to complex model hypothetical failures, re: how low the temperature vs.time in consideration of heat exchange from equip/surroundings.
Clearly many MH370 observers are thinking instant cool down, but that’s only the rarefied air in the cabin, which will warm back up and is low mass.
@paul smithson,
You said: ““To be kind, picking an arbitrary ROD to force the BFOR to zero has been relegated to the dust bin of history.” That’s a bit rich, considering the treatment of 1840 BFO.”
If you are referring to what others have done in the past to match the 18:40 BFOs, sometimes they simply adjusted the ROD during a descent or the bearing of a turn prior to the phone call to exactly match the BFOs then.
We did neither. Our Figure E-3 shows a non-zero mean BFO error at 18:40. In our FMT Route, the ROD is determined by descent data from prior 9M-MRO flights. A turn DIRECT TO IGOGU is needed before reaching IGOGU in order to remove the lateral offset and to match the 19:41 location predicted by the SIO Route fit on time. We did that and the result was a close, but not exact match to the 18:40 BFOs.
Please tell us what you find “rich” about what we did?
As I am on the tail end of the time zones (except for airsealandman), I get to respond to a tsunami of posts, and will try to do so in summary. If I omit to comment on something, I missed it. I try not to ignore comments and suggestions.
@Andrew(8:53pm) I accept that that is your professional experience, but it appears that there are different practices. I was able to find that particular procedure on line, but such documentation is hard to access.
Did you ever use TRUE in you flights over oceans, whether it was required or not? If you did, for what purposes. (This is just to help me understand the operational aspects. I do not expect this to be resolved, short of finding the plane.)
@DrB (8:09pm) As for the -100fpm ROC, it has been there from the beginning in my spread sheet. Since it makes no difference in the result, I left it in so as to avoid to temptation to fine tune fittable values by adjusting constants. The comment was made in response to a specific query and you agree that it makes no difference. In future publications I will set the ROC at 00:11 to 0 furlongs/fortnight^2
@paul smithson (9:33AM) Right on!
(11:59) Can you provide a link to the document?
@Richard (7:22pm) You cite to a sk999 paper on covariance analysis. However as I read it it only analyzes a path that starts at your coordinates for 19:41. No wonder it does not reach other than 180T with any reasonable probability. If I have misunderstood, please correct me.
As for the series of IG papers, thanks for posting link. One of the documents shows a map of several of our predicted points. I cannot remember which one is mine.
@DrB
I believe that you misapprehend the history of the FMT.
It was coined by an IG member to indicate that there was probably a single turn to the SIO at some time after 18:22.
We (Geoff Hyman and I) did a study where the plane flew along N571 and turned south at an arbitrary time and flew on a simple rhumb line path to a 00:11 intersection with the 6th arc (if memory serves). There was no fuel constraint and while a fixed altitude was used, the M was adjusted for the best azimuth fit for each turn time.
Subsequently the best azmuith fit at the most likely turn time was determined, including the probability distribution. That was publicly documented and a link to it is:
https://www.dropbox.com/s/b9pstmt1crrp1a1/Preliminary%20Research%20Note%20041120.docx?dl=0
It was observed that the parameters suggested that the turn was near to IGOGU and that that waypoint became a shorthand identification of the FMT, not the other way around.
Subsequently (some time later in my case) I noted (as others did) that the path closely overflew ISBIX (Interestingly, one may get some insight into Barry Martin’s reasoning as one of the things he introduced in the model was the miss distance to ISBIX) . Until recently I have qualified the overflight as “coincidentally” as in played no part in the simulations.
More recently, as I tried to sort out the modalities of the cockpit scenario at and after the FMT, I have been using ISBIX as originally stated (coincidentally) or as a waypoint, depending on the scenario. My studies address the whole path from 18:22.
In the recent past, being convinced to adopt your hypothesized LRC model and finding that it also gave a good fit provided I selected 39000 or 41000ft, I redid the study. By introducing the LRC the study now has a defacto fuel model, since the speed is essentially a fixed program, and the BTO errors account for the along path winds.
I posted that recently and it merely confirms the earlier study but with a much narrower peak at 186T. There is no assumption that it is a waypoint path. But it seems to have some interesting coincidences. What did Sherlock say about coincidences?
https://www.dropbox.com/s/b9pstmt1crrp1a1/Preliminary%20Research%20Note%20041120.docx?dl=0
@Sid Bennett said: What did Sherlock say about coincidences?
“People say there’s no such thing as coincidence. What dull lives they must lead.”
That’s probably not the quote you were referring to.
@Sid Bennett
You stated: “@Richard (7:22pm) You cite to a sk999 paper on covariance analysis. However as I read it it only analyzes a path that starts at your coordinates for 19:41. No wonder it does not reach other than 180T with any reasonable probability. If I have misunderstood, please correct me“.
Steve’s paper runs various tests, with between 200 and 1,000 simulations, with start latitudes between 5°N and 1°S and stepping through initial bearings from 173° to 186°.
@Richard
I will not write while Ed´s answer is not here. It would be better.
@Sid Bennett
RE: ”Did you ever use TRUE in you flights over oceans, whether it was required or not? If you did, for what purposes.”
I have only ever selected TRUE to demonstrate the effect of the switch to trainee pilots. The switch was selected to TRUE for maybe a minute or two while we discussed the various effects on the displays and FMC, and it was then re-selected to NORM. I have never used it for the purpose you described, even while crossing the North Pole.
The document you found is Chapter 8 of Etihad’s Supplementary Operations Manual. It is entitled “North Atlantic Oceanic Procedures”. The procedures it contains are specific to North Atlantic oceanic operations, not oceanic operations in general.
@Richard, I don’t understand all of the details of sk999’s paper, but the concluding sentence doesn’t sound to me like the ringing endorsement that you imply.”Thus, the overall conclusion of this paper – that a strong correlation in the start parameters means that the final 7th arc latitude is not well constrained – remains unchanged.”
I’d be interested to hear further technical debate between sk999 and DrB on the discriminatory power of novel analyses of the sat data.
@Richard
The paper is not on point unless one of the cases starts where the 196t path from IGOGU passes through it. I consider a study as you have done and Sk999 has done to be a survey of potential path fragments that seem to be worth further investigation. You have chosen to investigate one of them.
The approach to selecting a path to study that we have taken aims to find a path from at least 18:40, and preferably from 18:22, and there is no doubt that it exists and is highly probable.
All that sk999 study proves is that starting at the starting points and time in his study, reaching the 37.5S or so intersection is unlikely. No surprise there.
@Sid Bennett
You stated: “As for the series of IG papers, thanks for posting link. One of the documents shows a map of several of our predicted points. I cannot remember which one is mine“.
If you are referring to the map entitled “Cluster of 5 model results as of 2014-06-17”, included in the first paper, the points marked A and B were from Brian, point C from Victor, point D from myself and point E from yourself.
Your point was the furthest North at 34.7534°S 88.1951°E and your flight route was entitled “Variable Air Speed and Heading; Elevation Angle and Doppler best fit“. Your “Turn South” (as we called the FMT back then) was at 18:25, at which time you calculated the position of MH370 as 6.10°N 96.09°E.
Brian’s points (with 2 different Ground Speeds) were furthest south because his FMT at 19:01 was further south at a position 4.70°N 94.75°E.
Victor’s point was at 36.65°S from a FMT at 18:28 at a position 6.64°N 96.20°E.
My end point was at 35.41°S from a FMT at 18:39:55 at a position 6.85°N 95.06°E.
@sid. What’s the point? The aircraft isn’t there (they looked).
@Andrew
A basic question: if you select NORM and use heading instead of track, isn’t that “just” affecting the readings? Do you really navigate on those when crossing oceans or polar regions? It seems very impractical and old fashioned.
@Sid Bennett,
You said: “I believe you misapprehend the history of the FMT.”
You are wrong on that, too.
I am willing to respond to questions or suggestions of substance from anyone. On this point you are wasting people’s time.
@Victor, DrB, TBill. My 4th de-pressurisation option for Z was, outflow valves open, packs off, “…….followed by packs back on, on reaching his cabin altitude target.”
If he was uncertain that leaving the packs on would make little difference to de-pressurisation rate, this possibility (addressed by Victor also) would be the likely choice.
Cabin altitude would reach a 25,000 ft in about 7 mins, where hypoxia would set in 3 mins later. If then or later he selected the packs back on for warmth, from TBill’s simulation the cabin altitude would continue to rise, so he would leave them on.
Banging on the door might be brief since by the time the co-pilot (if there) and passengers became aware that the turn and decreasing cabin pressure were nefarious there would be little time for that. Cabin oxygen masks would drop in about 2 mins and at that point access to an oxygen supply and crew helping passengers with their masks would be a priority. Lighting might be dimmed.
At 10 mins cabin movement would have ceased. The aircraft would continue cooling and selecting the packs on as it did so would help with that, enough presumably to continue with a raised cabin altitude for some time. However with that rising still, Z would find his breathing becoming more laboured so when any cabin resistance was out of the question he might close the outflow valves while continuing to the FMT.
Cabin altitude being restored he could remove his mask for that and as DrB says, for navigation.
After the FMT he might just repeat the earlier again, this time not donning his oxygen mask after opening the outflow valves. DrB, if he did not open them the cabin altitude rise rate due to leakage, that TBill found was about 100 fpm (though aircraft vary), would take a while. If he passed out at 16,000 ft, from say 7,400 ft that would take 86 mins so that might then prompt his opening them again.
I think the above speculation addresses some points you make DrB. If that does present a reasonable sequence, the likelihood of the packs being off for a brief period in the initial depressurisation, possibly only 10 minutes, could be addressed as a sub-set in the paper.
If you do something once, people will call it an accident. If you do it twice, they call it a coincidence. But do it a third time and you’ve just proven a natural law!
Grace Hopper
@sk999,
I am of the opinion that the 19:41 BFO is affected by a small ROC (about 400 fpm) from a nearly completed climb ending very soon after 19:41:03. It seems to be an outlier. The stability of the 20:41-00:11 BFORs does not indicate a large bias change from the time at the gate or a large ongoing drift, so those effects don’t appear to be causing the odd 19:41 BFOR. Perhaps it is due to the tail end of the climb.
You might try eliminating the 19:41 BFOR from your metrics, including the 1-hour deviation of the BFORs and the correlations of the BFORs with BTORs and with time. Perhaps a corrupted 19:41 BFOR is contributing to the unusual shape you saw in your Figure 6 for the correlation of the BFORs w.r.t. the BTORs.
@Niels
RE: ‘A basic question: if you select NORM and use heading instead of track, isn’t that “just” affecting the readings?’
Essentially, yes; the heading reference switch affects the reference (ie magnetic north or true north) used for the display of aircraft heading (and track) on the pilots’ displays. It also affects the reference used by the autopilot and the FMC.
RE: ‘Do you really navigate on those when crossing oceans or polar regions? It seems very impractical and old fashioned.’
No, the aircraft is typically flown with LNAV engaged, in which case the autopilot follows steering commands provided by the FMC. The FMC navigates a great circle path between waypoints; the navigation performance is not affected by the position of the heading reference switch. The most important thing that pilots MUST do to prevent a gross navigation error (GNE) is to check the full latitude and longitude coordinates of any non-database waypoints entered in the FMC against the ATC clearance.
While operating across the North Atlantic (NAT), airlines normally require their pilots to also check the track and distance to the next waypoint each time they pass a waypoint, in accordance with the guidance in ICAO’s North Atlantic Operations and Airspace Manual. That additional procedure is a gross error check, intended to help prevent GNEs in NAT airspace, the busiest oceanic airspace in the world. Some airlines (eg Etihad) also require their crews to select a true north heading reference while operating in NAT airspace, because of the large magnetic variation. That makes it easier for the pilots to check the aircraft’s track against the ATC route clearance, but it does not affect navigation in LNAV mode.
@Victor, DrB, TBill. Disambiguation. My fourth last line above is clearer when amended to, “..that would take 86 mins and that prospect might prompt him to open them again.”
@Andrew
Thank you, very interesting explanation!
In the context of the ongoing discussion:
So for navigation over long distance the SOP is using great circle segments connecting waypoints, which is in essence True Track type (varying bearing). Isn’t the CTT mode the “next” option, if you have a navigational “target” over rather long distance and would not want to use waypoints?
@Niels: Why would a pilot not use LNAV with a custom waypoint in that circumstance?
@VictorI
Good question. Perhaps depending on what the navigational “target” was (direction or location based) and how precisely it was defined?
@Niels
Let’s say you wanted to navigate from point A to point B. You could enter the two points as waypoints in the FMC and allow it to navigate via a great circle path in LNAV mode. An alternative method would be to plot the two points on a mercator chart and determine the true track angle, or course. You could then fly a rhumb line track between the two points by selecting the track angle in TRK SEL mode, with the heading reference selected to TRUE. I know which method I’d rather use!
If you simply wanted to fly a constant true track from your current position, you would also need to select the track angle in TRK SEL mode, with the heading reference selected to TRUE.
@Andrew
“If you simply wanted to fly a constant true track from your current position, you would also need to select the track angle in TRK SEL mode, with the heading reference selected to TRUE.”
That seems a rather trivial action in the light of all the apparent “non-standard” aspects of the diversion.
It is difficult to know the navigational objective without knowing the exact intent of the person in control.
@Niels,
You asked: “A basic question: if you select NORM and use heading instead of track, isn’t that “just” affecting the readings?”
To which Andrew replied: “Essentially, yes; the heading reference switch affects the reference (ie magnetic north or true north) used for the display of aircraft heading (and track) on the pilots’ displays. It also affects the reference used by the autopilot and the FMC.”
Of course, the actual paths followed by the aircraft over time will generally be different if heading is held constant by the auto-pilot, rather than the track angle being held constant. This path difference occurs regardless of whether the reference is NORM or TRUE. In the constant heading mode, changes in cross-track winds will cause the constant-heading path to differ from the constant-track path. For the MH370 SIO Route, this difference is quite large at the 7th Arc because of the easterly wind shifting to westerly during the route.
@DrB
Sure I understand. The discussion with Andrew was in the context of “standard” long distance navigation.
@Sid Bennett
You misapprehend and misconstrue the history of the FMT.
You stated, that in your attached study: “It was observed that the parameters suggested that the turn was near to IGOGU and that that waypoint became a shorthand identification of the FMT, not the other way around”.
The manoeuvre, which became known as the Final Major Turn (FMT), was not coined by you and Geoff in your study dated 17th March 2015.
The link to your “publicly documented” evidence entitled “Preliminary Research Note” is dated 12th April 2020. That is hardly evidence, when it is written 5 years later.
Here is the correct link to the original document you wrote, entitled “Further Studies on the Path of MH370: Turn time and final azimuth” dated 17th March 2015:
https://www.dropbox.com/s/o35e28vrrszusfy/Sid%20Geoff%20Study%20Turn%20Time%20and%20Azimuth%2017MAR2015.pdf?dl=0
The FMT was never defined as a “single” turn nor defined as being “near to IGOGU” or “passing waypoint ISBIX”. The FMT was simply defined “as the turn to the SIO, which we call the FMT”.
The term FMT was first coined by Geoff over a year earlier on 10th June 2014 in an email discussion with Brian.
Let me tell you the factual history of the FMT and its derivation from the BTO and BFO:
(1) Inmarsat – 15th March 2014 – Arc published with last known possible position of MH370 north and south of last radar contact, implying a turn after contact was lost.
(2) Duncan – 5th April 2014 – Full set of Arcs published, constraining the turn after contact was lost and possible flight routes.
(3) Inmarsat – 7th April 2014 – BFO analysis indicating “Possible Turn” at 18:29.
(4) Victor – 13th April 2014 – LOS flight routes both North and South with turn at 18:29.
(5) Mike – 15th April 2014 – BFO analysis showing southern track match to L-Band predicted doppler.
(6) Richard – 16th April 2014 – Flight model V1 for northern route with turn at 18:29.
(7) Richard – 18th April 2014 – Flight model V1 for southern route with turn at 18:29.
(8) Victor – 24th April 2014 – Flight model for northern and southern routes with turn at 18:29.
(9) Mike – 26th April 2014 – BFO full calibration, AES compensation, ROC, track and turn calculations from BFO.
(10) Richard – 5th May 2014 – “Turn Point” at 18:39:55 at a position of 6.85°N 95.76°E.
(11) IG – 16th May 2014 – Birth of IG (then called “The BFO Group”) with Duncan, Mike, Don, Rand and Richard.
(12) Yap – 24th May 2014 – Flight path with turn at 18:27:18 based on BTO, BFO and Duncan’s satellite ephemeris.
(13) Inmarsat – 28th May 2014 – Raw satellite data (signalling unit log) for MH370.
(14) Mike – 28th May 2014 – Deriving net L-Band propagation delay and range from BTO values.
(15) IG – 5th June 2014 – Extension of the “The BFO Group” including Victor, Brian, Curon, Bill, Tim, Barry M., Sid and Geoff.
(16) Brian – 5th June 2014 – Turn defined as having been completed by 19:01.
(17) Don – 6th June 2014 – Flight path using BTO and BFO interpretation from Inmarsat Signalling Unit Log with “Turn South” at waypoint LAGOG.
(18) Barry M. – 7th June 2014 – Flight path model first published with turn at 18:40.
(19) Tim – 7th June 2014 – Clarification that “Possible Turn” at 18:28 was a SDU reset.
(20) Duncan – 9th June 2014 – Discovery of the “Perth North” error in the ground station.
(21) Geoff – 9th June 2014 – Point of closest approach of MH370 to the Inmarsat satellite.
(22) Brian – 9th June 2014 – Fitting the 19:01 point to the point of closest approach.
(23) Geoff – 10th June 2014 – Definition of the “Last Major Point”.
(24) Brian – 10th June 2014 – Fit of 19:01 “Virtual Point” to “Last Major Point”.
(25) Geoff – 10th June 2014 – Definition of the “Final Major Point (FMT)” between 18:27 and 18:45.
(26) Brian – 10th June 2014 – Flight path and GS calculation based on FMT and point of closest approach.
(27) Victor – 12th June 2014 – Cross check and confirmation of BFO model with Yap and Henrik.
(28) Brian – 13th June 2014 – BTO Offset correction updated.
(29) Yap – 13th June 2014 – Discovery of Burum as ground station location for pilot generator.
(30) Barry M. – 14th June 2014 – Cross check with Victor on the “Perth North” correction.
(31) Victor – 14th June 2014 – Confirmation of C-Band calculations and “Perth North” correction based on Miteq documentation. BFO model is final and complete.
(32) IG – 17th June 2014 – BFO group renamed the Independent Group.
As you can see the definition of a MH370 flight path and the FMT derivation from the BTO and BFO data was a collective effort with at least 16 contributors and probably many more. The FMT has been variously called the “Possible Turn” (Inmarsat), the “Turn Point” (Richard), the “Turn South” (Don), the “Last Turn” (Geoff), the “Final Turn” (Brian) and the “Final Major Turn” (Geoff).
Geoff coined the term FMT, not you! Many others have helped to derive the FMT from the BTO and BFO data. More recently, in our paper, we have defined a FMT route, that matches not just the satellite data, but also the aircraft performance data, fuel data and weather data. Our FMT route finally clarifies the reason for the discrepancy in the BFO data at 19:41. Our FMT route also matches the radar observations on N571 and lack of radar observations during the FMT. Coincidentally, it also matches an eye witness account, supported by GPS position and timing data, of a large low flying aircraft.
You are the one who is misapprehending and misconstruing, but then have the impertinence to falsely accuse Bobby of misapprehension.
@DrB
@sk999
I agree 19:41 point may be maneuver/resolving. However, part of my departure I would say the same uncertainty applies for Arc6 at 00:11.
Another way to say this, my mental version of Report Figure F-1 (BFOR vs. Time) is that the BFOR trend line has a downward trend during the MH370 flight, which is evident if one colors in Red both both points (19:41 and 00:11) suggested to be outliers. This is the crux of MH370, the way I currently see it.
@Richard
I apologize for posting the link twice. I had intended to post the link to the paper that I put in my dropbox.
For the record, here it is:
https://www.dropbox.com/s/x0azia9qnfwmdg4/MH370%20_%20Bennett-Hyman.pdf?dl=0
Thank you for setting the record straight. But, please give me a point cite to a reference wherein I claimed to have originated the term Final Major Turn(FMT). As you have so thoroughly documented, while there was an identification of the event and energetic discussion of the meaning of it at the time it was indeed my collaborator at the time who coined the term FMT which was adopted fairly quickly at that time to describe the situation in our argot.
I recall stating that it was coined by a member of the IG, and that is a fact. It was Geoff. In any event, I regret the vehemence of your response.
At the time, the IG was coalescing on Duncan’s blog and eventually became an email list where it was truly a collaborative effort. Many people contributed to our understanding of the problem. But, now, when there appear to be several strongly held public positions as to the path, it would serve us well to concentrate on factual issues.
I will address one of them as soon as I have breakfast.
@TBill,
You said: “I agree 19:41 point may be maneuver/resolving. However, part of my departure I would say the same uncertainty applies for Arc6 at 00:11.”
Please provide any plausible cause of a climb or descent ongoing at 00:11, other than manual piloting. I am not aware of any.
It cannot be due to the right engine running out of fuel considerably prior to 00:11, and the aircraft decelerating to minimum maneuvering speed, and therefore triggering a descent, prior to 00:11. As we have shown in Table D-1 in our paper, the worst case time difference between REFE and LEFE/MEFE is about 6.5 minutes. That puts REFE at 00:11:00 at the earliest, and a descent could not have begun until circa 00:14:30.
DrB said:
“The stability of the 20:41-00:11 BFORs does not indicate a large bias change from the time at the gate or a large ongoing drift, so those effects don’t appear to be causing the odd 19:41 BFOR. Perhaps it is due to the tail end of the climb.”
At UGIA G.9, para 9
9. The average BFOR is -3.3 Hz. It seems likely that the BFO Bias, primarily the OCXO reference frequency, has drifted several Hz upward from 150 Hz at the beginning of the flight. That might have been increased due to being cold soaked circa 18:24, or it could be just the normal drift with time. The BFO Bias needed for zero average BFORs during the SIO Route is 153.2 Hz, and perhaps about 152 Hz if one discounts the 19:41 BFOR as being influenced by an ongoing climb.
@Richard
Can I ask which value was used in the calcualtions? 150 or 153.2 or perhaps 152? There seems to be a difference of opinion.
sk999
Have you studied, at 19:41, LRC at about 41000ft, a location at 93.5796E, 0.6277S with an azimuth of 185.89 (GCP or rhumb line should make little difference)?
@paul smithson
You ask why the 186T path end point should be searched again. You may well ask the same question of the 180T path and any of the locations searched by OI.
At the time we wrote the paper, there were three reasons why the 37.5S path was dismissed:
1. Statistical match with the satellite data with the additional requirement that measurement errors that should be random are not correlated.
2. Insufficient fuel.
3. Bad match to the timing and location of recovered debris.
At this point, Bobby concedes that (2) is no longer a limiting constraint if the path was sufficiently high (FL410) and the aircon packs were turned off for a long period of time (which also eliminates the possibility of a controlled glide after fuel exhaustion).
Some here feel that the evidence for (3) is not strong enough to consider in the same light as (1) and (2).
Bobby is also doing additional work to better integrate the satellite data constraints with the fuel constraints, and this may or may not affect the uniqueness of the LNAV180 path.
So far, @sk999 is the only other contributor I’ve seen that has looked at the correlation of the measurement errors of the satellite data. His conclusion is that the LNAV180 path is not unique, although his statistical criteria and methods are a bit different than what Bobby has proposed.
I think there is value in understanding why Bobby and @sk999 are looking at the same data and coming to very different conclusions.
I don’t think there is much value in continuing to justify the 37.5S position without a discussion of the merits or shortcomings of the newer statistical criteria. We’ve known for years that there is an adequate fit to the BTO and BFO error, and the path requires only one turn. We had already had that discussion in 2014.
@Sid Bennett
I thought you wouldn’t like hearing the truth.
You prefer to rewrite history and have tried once again to lead the readers of this blog astray.
Andrew caught you out before, now I have caught you out again.
Unfortunately the commenters here are too clever to fall for your continued ploys and fallacious arguments.
@Victor
I appreciate your comments.
With respect to fuel, I believe that the air packs were turned off for the hour period prior to 18:22. There would also be some minor savings due to lower electrical power demands during that period and perhaps for the entire flight as passenger services seem to have been suspended.
I would like to understand point 1 more thoroughly. What is the best paper for me to read?
You state that the 37.5 path was under discussion in 2014. I agree. I don’t have clear recollection of when I started to contribute path estimates based on Barry’s model. Perhaps Richard can remind me.
But, my recent posts have been prompted by your rejection of the 37.5 hypothesis. Any “refinements” are inconsequential, but represent my improved understanding of the scenario based on the years of work of this group. I am particularly happy that I took the time to run the LRC cases so as to provide direct comparability.
@Sid Bennett: In addition to the most recent report, a previous blog article provides a good summary of Bobby’s methodology.
A simple (but not sufficient) test of a path is to calculate the correlation coefficient of the BTORs (2nd – 6th arcs) with time using Excel’s CORREL function. If the errors are random, there should be little trend with time.
@Victor
The link references a recent post on this thread.
@Sid Bennett: The link is fixed.
@Sid Bennett,
You said: “Can I ask which value was used in the calcualtions (sic)? 150 or 153.2 or perhaps 152? There seems to be a difference of opinion.”
There is no “difference of opinion.”
The BFO Bias we used in our paper for all BFO calculations is 150 Hz, as specifically indicated in Section F.3. This is for channel R4 data. For C6 data we add 1.0 Hz to the raw BFOs, for R8 we subtract 3.3 Hz, for R10 we subtract 1.5 Hz, for R11 we subtract 1.2 Hz, and for T8 we subtract 4.4 Hz.
We do not adjust the BFO bias to force the mean BFO for the SIO route to be zero, but, if we did that, a bias of 153.3 Hz is needed when considering the 19:41 – 00:11 BFOs and 152.5 Hz if excluding the 19:41 BFO.
Ther average BFOR from 19:41 to 00:11, as shown in Table G-1, is -3.3 Hz. The 19:41 BFOR is by far the most negative, being -6.5 Hz. Excluding that one BFOR at 19:41, the average BFOR from 20:41 to 00:11 is -2.5 Hz. Both averages are consistent with the 150 Hz BFO BIas calibration at the KLIA gate and allowing for typical OCXO frequency drift, but less drift is indicated if the 19:41 BFO is excluded.
@Victor,
You said: “I think there is value in understanding why Bobby and @sk999 are looking at the same data and coming to very different conclusions.”
Actually, our conclusions (so far) are the same.
sk999’s plot of probability versus bearing assumes a constant Mach and a constant flight level. With the values he used, the peak probability occurs at 180 degrees.
If Steve had assumed a different air speed, the peak probability would occur at a different bearing than 180 degrees.
My route probability curve allows the air speed and flight level to be optimized at each bearing. Steve did not do this in his example. That is why his PDF cuts off several degrees away from 180 degrees, and mine does not.
To a good approximation, the “central peak” at 180 degrees bearing in my route probability is nearly the same function as what Steve calculated. It is about 2 degrees wide, and the two curves closely resemble one another.
What is required to prove bearing uniqueness is to detect the unusual features at exactly 180 degrees, which are shown in our Figure 19. This requires (1) use of the complete objective function including all the correlations involving BTORs, BFORs, time, and along-track position errors, (2) a very accurate 4-D interpolation of GDAS weather data, (3) a variable Mach schedule for LRC from Boeing, (4) use of the 3 conditions on the GSEs during the route fit, and (5) sampling the bearing in steps no larger than 0.04 degrees.
None of these five requirements are met in Steve’s most recent calculations, so his result cannot be expected to display a unique signature feature.
So far, I see no inconsistencies between what I did and what Steve has done.
@DrB: sk999 says that “a strong correlation in the start parameters means that the final 7th arc latitude is not well constrained”.
I am trying to reconcile this statement with your results. If they agree, perhaps I am not understanding @sk999’s results.
@sk999: Can you please list the exact list of inputs that were allowed to vary to create Figures 5 and 6? Also, what you refer to as “heading” is probably “track” or “course”.
@sis. “You ask why the 186T path end point should be searched again. You may well ask the same question of the 180T path and any of the locations searched by OI.” I do.
@Paul Smithson
With regard to at least 186T and 180T, the “exact” location of the MEFE is predicted. Previously the probability density function was used to define the search area. Each of the two endpoints is proposed as a central location with respect to which a search area is defined that extends well outside the previous search areas.
In addition I recall that there was never an expectation that there would be greater than a 90% chance of finding the plane during the initial search.
@Sid. I don’t think there would be much of an appetite for starting over as if a seabed search had never happened. I’m unconvinced that the dstg hotspot merits re-searching, which is essentially what you seem to be suggesting.
Victor,
“Heading” should, indeed, be read as “start track” at 19:41 (and since this is LNAV mode, it even more specifically refers to a “course”,) so it can vary along the path but is a specific path on the ground. The actual air heading at the start is different.
Start “track” is fixed at tabulated values. A complete list of parameters that are othewrwise varied (in the format that I use as input to my code):
#Start parameters at 19:41
param Long 93.7 30 1.
param Lat 2.78 30. 1.
param Mach 0.834 0.3 0.01
param FL 19.2 .2 .1
param Offset 149.7 2.3 1.
#Winds at starting at 20:43
param Nwind2 0. 2. 8.
#Winds starting at 21:43
param Nwind3 0. 2. 8.
#Winds starting at 22:43
param Nwind4 0. 2. 8.
The name of the parameter is arbitrary. The first value is the “seed” value to the iterative least squares and is also used as a “prior” (i.e., as if we had measured it independently). The second value is the “standard deviation” for the prior, used as a weight in the least squares. If it is large, (e.g., 30 degrees for start latitude) it means that the prior is “diffuse” (i.e. has little weight in the solution) and is simply there to keep the least squares from going off into nonsensical areas. The third value is the increment used for computing partial derivatives numerically. The “Nwind” parameters are the North/South components of winds relative to the nominal GDAS values; these are basically equivalent to the along-track GSEs. I do not include one for the 1st leg since I figure one could vary the ground speed for this leg with the Mach (and FL) parameters. FL (flight level) is actually the index used in the GDAS file to designate pressure altitude. Thus, FL=19 corresponds to 200 mbar (about 38,600 feet ISA.) I put a tight constraint on it as a way to keep it from getting too large (i.e., solution does not go to altitudes higher than the limit for a B-777.) Offset is the fixed frequency bias. I put a 1-sigma limit on it of 2.3 hz based on the observation that the difference between at-the-gate values of the FFB and in-flight values for the admittedly limited set of flights at our disposal are between 0 and +/- 5 hz.
I caution that Figures 5 and 6 should not be taken as gospel. Small variations on assumed inputs (e.g., deleting the 19:41 BFO as Bobby Ulich suggested as a trial) do modify the shapes of the curves noticeably. (For the record, deleting that BFO did NOT have a big impact on the shape of the BTO/BFO correlation – that shape is driven by the later points.)
Hope that helps.
Sid Bennett –
You asked, “Have you studied, at 19:41, LRC at about 41000ft, a location at 93.5796E, 0.6277S with an azimuth of 185.89 (GCP or rhumb line should make little difference)?”
I did a little inventory, and I have probably run a million or so routes in recent months, churning up huge amounts of CPU time for no specific purpose. Perhaps I did run your route. But to what end? There are no silver bullets. One cannot put a “pin on the map” that says search here, nowhere else. All we can do is put out a range of locations with a probability of xx% that the plane will be found there. Even that calculation is fraught with uncertainty. Your proposed route is someplace in there.
@sk599
Steve, I have now read your interesting paper for the 3rd time and I am still not clear on a number of points.
It is laudable that you have tried to understand our approach, but out of the 9 statistics we use for a LNAV flight path, you find only 6 are relevant and you state that you have only implemented 5 in your model.
Am I correct to say:
(1) You dismiss certain statistics, that we have used: Mean BTOR; Standard Deviation BTOR; 1-hour BFOR deviation; and the BTOR to Along Track Position Error (ATPE) correlation?
(2) You do not implement the GDAS SAT data at all, which varies significantly along our proposed flight path (see Figure 17 in our paper) and changes the TAS for a given Mach along the route?
(3) You implement the GDAS wind data at only three points in time: 20:43; 21:43 and 22:43, whereas the wind speed and direction varies significantly along our proposed flight path between 19:41 and 00:19 (see Figure 17 in our paper)?
(4) Your software label of “Nwind” really means Along Track Wind (ATW) or Tail/Head Wind where Tailwind is positive?
(5) When you change the Initial Track (“Heading”) between 173° and 186°, you adjust the ATW accordingly?
(6) When you change the Initial Track (“Heading”) between 173° and 186°, you mean °T, not °M?
(7) You have not investigated Speed Modes other than Constant Mach?
(8) You have not investigated combinations of Speed Mode and Flight Level?
(9) Your Figure 6 depicts 5 parameters, of which 4 are not in the list of the 5 parameters that you have implemented in your simulation?
(10) You dismiss the BTOR correlation with UT, having checked it out, as not useful for your simulation, but still include it in your list of the 5 parameter you used in your simulation?
(11) You define the MEFE at 00:17 and not 00:17:30?
(12) When you use the Along 7th Arc and Perpendicular 7th Arc parameters (and dismiss using Latitude and Longitude) and assume a 7th Arc orientation of 45° for a 180°T flight path (actually 46.05°), that when you change the Initial Track between 173° and 186°, you adjust the 7th Arc orientation accordingly?
I would be grateful for any clarifications.
@ paul smithson
Not exactly. The DSTG hotspot is a diffuse area and limited in the distance from the 7th arc that is searched. Despite the emphasis of statistics in most of the proposals, I consider the use of the Inmarsat data to be part of a (mostly) deterministic modeling effort with stepwise refinement. The value of computing in engineering is to gain insight into a problem to be solved (this differs from the use of computing to design something once the problem has been solved.)
So, I do not consider that statistics are involved except at the margins. The route needs to be plausible with the minimum number of assumptions and rationalizations.
Even UGIA recommend searching further from the 7th arc. With little amendment the same applies to the 186T point as well. (I have previously hypothesized that the plane could have turned East after 00:11, consistent with the data, if there were a pilot in command, for example.)
At this juncture, I would rather there be no search at all then to search for the wrong reasons.
Again, this dialog has prompted me to look at an aspect that I had not focused on before: the Mean and SD of the BTOR. Last night I looked at the effect of changing the turn time. Within the granularity of 15 second steps, I could adjust the turn time in a range of about 45 seconds and get the mean approximately zero, with little change in the SD, and only a minor degradation of the cost function.
Also, rather small changes in the starting latitude at the start of the turn would have similar effects. Such behavior suggests to me that we are close to the resolution of the model, but the result is unchanged. The residual noise (randomness) is therefore small.
@sk999
I have also run a “million” simulations over the past 5 years 🙂 . So long as your work is cited as the basis of a low probability of reaching a nominal 37.5 (again used as a proxy for the 186T intersection with the 7th arc) location, I wanted to clarify the nature of the computation.
As part of a large survey of possible routes, a single exact solution might get lost in the failed cases. That is why I ask whether that **exact** route has been looked at (Consistent with the comment to sk999, any computation with a different model will need a bit of tweaking to get the exact fit). If it has a good fit and enough fuel, it represents a point along the path that I propose. I hope you can try it.
@Sid Bennett: Within the granularity of 15 second steps, I could adjust the turn time in a range of about 45 seconds and get the mean approximately zero, with little change in the SD, and only a minor degradation of the cost function…The residual noise (randomness) is therefore small.
The mean BTOR could be zero, yet the BTOR could show a strong trend, suggesting it is not random.
@DrB
I am not suggesting maneuvers per se happening at 00:11.
Rather I am suggesting MH370 location on Arc6 is possibly consistent with continued drift downward of the BFOR value.
@VictorI
A strong trend with what?
Of course it is not random, since only one of them is the best fit. The trend is linear with start time which is merely fine tuning the start longitude of the rhumb line.
Richard,
1. I have not implemented the equivalent of your cross-track GSEs. They are not relevant for LNAV modes. I do not implement all of the terms equivalent to along-track GSEs that you use and thus have not implemented the along-track correlation.
2. I use the sum of squares of the BTORs as a constraint. In computing degrees of freedom, they count as five statistics. I do not see the benefit of breaking them out as mean and stdev separately.
3. I do not use the 1-hour BFOR deviations. These quantities have correlated errors that require the introduction of their own covariance matrix if they are to be accounted for properly in the figure of merit.
4. “You do not implement the GDAS SAT data at all …” It is just the opposite. I have code to read both the ARL and the NCEP formats of the GDAS files as well as the NCEP GFS files and extract temperature, winds, geometric altitude, and relative humidity. I have made tables for MH370, MH371, the Amsterdam flight, and the Mumbai flight. I have correlated the predicted humidity with the actual appearance of persistent contrails from aircraft at various locations around the world over the past several years in order to understand the accuracy of contrail prediction.
5. “You implement the GDAS wind data at only three points in time: 20:43; 21:43 and 22:43” No. The flight propagator uses time steps of 1 minute, and the winds and temps are evaluated at each step. Only the wind corrections (Nwind parameters) are estimated for 1 hour intervals, since we can’t do any better.
6. Nwind is technically the North/South wind correction, which, for all practical purposes, is in the along-track direction. The ATW is evaluated in 1 minute steps, so yes to all your ATW questions.
7. I have four speed modes implemented – constant air speed (TAS), constant Mach, LRC, and MRC. The latter two require inclusion of a fuel schedule, so I have not explored them in as much detail.
8. I am not sure what you mean by “combinations of Speed Mode and Flight Level.” The Mach and Flight Leval are allow to float independently (subject to constraints on FL discussed previously).
9. The caption to Figure 6 (and other parts of Appendix II) are a bit careless in the use of the word “parameter” – I should have used the term “measurement” (which broadly includes the correlation coefficients, since they are derived from measurements.) I have now modified the text appropriately. The quantities that are plotted are all included as constraints in the simulation. One should think of “BFOR” as being the sum of squares of the BFO residuals relative to the best estimate of the mean, while “BFO bias” is the error in the mean itself.
10. The BTOR/UT correlation is included as a constraint in the simulation. It shows almost no dependence on start bearing.
11. I have used MEFE times of both 00:17 and 00:17:30, and for constant Mach speed mode, the difference seems to negligible. Much of the early Monte Carlo work used 00:17, and I didn’t want to repeat.
12. When calculating the final location on the 7th arc while adjusting the initial track, I do not use any approximation such as 45 degrees for the orientation – that approximation was done just for the purposes of an illustrative calculation. In practice I run the simulation to 00:20, then backtrack the final latitude by 0.21 degrees since that is about where the BTO is 18390. For these runs I have not tweaked the location to account for any decrease in altitude.
I think that answers most all of your questions.
@Sid Bennett: I’m sorry, but I don’t understand your point.
We are discussing BTORs. For the true path, the sample of 5 BTORs (handshakes 2 – 6) should exhibit randomness. A mean near zero is not sufficient to determine if they are random. They should also not correlate to any other variable, including time. If you are observing a linear trend with time, you have not found the true path.
@VictorI
Perhaps I am not being sufficiently clear.
The BTOR is the difference between the predicted BTO and the observed BTO at the ping times (T>18:40, not including 00:19). The BTOR can easily be adjusted to have zero mean by very slight changes in the path. The changes are too small to implicate any along path met data variations, so they must be due to geometry.
@sk999
Many thanks for fully answering all my clarification questions. That helps me much better understand the various test and simulation runs, presented in your paper.
My apologies that I misread your original explanation, where you state: “The “Nwind” parameters are the North/South components of winds relative to the nominal GDAS values; these are basically equivalent to the along-track GSEs“. I had overlooked the word “relative“. I did not appreciate these were leg averages.
The reason for my interest in your paper is simply the fact, that it is the only paper, that I have read so far, that offers an alternative statistical method to our paper for a MH370 simulated LNAV180 flight path. I just want to make sure, that I am not comparing apples and oranges.
Of course, when you conclude “It is thus seen that the LEP, far from being constrained to a narrow location, actually has a considerable uncertainty, it is more than interesting to see exactly what the uncertainty is across a range of initial bearings, speed modes, navigation modes, flight levels, fuel options and constraints, weather conditions, start locations and times.
I do not want to fall into the trap, that you describe, when you state: “it would be easy to think that one has found the maximum likelihood route when, in fact, it lies elsewhere”.
@Sid Bennett: And I’ll say for the final time that you should also look at the trend (e.g., correlation with time) of the BTORs to judge the suitability of a path, in addition to the expected standard deviation and mean. If the path is the true path, there should be no correlation of BTOR with time, and also no correlation with other random variables.
@sk999: Your list of parameters that are varied was exactly what I was looking for.
Can you also supply the exact function you are minimizing?
@VictorI
Here is a representative time series of the successive ping BTORs
-46, 16, 17,-57, 32.
I am not smart enough to do a correlation computation with such a small sample.
If the SD of the measurement noise itself is 27, this seems OK to me.
@Sid Bennett: EXCEL makes it easy. Just use the CORREL function to compute the Pearson correlation factor of two data sets, which in this case are BTORs and time.
@sk999
What are the best-fit parameters for your 180 degree route please? (Start Latitude, Start Longitude, Mach, Flight Level, Offset, N winds, BTORs, BFORs, …).
I want to compare it with our proposed LNAV180 flight route.
I appreciate you used Constant Mach and we proposed LRC, but we can run a Constant Mach LNAV180 flight route under the same conditions to compare results.
It is very good news that you generally come to the same conclusion as we do, I would still like to understand the details to ensure a valid comparison of your and our results.
Many thanks for your good work and detailed responses to our many questions on objective function, flight parameters and results.
@VictorI
Representative results:
BTOR
Mean -1.778
RMS 38.77
Pearson 0.48
Turn time 18:39:00 (using my exact path…your mileage may vary)
change in latitude at 6th arc 0.041deg
The issue is not exactly which statistics are used, but a comparison of a straight path from at least IGOGU to the 6th arc with any other proposed path.
@Sid Bennett: We would rule a CC near 0.5 to be unacceptable. And that criterion is only one of many other correlation coefficients that are part of our cost function.
@Victor. “there should be no correlation of BTOR with time”. I understand what this metric is getting at: trended errors suggest the model is a bit off. But surely it is the slope of the BTOR against time that matters more than the correlation coefficient per se? You could have a high correlation coefficient for a very regular, slight slope in BTOR vs time (which is a great path fit) or a lower “R” for a less regular association with steeper slope (which is a worse path fit).
@Paul Smithson: The correlation coefficient is already normalized by the scatter of the data, if that’s your question.
@Authors + sk999. We knew a long time ago that BFO error was minimised for paths that reached the 7th arc in vicinity 35S and this was also clear from Victor’s seminal “great circle paths” article https://mh370.radiantphysics.com/2017/10/22/possible-mh370-paths-along-great-circles/.
Doesn’t minimising BTO and BFO error in combination inevitably lead you to a peak probability for paths around 180? If the BFOR is excluded but the other BFO error metric left in (the one that measures error noise but is more agnostic with regard to fixed bias drift), do we still see the same peak? Here I am talking about the probability curved derived from sat data alone – before consideration of debris drift, aerial search or fuel.
Richard,
Initial track/bearing: 180 (fixed)
Start time: 19:41
Start latitude: 93.706
Start longitude: 2.456
Mach: 0.8341 (constant)
FL403 (185 mbar pressure altitude)
Start mass: 200.76 tons (fixed – taken from a longer run that started at
18:28).
Fuel exhaustion: 00:17:30 (changed to match your time)
BFO FFB: 152.2 hz
N/S wind correction, leg 2: -0.1 knots
N/S wind correction, leg 3: -0.5 knots
N/S wind correction, leg 4: 0.8 knots
BTO residuals (O-C) in microsec:
19:41 – 26
20:41 – -41
21:41 – -32
22:41 – 54
00:11 – -12
BFO residuals (O-C) in hz:
19:41 – 3.8
20:41 – -1.0
21:41 – -0.2
22:41 – 1.6
24:11 – -1.1
Victor,
One of the curious aspects of least squares is that you never actually compute the function that you are minimizing; it is done later as a separate step.
The list of quantities that go into the normal equations are:
1. BTO residuals
2. BFO residuals
3. Fuel exhaustion time
4. Five correlation coefficients, converted using a Fisher transformation to a variable that is approximately normally distributed.
5. Priors for all the parameters being adjusted (see previous list and discussion).
6. Auxiliary variables that are required to reach certain values at a certain time. E.G., must pass close to BEDAX at a certain time. [NOT USED HERE.]
All are controlled by flags and/or weights. It is possible disable all inputs except the priors, and then make sure that you get back the initial values that you put in. It is possible to include just one of the correlation coefficients; that is how I studied the BTO/BFO correlation coefficient dependency on start TRACK and start latitude.
OMG. The analytical details have become overwhelming. Have you people no sense of history? No recognition of your past failures?
@sk999: Thank you. You provided what I needed to better understand your results.
@sk599
Many thanks for the further detailed information.
In order to compare our MH370 flight models, I have set up my model as follows:
Start Time: 19:41:03 UTC (you use 19:41, I can adjust my model to start at 19:41:00 UTC)
Start Latitude: 2.4560°N
Start Longitude: 93.7060°E (you had the Lat/Lon interchanged).
Start Track: 180°T
Flight Level: FL403 (185hPa or 185 mbar)
ROC: +300 fpm (just finishing the climb, should I set this to 0 fpm for comparison)
Mach: 0.8341
BFO FFB: 152.2 Hz
I calculate:
SAT: -57.7°C
TAS: 476.986 knots
WSPD: 21.320 knots
WDIR from: 98.326°T
HDG: 177.465°T
ATW: -3.087 knots
∂SAT: -1.2°C
BTOR: -32µs (you get -26µs)
BFOR: 2.5 Hz (you get 3.8 Hz) (for ROC=0 fpm, I get -4.4 Hz, there appears to be a sign reversal somewhere)
I will check these calculations.
In order to compare our MH370 fuel models, I have set up my model as follows:
GWT: 200,760 kg
ZFW: 174,369 kg
FW: 26,391 kg
R Tank: 13,059 kg
L Tank: 13,332 kg
FFF: 1.5%
R/L FF: 1.5%
Packs: ON
X-Feed Valves: CLOSED
Fuel Rebalancing: NONE
I calculate:
Nominal FFR/Eng: 3,159 kg/hr
Right Eng FFR: 3,182 kg/hr
Left Eng FFR: 3,135 kg/hr
Please check the start data, that I am using, compared to yours.
Can you also let me know the Lat/Lon at the various Arcs please (20:41:05, 21:41:27, 22:41:22, 00:11:00)?
Many thanks for your help!
@Victor
I would say the downward BFOR trend Arc3-Arc4-Arc5 is why I started looking for alternatives to 180 South a while back. As alternatives, I considered 186T vs. heading change towards 30 South at 400 knots. I ended up preferring the 30S option(s).
@DennisW
You asked “Have you people no sense of history? No recognition of your past failures?”
We can all make mistakes, we all have past failures. But we can work to improve. We can verify, validate and cross-check our results. We can approach solving the mystery of MH370 with a sense of history and a sense of reality. We are not perfect.
One reason for having 4 co-authors on our paper was to be able to run a verification of the 3 independent MH370 flight models and 2 independent fuel models. Significant test cases were developed and cross checks were performed. The models were deliberately not shared with each other, just the results. It could still be argued, that we had influenced each other’s model development and that getting the same result 3 times does not prove it is the right answer.
One reason for asking Andrew to be a co-author was to have an independent validation, that the results of the flight and fuel models matched the Boeing 777 operational reality, from a pilot’s perspective.
The reason for presenting the paper in Victor’s blog for a peer review, is to submit the paper to the scrutiny of a number of analysts and contributors, many of whom have built their own flight and fuel models. When @Sid Bennett shares his views based an his analyses using Barry Martin’s model, or @Niels presents his results using his own model, or @sk999 presents a paper using his model, each time we can learn something new and correct mistakes we have made. We may not always agree, but the discussion has already produced a large number of corrections and updates to our paper.
I am particularly interested in @sk999’s approach, because he has developed, not only an independent model, but also uses an alternative statistical approach based on the least squares method. I do not expect that all analysts and all models will agree, but it would be helpful to at least explain the differences between the results from different models. We can learn out of those differences and those explanations.
This approach to avoid “past failures” has been used elsewhere.
I worked on the NASA Space Shuttle project for 5 years. There are 5 IBM computers on board. The Primary Avionic Software System (PASS) was written by IBM and runs on 4 out of the 5 computers. The Backup Flight System (BFS) software was a separate contract, given to a separate supplier Rockwell, managed by a separate division of NASA and developed by a separate software team at Rockwell, who were not allowed to talk to the software team at IBM. The two separate organisations still used the same HAL/S compiler, that had bugs, so the result was not perfect, but generic software failures were avoided. Unfortunately, there were problems with O-rings and the Thermal Protection System, that led to two disasters. However, for 30 years, 135 flights and for 355 astronauts the computer systems functioned as required.
@sk999
One more question, if I may: It would be helpful to know if the handshake times are rounded to the nearest minute, or the stated times are just proxies for the more exact handshake times. When you use 19:41, is this actually 19:41:00 (rounded) or 19:41:03 (labelled)? Similarly for 20:41:05, 21:41:27, 22:41:22 and 00:11:00.
@VictorI
I guess I should have asked what wold be an acceptable result.
Give me a number and I will give you a path (within the limits of 15 second steps).
@Richard
I am not suggesting for a moment that there is anything amiss with your latest analytics. Nor was anything amiss with your previous analytics (or the analytics of many others). The data simply does not constrain the terminus to an extent to be useful. In six years we have gone from a dot on the map at 34.X S (Inmarsat seminal work) to a PDF centered on the map at 34.X S (UGIB).
Richard,
Sorry, mislabeled long/lat.
My convention for residuals (BTOR and BFOR) is O-C (observed minus computed), which is the way I learned it and which seems to be the convention in much of the literature. I noticed that I was using a “dash” between the UT and the BTO/BFO residuals, and the comment formatting makes it looks like a “minus” sign – bad choice. I also made one more tweak to the route that changes the BTO’s ever so slightly (but the start parameters remain identical), so here are the slightly revised values (and as a test, I will put a space between the sign and the number.)
19:41:03 = + 30
20:41:05 = – 41
21:41:27 = – 35
22:41:22 = + 52
00:11:00 = – 8
Your start numbers look pretty good. My actual start time is 19:40:59.
I quantize UT to 0.36 second accuracy. All BTOs are computed at the stated times (1 second accuracy).
20:41:05 Long 93.706 Lat -5.520
21:41:27 Long 93.706 Lat -13.572
22:41:22 Long 93.706 Lat -21.537
00:11:00 Long 93.706 Lat -33.372
@sk999
No worries about the mislabeled Lat/Lon.
I use the same convention for BTORs and BFORs of observed minus computed. Our BTORs agree, but I get a sign reversal for the BFORs. I thought I must be doing something wrong, but Bobby also gets a sign reversal.
BTORs
Here are the BTORs at each handshake (Time, SK BTOR µs, RG BTOR µs):
19:41:03 = + 30, + 32.
20:41:05 = – 41, – 35.
21:41:27 = – 35, – 14.
22:41:22 = + 52, + 93.
00:11:00 = – 8, + 65.
There is a good match between our BTORs at the start, but they diverge with time significantly.
BFORs
Here are the BFORs at each handshake (Time, SK BFOR Hz, RG BFOR Hz):
19:41:03 = + 3.8, – 4.4.
20:41:05 = – 1.0, + 1.6.
21:41:27 = – 0.2, + 0.5.
22:41:22 = + 1.6, – 1.6.
00:11:00 = – 1.1, + 1.3.
There is a good match between our BFORs, when the sign reversal is ignored.
Latitude at each handshake
Here are the Lats at each handshake (Time, SK Lat °S, RG Lat °S):
20:41:05 = 5.520, 5.472.
21:41:27 = 13.572, 13.482.
22:41:22 = 21.537, 21.402.
00:11:00 = 33.372, 33.196.
Our Latitude at each handshake also diverges over time. I am using a Vincenty calculation corrected for altitude. What are you using please? I am calculating the SAT (for the TAS) and winds (for the GS) using a 4D GDAS linear interpolation for each position and each minute, for the given flight level (185 hPa).
Fuel
I calculate a REFE at 00:04:19 UTC and a MEFE at 00:10:13 UTC. I calculate a fuel shortage for a MEFE at 00:17:30 UTC is 669 kg. I understood that your simulation shows a MEFE at 00:17:30 UTC, so there is a 7.3 minute difference between us. What time do you get for the REFE please? How do you calculate the fuel flow rate at Mach 0.8341 (as we only have tables for Mach 0.84 from Boeing)?
ATW leg corrections to the nominal GDAS values
I have included the ATW leg corrections, but they only have a small effect on the leg distances and handshake latitudes. There are small differences in the leg winds, leg GS and leg GSEs.
Here is a link to a summary of the flight parameters from my model, including your ATW corrections:
https://www.dropbox.com/s/e5szancc899wn55/MH370%20Flight%20Path%20Model%20V19.8%20RG%20LNAV%20CM%200.8341%20FL403%20Steve%20ATW%20Corrections%20-%20Report.png?dl=0
For comparison, here is a link to a summary of the flight parameters, without any ATW corrections:
https://www.dropbox.com/s/2gnrgerqs4xotuo/MH370%20Flight%20Path%20Model%20V19.8%20RG%20LNAV%20CM%200.8341%20FL403%20Steve%20No%20ATW%20Corrections%20-%20Report.png?dl=0
@Sid Bennett: If r= 0.4 with a large sample mean of 0, we can Fisher transform these values to z’=0.4236 and z’=0, respectively. For a sample size of 5, the standard error for z’ is 0.707, so the correlation of BTOR with time is acceptably small for your path.
It would be interesting to see your calculated values for the other correlation coefficients.
@VictorI
Thanks for the feedback.
Richard,
The BTO and BFO residuals in your table look like they are predicted minus observed – hence the sign flip. So the BFOs match, but the BTOs do not.
I cannot reproduce your BTO values. Example: 19:41:03 you predict 11532 with BFOR = -32 (my sign convention), I predict 11470 with BTOR = +30. 20:41:03 you predict 11705 with BTOR = +35, I predict 11778 with BTOR = -41. Thus, the differences in the predicted quantities are +62 and -73 respectively, but the BTORs themselves are close in magnitude; just the sign is flipped.
I can reproduce the report Table 6.2 BTO values almost exactly (differences of 2-3 microsec.) I also cross-check against the JON paper, where Table 9 provides lat and long at specific times. The coordinates are only given to 0.1 deg accuracy, but within that limit (and taking altitude = 0) I calculate BTOs that match the measured values within the expected accuracy (10-15 microsec, except rising to 50 microsec at the end.)
Flight propagator for LNAV mode uses 3-D vector arithmetic in ECEF coords; Vincenty is used as a cross-check.
Fuel: I am using a simple fit I made to the performance data provided by Boeing in SIR, Appendix 1.6E, Table 4 plus other numbers in that report. It gives FBR values that are higher at early times and lower at later times compared to earlier fuel tables based on the LRC and Hold fuel tables. Hence the differences. The intent was not to accurately model the absolute FBR but rather study what the effect would be of imposing a fuel exhaustion time in the figure of merit and see how it would affect the route parameters
as one varied the initial track. Thus, all I needed was a decent model of relative changes in FBR as one varied Mach and FL. What I found was that it was quite easy to satisfy the fuel exhaustion constraint as one varied the initial track; the main effect was to push the start latitude South. Eventually the start latitude is too far South to be reached sensibly from the 1st arc with a FMT immediately after that last SATCOM transmission at around 18:28.
@sk999
I recently explored back of the envelope estimates of paths consistent with the fuel consumption estimates for LRC from 18:22.I used GE and drew some circles with their centers at hypothetical turn points, noting the intersection with the 7th arc. Assuming a constant high FL and a simple path with a range given by using the LRC fuel model (2847nm from 18:22 and 2708nm from 18:39), the maximum southern latitude that can be reached is slightly more than 39S, if the turn was made at about 18:25, and at (of course) 37.5S (roughly IGOGU) if the turn was made at 18:40 from N571.
By drawing circles of the appropriate radius, the effect of fuel consumption as a limit on the each of the scenarios becomes easy to visualize. For azimuths lower than that needed to reach the 7th arc, in each instance, the point of fuel exhaustion is beyond the 7th arc, whereas for higher azimuths, the range to fuel exhaustion does not reach the 7th arc.
I’m sure others have drawn these circles as well, but I wanted to share my experience. It actually came quite late as you may remember that I used a selected M for each scenario assuming a FL, and could therefore reach the 7th arc at a range or azimuths from any assumed turn point. By fixing the fuel program at LRC and a specific FL, the problem becomes much more constrained.
A further evaluation step then proceeds by comparing the flight paths with the Inmarsat BFO and BTO data along the path, and this eliminates simple paths with earlier turn times than about 18:37.
I wish I had taken this approach earlier, but believe that there was too much uncertainty about some of the information we had years ago. There were too many other possibilities of LNAV modes, fuel modes etc. to visualize.
@sk999
My apologies about the sign reversal, there was an error in my report generator.
The attached link shows an updated comparison table:
https://www.dropbox.com/s/763ii2vmvx557s9/SKRG%20Comparison.png?dl=0
Our BFORs align and the initial BTORs align, but the BTORs diverge with time later in the flight.
The attached link is to a corrected flight report including your ATW corrections:
https://www.dropbox.com/s/e5szancc899wn55/MH370%20Flight%20Path%20Model%20V19.8%20RG%20LNAV%20CM%200.8341%20FL403%20Steve%20ATW%20Corrections%20-%20Report.png?dl=0
To allow me to check why the BTORs diverge, please let me know the distance you calculate for each leg.
In the attached report, you will find the distance I calculate in the column marked “Curved Path Length Lat/Lon (NM)” highlighted in cyan.
Many thanks for your help!
@sk999
In your fuel model based on the Boeing Appendix 1.6E, do you consider the Right Fuel Tank fuel weights separately from the Left Fuel Tank, if so what are your starting values at 19:40:59 UTC please? I have:
R Tank: 13,059 kg
L Tank: 13,332 kg
Do you use a PDA/FFF of 1.5%?
Do you account for the difference in consumption between the engines, if so do you use R/L FF difference of: 1.5%?
Richard,
In case it is useful, I have assembled the following information.
As an initial matter, the slight correction for a curved path at altitude v. a curved path on the earth is about 0.2%. What I call “ground speed” does not account for this projection. Instead, I include corrections to distances where needed. I compute distances in two ways – one is numerical integration of ground speed with time, then corrected for geometric projection as above. The second is with Vincenty directly.
Instantaneous Ground speed (no geometric projection correction)
UT sk999 Richard
19:41:03 474.1 473.4
20:41:05 477.0 476.1
21:41:27 482.9 483.3
22:41:22 475.5 474.3
24:11:00 468.8 469.0
Leg distances (projected onto ground)
UT Direct sum Vincenty Richard
20:41:05 476.7 475.8 473.8
21:41:27 481.8 480.9 479.3
22:41:22 476.9 476.0 474.3
24:11:00 709.5 708.2 707.0
Total: 2145.3 2141.2 2134.4
Vincenty: 2130.2
So my numerically integrated distances are too big compared to Vincenty by about 4 nm over 4.5 hrs.
A curiosity is that your latitudes are virtually the same as values I would compute if I converted my geodetic latitudes to geocentric. Likely a coincidence.
Boeing’s FBR tables already included a PDA factor, so I didn’t have to assume anything. I don’t treat the engines separately and do not account for a slowdown after right engine FE.
[I am sure the nice formatting of this post will be destroyed by the forum comment system.]
@Richard@sk999
Wow. You people really need to catch up on modern thinking relative to the Ludic falacy. You are showing your age. Black swans are everywhere.
@sk999
Many thanks for the further detailed information!
Please ignore @DennisW’s sarcastic bullshit. He obviously has not read, or not understood, one of my favourite books entitled “The Black Swan” by Nassim Nicholas Taleb. In my view, the comparison of our models has been a helpful exercise and it is very encouraging, that two independent models come to a similar conclusion regarding the possible end point of MH370.
There are small differences in our leg distances, which as you point out are only ca. 4 NM over 4.5 hours.
My concern is the bigger difference in the timing of fuel exhaustion and the fuel shortfall.
I have found that if I use a constant SAT throughout the flight, then I match your latitudes at each handshake. I can also match your leg average Ground Speeds by using leg average wind speeds and directions.
It appears that the major difference between our models is that I calculate the SAT, WSPD and WDIR every minute along the flight path propagation, whereas you use a fixed SAT throughout and leg average winds. In my view, this is the reason, why our fuel exhaustion time and fuel shortfall are different. The main take away is that we agree on the end point position of MH370, although not on the search area size.
@DennisW
The proposed path by Bobby, Victor, Andrew and myself, presented in our paper, is the agreement of 3 independent flight models. @sk999 has also produced an independent flight model, where he comes to a similar conclusion on the MH370 end point. This is not some random coincidence, designed to waste your time or ignore modern thinking.
Nicolas Taleb defines a “Black Swan” as “First, it is an outlier, as it lies outside the realm of regular expectations, because nothing in the past can convincingly point to its possibility. Second, it carries an extreme impact (unlike the bird). Third, in spite of its outlier status, human nature makes us concoct explanations for its occurrence after the fact, making it explainable and predictable.”
These four results from Steve and from the 3 models used in preparation of our paper, are not all outliers, as you suggest. You also insinuate, the impact of taking our results seriously is extreme. The impact of not finding MH370 may be significant, but the impact of not taking our results seriously should not be overrated. Finally, we are not concocting explanations, after the fact, in order to defend our proposal. In case your fantasy is working overtime, may I point out that MH370 has not been found yet. We are not making a proposal, after the fact of having found MH370, just to prove we knew where it was all along. We have presented a carefully argued case with evidence in our 186 page paper of where we believe MH370 is to be found, if a new underwater search were to take place.
Please note, that the Inmarsat Satellite Ground Station, used by MH370, is located in Perth, not far from the Swan River, where you will find a large number of Black Swans.
@Richard
Please note, that the Inmarsat Satellite Ground Station, used by MH370, is located in Perth, not far from the Swan River, where you will find a large number of Black Swans.
🙂
@sk999
A few months ago I did some Vincenty equation test calcs for a 180S path. I did not see too much effect, unless I made a mistake (which is easily possible). I was looking at distance between 10 deg latitude increments.
Lat Long Dist
10 94 nm
0 94 597.1
-10 94 597.1
-20 94 597.5
-30 94 598.1
-40 94 599.0
@Richard
It is the MH370 event that is the Black Swan, not you proposal. Similarly, the current pandemic is a Black Swan.
I don’t have much of a sense of humor for either kind of event.
The wreckage of the plane exists somewhere in the SIO.
@sk999
You state “Boeing’s FBR tables already included a PDA factor, so I didn’t have to assume anything. I don’t treat the engines separately and do not account for a slowdown after right engine FE”.
The Boeing Performance Analysis in Appendix 1.6E of the Malaysian SIR can be interpreted in two ways, when they say: “An engine efficiency analysis using the fuel burn information provided in the ACARS data was performed by the engine manufacturer, Rolls Royce. This analysis showed that the specific fuel consumption of the right engine is slightly greater as compared to the left engine. The analysis results in this report have taken this difference into account”.
Boeing specifically mention the R/L engine fuel flow ratio, which we are told elsewhere in the Malaysian SIR was 1.5%. Boeing does not specifically mention the PDA Fuel Factor for the aircraft, which we are told in the RMP report in the Operational Flight Plan is 1.5%. It is not clear whether the second factor is included in the Boeing figures or not. We use both factors in our fuel model, because this aligns with the fuel model validation tests performed using data from previous 9M-MRO flights, both MH371 and MHXX (see Appendix B in our paper).
What is clear from the Boeing Performance Analysis is that they use the assumption of a “Standard day atmosphere”. The Boeing Planning and Performance manual states: “Increase/decrease fuel flow 3% per 10°C above/below standard TAT. Increase/decrease KTAS by 1 knot per 1°C above/below standard TAT”. You not only have to interpolate the fuel flow rate for aircraft weight, mach and flight level, but also correct for ∂TAT. The figures in the Boeing Performance Analysis table 4 are not corrected for ∂TAT.
As you do not treat the engines separately, what sigma are you currently using for MEFE in your objective function? You previously mentioned that you used a RMS scatter of 1 minute on the fuel exhaustion time. One minute of fuel is about a 100 kg. We use a figure of 427 kg, which is around 1% of the total fuel on board, just after the top of the climb, as shown in the last ACARS message at 17:06:43 UTC. I assume, if you used 1%, instead of 1 minute, then your PDF would widen, but the best case will still be for a track of 180°T.
@Authors +sk999. I am still trying to understand what it is that is contributing to your probability peak, based on the route stats alone (ie omitting fuel, drift, aerial search). Is it not the minimisation of a combination of BTO and BFO error that takes us there? Do the “new” route optimisation stats still point to the same peak if BFOR is removed from the optimisation criteria?
Richard,
Figure 15, 2nd panel of the report shows that, for latitudes S of -34, the route probability considering fuel endurance alone shows a precipitous drop from 100% to less than 10% at latitude -36. However, this figure was based on maximum likelihood routes that did not include fuel endurance (i.e., the time of fuel exhaustion or equivalent) in the figure of merit. I was curious whether I would see the same effect if I did include it. I did not. The maximum likelihood routes that I computed for a range of final latitudes all had fuel exhaustion times very close to the nominal value (and for this exercise, I used 00:17:30.) The worst-case outlier was the one ending at latitude -31.1 degrees, where the fuel exhaustion was at 00:16:59 (i.e., 31 seconds early). At the extremes (initial track 173 and 186, end latitudes about -30 to -37.5), the fuel exhaustion times were basically identical to that at track 180. Have you computed maximum likelihood routes for such routes, specifically including fuel exhaustion time as a constraint?
I do not use constant SAT along the route but rather the locally interpolated value from GDAS.
Paul Smithson,
I do not speak for “@AUTHORS”, only myself. Figure 6 from my previously linked report of Apr 5 (updated Apr 22) shows the factors that I included in my figure of merit and found to be important. I considered SATCOM data only. Be aware that the curves plotted in this figure are sensitive to various assumptions, some of which are a bit arbitrary. YMMV. I leave it to others to assess the validity of the drift model matching and aerial search efficacy.
@sk999. Thanks, will check yr report again first.
@sk999. I have been back to look at your paper with appendix 2 on correlation coefficients.
If I understand correctly, your covariance discussion is essentially a demonstration of the rotational symmetry of the problem. As you shift the start latitude your best solution “rotates” around the closest point of approach to yield a new best-fit track angle.
Annex, Fig 5. Do I understand that this whole exercise is run from the 19:41:03 position as the UGIB paper? And if so, is it any surprise that we end with the same peak in track angle probablity? What does your figure tell us about 180.0 as a “global” best solution, without constraining the start position on Arc 2?
Annex, Fig. 6. shows the contribution of the various statistics in contributing selectivity to the solution. If my interpretation is correct, it is “BFOR” that is the main restriction on headings >> 180. Without that, we would have a very much broader distribution of track angle solutions.
If, as I surmise, those additional route optimisation statistics do not make a major contribution to a narrow peak, are we actually achieving anything more substantial than replaying the BTO/BFO combo that drove the ATSB’s Flight Path Analysis Update of Oct.2014 with its autopilot and data error optimisation probablity distributions?
I am very happy to be corrected on any error of fact or interpretation above. I am simply trying to understand the extent to which UGIB’s 9 route statistics provide empirical demonstration of a clear and focused global optimum.
@Paul Smithson: @sk999 has already said what parameters were varied and what contributed to the cost function:
https://mh370.radiantphysics.com/2020/03/09/new-report-released-for-mh370-search/#comment-28186
https://mh370.radiantphysics.com/2020/03/09/new-report-released-for-mh370-search/#comment-28209
The position at 19:41 was not held constant for Figure 5.
@Victor. Thanks for pointing me to those further exchanges. I understand now that the start position is not fixed at 1941.
sk999 has indeed listed the parameters that go into his cost function and provides the graphical summary in his Appendix, Fig. 6. I am trying to confirm that I am interpreting this correctly:
1. High chi-sq value on y axis signifies low probability
2. The “parameter” that prohibits track angles above 180 is BFOR
3. The “parameters” that makes track angles <<180 improbable are BFO Bias and BTO/BFO correlation.
Ergo, without BFO, the remaining factors are insufficient to distinguish a pronounced peak. Is that right?
@Paul
The details of the steps involved in the weighting and generation of a PDF in the analytics of both sk999 and UGIB are a bit murky to me as well. I have never used a Fisher Transform before.
@paul smithson,
You cannot determine the relative values of the chi squares for different parameters in @sk999’s Figure 6, because each curve has an unspecified constant subtracted from it.
@DrB and sk999. In that case I’m unfortunately not clever enough to understand what the take home is and I suspect I’m not the only one. Could you please walk me through it?
@sk999
You ask: “At the extremes (initial track 173 and 186, end latitudes about -30 to -37.5), the fuel exhaustion times were basically identical to that at track 180. Have you computed maximum likelihood routes for such routes, specifically including fuel exhaustion time as a constraint?”
In Figure 15 Panel 2 to which you refer in your comment, we state “Probability of the Fuel Model Matching the Known Endurance”. We mean, what we say. In addition, we explain in full our objective function and route fitting process in Appendix G. In section G.10 we explain the alternative objective function for route fitting, both for the route probability on its own and the route and fuel probability together.
In our paper we explain, that we have considered all Initial Bearings from 157°T to 192°T, from all start latitudes from 16.0°N to 4.3°S (start time and start longitude are not constrained), at all flight levels from FL350 to FL430, in all navigation modes (LNAV, CTT, CTH, CMT, CMH) and all speed modes (CM, LRC, MRC, ECON CI=52). 923 flight path trials were run as part of the preparation for the paper. In total, we have run more than 2,300 simulations. This work continues.
My big question is why our fuel models differ so much. I have finally tumbled the fact that you do not have a fuel model, no wonder my comments and questions seemed irrelevant:
1. You are using Constant Mach 0.8341 and I asked how you derive the fuel flow rate from the Boeing Table 4 in the Appendix 1.6E of the Malaysian SIR. No answer.
2. You ignored my question about the correction for delta TAT.
3. You assume the PDA Fuel Factor of 1.5% is already in the Boeing Table 4 in Appendix 1.6E, where it is clearly not included.
4. You are not treating the Right and Left Engine separately and correcting for the 1.5% difference in fuel consumption.
5. You are not considering the fuel impact of the status of the air conditioning packs, fuel rebalancing or cross feed valves.
6. You calculate the aircraft gross weight at 19:41 is 200.76 MT, which implies a fuel weight of 26,391 kg, but do not use the fuel weight to find the time of the REFE or MEFE in the 1-minute steps of your model.
7. You do not explain your FMT route on which the aircraft gross weight at 19:41 calculation is based. You only comment “taken from a longer run that started at 18:28”.
8. The direct route from the Boeing position at Arc 1 (18:28:05.90 UTC) to your start point is 290.4 NM and the time interval is 1.215 hours, which implies an average GS of 239.0 knots. Boeing assume the GS at Arc 1 is 503 knots. You state the GS at 19:41:03 UTC is 474.1 knots. Your FMT route cannot be a direct path, as you suggest: “eventually the start latitude is too far south to be reached sensibly from the 1st Arc with a FMT immediately after the last Satcom transmission at around 18:28”.
9. In your latest comment, you claim the MEFE was identical for tracks at 173°T ending at 30°S, 180°T ending at 34°S and 186°T ending at 37.5°S. I agree between a 180°T and a 173°T there is little difference in the average ATWs. However, between a 180°T and a 186°T there is a significant difference in the average ATWs of 2.4 knots over the 4.5 hour flight route. The ATW changes from +1.3 knots at 180°T to -1.1 knots at 186°T. This will effect the fuel consumption.
10. I conclude you do not have a fuel model, you have a fit to the performance data in the Boeing Table 4 in Appendix 1.6E of the Malaysian SIR.
11. I am glad to hear that you calculate the SAT and the winds each minute in your flight path simulation. When I use your flight parameters in my model, I calculate the 1-minute average ATW between 19:41:03 UTC and 00:11:00 UTC is +1.22 knots. In our paper, the relatively similar LNAV180 LRC FL390 flight path has an RMS ATW of +1.0 knots. Calculating the leg distances from your positions at each handshake, deriving the average GS from the leg distance and deriving the leg average TAS, using the 1-minute GDAS SAT, shows your average ATW is -1.21 knots. This result is the exact reverse of my calculation of the average ATW. One of us, has their winds reversed, like Boeing in Appendix 1.6E.
@paul smithson,
You said: “@DrB and sk999. In that case I’m unfortunately not clever enough to understand what the take home is and I suspect I’m not the only one. Could you please walk me through it?”
I cannot fully evaluate @sk999’s result yet because we still do not have sufficient information on what he did. For instance, we don’t know the relative values of chi squared for each parameter. Richard has pointed out some of the unknowns and shortcomings in his fuel and flight models. @sk999 also has not specified the weighting factors he uses in his cost/objective function, so we don’t know how much weight is given to each factor.
I am guessing the fuel “model” (i.e., the MEFE estimate) is a significant driver in determining the width of @sk999’s Figure 5. It can’t be just BTOR and BFOR. You will recall that Victor did that specific comparison many, many moons ago, and it did not indicate a particular bearing as selectively as @sk999’s Figure 5 does.
You forgot to premise your final comment: “And another thing,…”
*preface
@Richard
I presume your comments refer to @sk999s model and results with respect to 186T.
I am in the process of doing a image transfer of one computer to another and I may be off line for a little while.
Paul Smithson,
You have many questions. Let me try to respond as best as possible.
1. “… your covariance discussion is essentially a demonstration of the
rotational symmetry of the problem. As you shift the start latitude your
best solution ‘rotates’ around the closest point of approach …”
It actually rotates about the 19:41:03 position, which itself slides up and
down along the 7th arc as the track angle is varied. As it turns out, that
location is close to the “closet point of approach”, but the point of closest approach itself has no intrinsic meaning – we just happen to be near there.
2. “Do I understand that this whole exercise is run from the 19:41:03
position as the UGIB paper?” No. The initial position is allowed to vary
freely.
3. “… is it any surprise that we end with the same peak in track angle
probablity?” Not really. We work with the same data and other information.
4. “What does your figure tell us about 180.0 as a ‘global’ best solution,
without constraining the start position on Arc 2?” Since I did not
constrain the start position, I think the figure stands on its own.
5. “If my interpretation is correct, it is ‘BFOR’ that is the main
restriction on headings >> 180.” That is correct. As you are well aware,
the reliability of the BFORs has been questioned by others here. Hence, you
need to exercise your own judgment in order to decide if my analysis is
credible.
6. “If, as I surmise, those additional route optimisation statistics do not
make a major contribution to a narrow peak, are we actually achieving
anything more substantial than replaying the BTO/BFO combo that drove the
ATSB’s Flight Path Analysis Update of Oct.2014 with its autopilot and data
error optimisation probablity distributions?” I will answer YES. The
ATSB’s flight paths simply tried to fit the data without regard to
considering how the plane might actually have been flown. The BTOs are
consistent with a plane that flew in a “straight line” (whether LNAV, true
or magnetic track, or whatever) and were inconsistent with a plane that flew
between waypoints in a crowded airspace (such as MH371). In my opinion, the
imposition of a “straight line” constraints is fair and reasonable.
7. “I am simply trying to understand the extent to which UGIB’s route
statistics provide empirical demonstration of a clear and focused global
optimum.” Same here.
8. Bobby Ulich responded to you with the statement, “You cannot determine
the relative values of the chi squares for different parameters in @sk999’s
Figure 6, because each curve has an unspecified constant subtracted from
it.” Please ignore that statement. The RELATIVE probabilities (which is
what are plotted in Fig. 5) are determined essentially by what is shown in
Fig. 6. What you cannot say anything about is the absolute probability. However, if the assumption of a “straight line” trajectory is correct (see bullet 6 above), then the absolute probability drops out.
9. Bobby Ulich responded to you with the statement, “I am guessing the
‘fuel model’ (i.e., the MEFE estimate) is a significant driver in
determining the width of @sk999’s Figure 5.” Please ignore that guess.
It is the opposite. Had the fuel model been a factor I would have included
it in Figure 6. Indeed, based on UGIB Figure 15, panel 2, I was expecting
to find exactly that result. Didn’t see it.
Good questions.
@sk999,
Until you show the offsets you have subtracted from each chi squared curve, one cannot figure either the relative change in chi squared for a single parameter with route bearing, or the relative chi squared values between any two parameters at a given bearing. It would also be helpful to add the curve for MEFE. Why not use a logarithmic vertical axis? That would allow all chi squared curves to be plotted without subtracting any offsets.
How are you combining the several weighted Z statistics to compute probability? Fisher’s method like we used? Or something else?
@sk999. Thanks for those responses. Very clear and helpful.
@paul smithson,
You said: “If I understand correctly, your covariance discussion is essentially a demonstration of the rotational symmetry of the problem. As you shift the start latitude your best solution “rotates” around the closest point of approach to yield a new best-fit track angle.”
To which @sk999 replied: “It actually rotates about the 19:41:03 position, which itself slides up and down along the 7th arc as the track angle is varied.”
Neither explanation is correct. The best point of approximate rotational symmetry on the Earth’s surface is the sub-satellite point. It has nothing to do with a particular arc or a particular location on a particular arc. As I have pointed out previously, if the satellite were not moving, and if the winds did not vary with SIO location, the SIO Route solution would be indeterminate in bearing, because the rotational symmetry about the satellite location would be perfect.
@DrB
I think all three descriptions are saying the same thing in different ways.
@sk999,
You said: “The RELATIVE probabilities (which is what are plotted in Fig. 5) are determined essentially by what is shown in Fig. 6. What you cannot say anything about is the absolute probability.”
You are correct. The relative probability depends on the difference in the chi squareds, which does not depend on a subtracted offset. The absolute probability depends on chi squared with no offset subtraction.
You also said: “9. Bobby Ulich responded to you with the statement, “I am guessing the ‘fuel model’ (i.e., the MEFE estimate) is a significant driver in determining the width of @sk999’s Figure 5.” Please ignore that guess. It is the opposite. Had the fuel model been a factor I would have included it in Figure 6. Indeed, based on UGIB Figure 15, panel 2, I was expecting to find exactly that result. Didn’t see it.”
You also didn’t show it. That would have helped other people understand what you did.
From your Figure 5, the three main contributors to the cut-off in probability (down to 10% in relative probability) circa 32.7S for initial bearings less than 177.25 degrees are, in order of decreasing importance,the CC of BTOR to BFOR, the BFO Bias, and the BTORs. The three main contributors to the probability cut-off circa 36.7S for initial bearings greater than 184.25 degrees, are the BFORs, the CC of BFOR to UTC and the BTORs.
So, the BTORs contribute somewhat to the fall-off on both sides, but four parameters related to BFORs do the majority of the discrimination. Two correlation coefficients figure prominently – the CCs of BFOR w.r.t. BTOR and w.r.t. UTC. Thus, adding those CCs significantly improves the bearing discrimination.
Again, I would caution against using BFO Bias as a route discriminator because of the possibility of OCXO drift, in which case one does not know if a non-zero mean BFOR is due to a route error or is due to OCXO frequency drift. Your assumption that OCXO frequency drift is small might not be correct.
Yes, Dr B. That fine distinction is understood.
Tangency at BTO value 11482 at 19:53:30 is what is implied by a simple polynomial fit of the BTO data and the great circle solutions rotate around that virtual arc in a very satisfactory manner. One of the peculiar aspects of the path solutions ending north of about 37S is that they require a “breaking” of this implied tangency timing, shifting it substantially along the path to permit a BTO fit with slower speed.
Your path has its 194103 position at 2.935N and achieves CPA (my reconstruction of your model – please confirm) at 19:49:25 at a latitude of 1.8N.
Whereas the path model that rotates around a virtual 11482 CPA has its 194103 position on the 11500 arc (35000ft) at 3.51N and achieves its tangent at 19:53:30 at 1.76N.
So the latitude of tangency is the same, but the timing is about 4 minutes different (or roughly 30NM along-track difference). To obtain slower speed great cirle solutions you need not only to rotate the track but also “slide” your start position along it.
@sk999
Your method has stimulated me to consider another related approach. I will describe it in my usual back-of-the-envelope way visualizing it with reference to GE.
The ping rings represent the locus of possible aircraft locations at the time of the ping. We have two discrete examples of paths that are believed to meet at least the criteria for matching the Inmarsat data and have sufficient fuel to reach the 6/7ring (180 and 189 rhumb lines..but think of them as GCP approximations in the azimuth regime we are discussing.
Question: are there any other locations along the 2nd arc that can satisfy this constraint?
Approach: The path length from 19:41 when the plane is on the second arc to a point on the 6th arc should have a length of 1996nm (or so, depending on your fuel model).
We know that there are at least two points that satisfy the distance requirement (93.760, 2.9136; 93.5645, -0.6771).
So, draw a circle of radius 1966nm and slide it along the 2nd arc.
Any intersection of the circle with the 6th arc is a fuel possible path for the LRC mode.
This is approximate as tail winds have an effect on the length of the path and they will differ a little, but it would determine if there any other discrete paths that should be considered.
Is there anything fundamentally incorrect about my approach?
@Sid Bennett asked: Is there anything fundamentally incorrect about my approach?
As we’ve discussed before, the rotational symmetry is broken by weather and satellite inclination. In general, LNAV paths crossing the 7th arc further south require higher Mach numbers, which reduce the endurance.
@VictorI
I said nothing about whether the path leads to a further South intersection.
More importantly, I thought that we had already agreed that there was sufficient fuel to reach the 6th arc from IGOGU on a 186 rhumb line path.
If my approach is technically sound, and you are right, only 186 will find an intersection above 180 that meets the path length constraint and has acceptable errors with respect to the Inmarsat data.
If I follow your approach, if a route is feasible with a last leg of about 2000nm from the 2nd arc, and the path has a sufficiently low error with respect to the Inmarsat data, then the question is whether there is a plausible route to reach the start point on the 2nd arc. For turns at IGOGU, there is always enough fuel to reach a start point on the 2nd arc where the azimuth of the turn is to less than 180T.
Richard has done a similar study which is the basis of your paper, but it was not constrained by the LRC fuel model, so the length of the final leg was not fully defined. Now the length of the leg and the time to fly the leg are constrained. (It may lead to the same result, but the solution space for this problem is enormous and we know that the individual candidate paths are often isolated from each other.)
@Victor. Rotational symmetry is near-perfect for Arcs 2-5 for track angles anywhere between 175 and 195, with CPA 11482 at 19:53:30. As you say, all you need is a marginally higher groundspeed as track angle increases (500.3kt for 175; 5001.5 for 180; 502.6 for 185; 503.6 for 190; 504.5 for 195).
In all cases, the predicted BTOs are within 2 microsecs (what I believe Dr B has previous remarked as being “too good to be true”) but they all predict “excess BTO” of about 355 (348 – 365) microsecs at Arc 6 (which largely disappears for southerly paths once your run the same path inclusive of Wx).
It is this perfect fit to a great circle section (pick a path, any path..) that convinces me of the import of the closest point of approach value and timing. Across this 20 degree range track angles CPA is identical to +/- 0.4 microsecs and time +/- 2 seconds.
And if that is what produced the BTO pattern Arc 2 – Arc 5 there is an inescapable deduction: of early FMT, high speed path and track angle in the region of 190 because that is where it “leads back to”.
So I’m using a simple polynomial fit to the BTO data trying to generate straight paths and I’m having a hard time to succeed, at least for LRC and level flight. The problem seems to originate from the 19:41 BTO and some first results indicate the path curvature I’m seeing for level flight can be strongly reduced by reducing the 19:41 BTO by about 100 microseconds, thus producing a different polynomial to work with. It needs more extensive study, however together with the 19:41 BFO for me it raises the question if MH370 really was at high altitude around 19:41.
@Victor I
At the risk of putting my foot in my mouth, what is wrong with IGOGU+ISBIX +180? LRC at altitude.
@niels. I’ll share a sheet later this evening with the “generic” constant groundspeed solutions at 275, 280, 185, 190, 195 mentioned above.
Fat fingers on the phone- 175, 180, 185…
@VictorI
I think I got my circles confused…
Attached the a spreadsheet demonstrating the near perfect rotational symmetry of paths optimised to fit Arcs 2-5 with constant groundspeed and the match between these paths and the 3rd order polynomial fit to the BTO data. Download and open in excel if you want the charts to display correctly.
https://docs.google.com/spreadsheets/d/1RHmeipyrFBSi1jcExigEM0aSEOVqa7JiGbub_Ls_Iwg/edit?usp=sharing
The paths vary in track angle between 175 and 195 degrees
Speed required varies between 500.34 and 504.50kt
The closest point of approach varies by 0.7 microsecs (range 11481.9-11482.6)
Timing of CPA varies by 10s (range 19:53:35 – 19:53:25, rounded to nearest 5s)
Projection of each path back to 18:28:15 predicts the same BTO +/-4 microsecs (range 12,330 – 12,338), which in turn is only ~150 different to the observed value at Arc 1.
All paths predict “excess” BTO at 00:11 of ~350 microsecs (+349 – +365)
Note: these paths were *not* constructed to “aim” at the same CPA. The paths are obtained by starting exactly on Arc 2 and optimising the BTO fit through to Arc 5. The CPA is simply a by-product of the path fit.
The characteristics of these paths closely match the third order polynomial fit to Arc 2 – Arc 5 BTOs. Model CPA 11,481.5 at 19:53:35. Model BTO at 18:28:15 = 12,364. Model BTO at 00:11 = 18,388.
So the shape of BTO observed vs time function is not simply an abstract polynomial. It is what you get (to within 2 microsecs) when you travel across the earth during this epoch in a great circle path with a bearing and speed that matches BTOs 1941 through 2241.
@path modellers:-
Would those of you with path models mind providing a cross-check on BTOR and BFOR for this LNAV constant M, constant pressure altitude path model?
Start time: 18:33:15
Long/Lat: 95.2364E 6.7974N
Initial bearing 190.735
Mach 0.8400
FL340 (GDAS winds and temperature: bicubic spatial interpolation, linear time interpolation)
Geometric height 35,000ft
I get BTOR (predicted-observed): +9, +14, +13, -35, +15 (RMS=19.7)
I get BFOR (predicted-observed): -7.4, -8.1, +2.5, +5.5, +9.2
Before anyone is tempted to point out that the BFO looks horrible, the fuel can’t get you there, drift models yadayada…. I know. Please bear with me.
@sk999. Your Figure 6 route sensitivity study indicates prohibitive BTOR for track angles of >185. I don’t understand why this is given the example above. Victor’s great circle path study found lowest overall BTOR RMS (~21) for LNAV, constant M track angles 190 and 192. Is it maybe something to do with speed constraints on your model?
For those of you averse to BTOR/UTC correlation, the same start position with speed M0.8409 and initial bearing 190.853 gives you [according to my model] a flat BTOR profile with a single outlier for an RMS of 23.2
BTOR: 0, 1,-2,-52, 1
@Niels, @paul smithson:
Fitting a third order polynomial to BTO pings 2-5 happens to also fit ping 1 but not the FMT.
Using a second order polynomial instead gives a very close match to the FMT. (The match for 6th and 7th pings is worse).
My report of a null 2nd Arc BTOR using a low altitude/speed BEDAX-ISBIX waypoint path continued to Cocos Island (where timing matches seismic evidence of a flyover) is here:
https://370location.org/2018/10/examining-the-tangent-path-of-mh370/
@370location
A 3rd order polynomial fit to arc 2-5 predicts a value at 18:28:15 that differs from observed by 116 microseconds (12,364 vs 12,480).
A 2nd order polynomial would work if the earth was a perfect sphere and the satellite wasn’t moving. The 3rd order is required to capture the compound effect of these. So I don’t think any particular significance should be attached to 2nd order model predictions.
As the spreadsheet shared earlier demonstrates, actual best-fit constant groundspeed great circle paths produce BTO at 1828 and 0011 that is very close to that predicted by the 3rd order polynomial fit to Arc2-5. In other words, the polynomial function is doing a remarkably good job of representing a constant GS GC path – to within a few tens of microseconds over 6 hours.
The “best fit constant GS paths” exercise was done using a path model with 5s steps. The rounding of ping times results in an interval between Arc2 and 5 that is 4 seconds shorter in the path model than actual period. If you re-ran the path-fit exercise with a 1s step model from 19:41:03 you should end up with marginally (about 0.04%) slower speeds but the initial bearings should be nearly the same.
I have updated the spreadsheet with 1s resolution CPA (time, position, BTO, azimuth) predicted by the 5s path-fit optima. I get a range in CPA_BTO of 0.6 microseconds and a range in BTO_time of 11 seconds.
link for updated sheet showing predicted CPA
https://docs.google.com/spreadsheets/d/13kDCaq28EmFFoYulh2uco5kz9qk9xFxIlQoZvQ6-Dzs/edit?usp=sharing
@All,
There has been much discussion about the objective function we should optimise and what constraints should be applied, in order to find the most likely end point of MH370. The prior distribution of the state at initialisation and particularly the last known radar position, speed, altitude and fuel available, the state evolution and particularly the timing, position and modus of the FMT as well as autopilot and auto throttle selection and finally the measurement likelihood for the flight path into the SIO, have all been analysed in great detail.
The IG produced a series of public statements in 2014, based on data error optimisation of the Inmarsat satellite data and concluding a MH370 end point around 37.7°S. The ATSB followed with a series of reports in 2014 and 2015 based on a data error optimisation method, concluding a probability distribution centred on 34°S and a constrained autopilot dynamics method, concluding a probability distribution centred on 36°S. Inmarsat presented a paper in 2015 based on a best fit to the BTO and BFO data of 34.7°S. The DSTG wrote a book in 2015, based on a Bayesian method, concluding a probability density function centred on 38°S.
In our paper, we included a more comprehensive analysis of the BTO and BFO data error optimisation method and a fully validated fuel model and constraints based on aircraft performance and the air temperatures and winds encountered en-route. The fuel model not only considered the fuel available, the distribution of fuel between the fuel tanks, the aircraft performance degradation fuel factor, the different fuel flow rates of each engine, the aircraft gross weight, flight level and air temperature, but went further to consider the effects of shutting down one engine during a possible FMT descent, switching off the air conditioning packs, rebalancing the fuel between the tanks and opening the cross feed valves. We also included an analysis of the air temperature (SAT, TAT, delta SAT, delta TAT) constraining Mach, air speed and fuel flow rate as well as wind speed, wind direction, ground speed, along track and cross track position errors, for the various auto-pilot constrained navigation methods. We presented a cumulative probability based on combining the individual satellite, fuel, drift and aerial search probabilities. More recently, we have considered an objective function based on the route probability alone or alternatively based on the product of the fuel and route probabilities. We considered the constraint of using waypoint BEDAX. Our conclusion of a LNAV 180°T route at LRC and FL390 to 34.3°S, has been questioned by a number of analysts.
@Sid Bennett presented a paper using a cost function based on the satellite data and concludes an initial bearing of 186°T from a FMT at 18:37:45 UTC results in a MH370 end point at 37.7°S. His analysis confirms the fuel range and endurance match his proposed flight path. He further points out that the flight path can be constrained by using the waypoint ISBIX.
@sk999 presented an alternative method in his paper analysing the maximum likelihood solution based on the satellite data and the fuel endurance constraint, using a least squares method. @sk999 confirms our finding that a 180°T track to a MH370 end point around 34°S is most likely and the correlation coefficients reduces the width of the probability density function. The correlations are expressed by the covariance matrix.
@paul smithson sees the covariance discussion is essentially a demonstration of the rotational symmetry of the problem. Bobby responded, that if the satellite were not moving, and if the winds did not vary with SIO location, the SIO Route solution would be indeterminate in bearing, because the rotational symmetry about the satellite location would be perfect. Victor added the rotational symmetry is broken by weather and satellite inclination. @paul smithson presented an analysis based on a set of constant groundspeed LNAV great circle paths, optimised to fit the BTOs from Arc 2 to Arc 5. He demonstrates the near perfect rotational symmetry of paths optimised to fit Arcs 2-5 with constant groundspeed and the match between these paths and the 3rd order polynomial fit to the BTO data. @paul smithson concludes an initial bearing of 190.735°T resulting in a MH370 end point at around 39.5°S is the best fit. He further comments that an initial bearing of 190.853°T gives a flat BTOR profile with a single outlier of -52 µs.
@Niels commented he is using a simple polynomial fit to the BTO data trying to generate straight paths and is having a hard time to succeed, at least for LRC and level flight. The problem seems to originate from the 19:41 BTO and some first results indicate the path curvature for level flight can be strongly reduced by reducing the 19:41 BTO by about 100 microseconds, thus producing a different polynomial to work with.
@370Location comments that he presented a paper in 2018 analysing the point of closest approach to the satellite and the tangent flight path of MH370 at that time, following on Brian Anderson’s earlier work finding the BTO minimum by fitting a third order polynomial to all of the BTO samples. @370Location concludes a null 2nd Arc BTOR using a low altitude/speed BEDAX-ISBIX waypoint path continued to Cocos Island (where timing matches seismic evidence of a flyover) reveals a MH370 end point of 8.4°S.
In summary, there is a large variety of MH370 end points from various analysts from 8.4°S to 39.5°S. They cannot all be right.
What objective function should we use? What constraints are valid?
I propose the following:
Objective
The objective is to find the overall best fit combined route and fuel probability over a range of initial bearings.
Method
The candidate routes are defined by their initial bearing (between 155°T and 192°T), speed mode (LRC, CM0.84, CM 0.85, ECON CI=52) and flight level (FL350 to FL430). Each candidate is first tested considering all 9 cases of available fuel and using the required fuel option A, B1, B2 and C. There are 27 valid fuel combinations for each candidate route. In order to define the combine route and fuel probability for a particular candidate route, we first select the best ‘available fuel / required fuel’ pair.
Problem
A problem arises for any given initial bearing, there may be multiple ‘available fuel / required fuel’ pairs for any given speed mode and flight level.
Type 1 Problem: Sometimes there is a single pair and it is obvious that for speed mode X and flight level Y, the optimum combined route and fuel probability has been found.
Type 2 Problem: Sometimes there are two pairs and speed mode X1 and flight level Y1 look just as good as speed mode X2 and flight level Y2.
Type 3 Problem: Theoretically, there are n pairs and speed mode X1 to Xn and flight level Y1 to Yn look just as good.
How do you then decide which candidate route has the optimum combined route and fuel probability?
For Type 1 problems, the answer is obvious, e.g. LNAV180 LRC FL390.
For Type 2 problems, the answer is not so obvious, e.g LNAV183 CM0.85 FL430 and LNAV183 CM0.84 FL410.
For Type 3 problems, the answer is even less obvious, e.g. LNAV182 LRC FL400, LNAV182 CM0.85 FL420 and LNAV182 CM0.84 FL410.
Overall Probability of Candidate Solutions
The question is how do you represent the combined route and fuel probability for those candidates with multiple solution pairs?
For example, LNAV182 LRC FL400 Case 4 Option B1, LNAV182 CM0.85 FL420 Case 6 Option B2, LNAV182 CM0.84 FL410 Case 9 Option B1 and LNAV182 ECON CI=52 FL405 Case 8 Option C all fit the ‘available fuel / required fuel’ criteria.
We need to be able to determine what is the overall fuel probability for LNAV182. Suppose the 4 examples have a route probability R1, R2, R3 and R4 and a fuel probability F1, F2, F3 and F4.
Then the overall route x fuel probability for LNAV182 is simply ((R1 x F1) + (R2 x F2) + (R3 x F3) +(R4 x F4) / 4).
@Richard. “@paul smithson concludes an initial bearing of 190.735°T resulting in a MH370 end point at around 39.5°S is the best fit.” Not quite. My analyses, which I have not yet shared in full, predict 7th arc crossing (18390 at 35000ft equivalent) of between 39.2S and 39.7S. Where, along that stretch you prefer to stick your pin depends on some finer-detail assumptions on FMT and the path I shared at FL340 is only one example among a spectrum of possiblities. I realise that all of these possibilities are ruled inadmissable by most commentators on grounds of fuel, BFO and drift. Of these, fuel is the most intractable. I continue to work on these aspects.
In case you have time and inclination, I’d value your cross-check on the BTOR and BFOR for that path model https://mh370.radiantphysics.com/2020/03/09/new-report-released-for-mh370-search/#comment-28276.
@paul smithson
Thanks for sharing the spreadsheet. I was initially surprised by the excellent BTO fit (arcs 2 -5) for the different bearings, however isn’t that the result of having enough degrees of freedom compared to the number BTOs that you have to satisfy? If you start exactly on arc 2 you only have 3 BTO values left to match, and you have the groundspeed, initial bearing and initial position on the 2nd arc to tune with (?)
@Niels. The zero (or very low) residuals on the polynomial fit are indeed expected with a small number of datapoints. What is more suprising is how well they match actual constant GS GC paths. Which suggests to me that those BTO readings must be very close to “real” in spite of jitter and small changes in actual GS attributable to weather. Or it could all just be a coincidence 🙂
@Richard
My comment was not referring to any end point. In fact, while my current method can indicate a “best fit” path under certain assumptions, after several refinements of my model I’m seeing such weak optimum ( as a function of bearing) that I agree, probably with most contributors here, that such limited “BTO only” analysis cannot contribute much in confining the end point range to manageable size directly. I’ve just completed a quite extensive new systematic scan of a range of initial positions and flight levels and will share results asap.
Still the polynomial based method and latest results are interesting, in the context of helping to find regions of interests in parameter space. For example I’m seeing some indications for a “best-fit” FL (assuming CTT and LRC). Furthermore, and that was the main message of yesterday’s posting, it indicates (in combination with the BFO value) a possible issue with the 19:41 BTO in the context of level flight analysis. What I fear is that if you drop the assumption that at 19:41 the level flight condition was (near to be) reached, the solution space becomes much wider.
@370Location
I’ve tried many different polynomials. Currently I’m using a third order polynomial fit to 2nd – 7nd arc BTOs. It would be interesting to write a short paper about different options and aspects/conseqences of polynomial fits; available time is limited..
@Niels
I did not say that your post yesterday mentioned an end point. I am aware of your work and your results. I thought your post added further insight to the proposal from @paul smithson and on the issue of “straight” or constant paths. @370Location also picked up on your post and related it to the FMT, waypoints BEDAX and ISBIX and his low and slow flight path to Cocos Island and beyond.
I agree with you that a BTO only approach is doomed to failure. A BTO and BFO approach is also inadequate. My proposal is to at least have a BTO, BFO, Fuel Range, Fuel Endurance and Fuel Options approach. Drift and Aerial Search probabilities (apart from being “yadayada”) can be the icing on the cake, in a combined probability approach.
I agree with you, we have little data as it is, so I am also not in favour of dropping any point. Instead of dropping any anomalies or outliers, we should explain them. For example, in our paper, we indicated that the larger BFOR at 19:41 is resolved, if a climb to FL390 was still being finalised.
@Richard. The difficulty I have with your approach is that it takes us back to areas that have already been searched. I, for one, place more weight on the null result of an undersea search than on the infallibility of BFO (whichever the derivative statistic).
@paul smithson
The difficulty I have with your approach is that it takes us back to square one, where we only had the BTO and maybe the BFO. I agree there is a perfect fit to a 3rd order polynomial on the BTO between 19:41:03 and 22:41:22 by removing 00:11, but you have to explain why there is a 348 µs BTOR at 00:11:00.
Looking at the 85 BFO data values between 18:39:55 and 00:11:00, I get a linear fit, where R^2 = 0.9991 and when I remove the data value at 00:11:00, I still get a linear fit, where R^2 = 0.9993. If there was something significant going on at 00:11:00, which the BTO picks up, why doesn’t the BFO pick it up?
I, for one, place more weight on a validated fuel model and the reliability of all the BTO and BFO data between 18:39:55 and 00:11:00, than I do on cherry picking BTOs for a polynomial fit or the ability of Go Phoenix in underwater searches.
@Richard. Each to their own. A thousand flowers and all that. Did you get a chance to verify whether my (example) path model is predicting BTOR and BFOR correctly for FL340?
@Richard,
Just for clarification, my work 6 years ago (Geeez, was it really that long ago), fitting a 3rd order polynomial to the BTOs was not at all related to trying to find a best-fit route. It was trying to determine the time of tangent position, or the time of the closest approach to the satellite. It was very obvious to me that the BTOs around 18:xx certainly did not fit the polynomial. Hence I concluded that the FMT must have occurred at some indeterminant point after 18:xx.
I order to help with the analysis I constructed an artificial point at a somewhat arbitrary time of 19:01, (40 minutes before 19:41), and reverse engineered the apparent BTO for that point so that it did sit very nicely on the 3rd polynomial. That did two things. It allowed me to determine the point of closed approach with a little more precision, and then to construct the speed hypothesis between 19:41 and 20:41. But I also hypothesised that the FMT might have been concluded by 19:01, and hence I needed a plausible path to get there.
By the way, I can’t see the point of modelling paths with constant Ground Speed. Wind makes a big difference, and I recall commenting on the blog in very early days that it might be possible to differentiate between possible paths using the wind to differentiate.
On another note… I sit here typing this in the very small hours NZ time, while recovering from yet another aortic valve replacement. Dejavu !! The old valve lasted only 5 years. The new one was done using the TAVI procedure. The technology is truly amazing, and recovery soooo much easier. Hopefully this one will last more than 5 years.
@Brian Anderson: I wish you the very best for a speedy recovery. The TAVI technology is amazing. I’ve never had one, but I have witnessed the procedure.
@paul smithson said: I, for one, place more weight on the null result of an undersea search than on the infallibility of BFO (whichever the derivative statistic).
Which is why it is important for all the sonar data in the vicinity of the LEP to be reviewed by experts. We need to better understand the completeness and the quality of the data. We have no doubt that there are areas near the LEP where there was no useful data collected.
@Brian
Went through the TAVR procedure myself about a month ago.
I don’t see the point of modeling the flight path at all, as I have said before. Any sensible person invoking decision theory would conclude that continuing the search North from 25S is the best option relative to minimax and entropy reduction (Victor’s opinion on a last ditch search operation is old school thinking).
@DennisW: So to be clear, you are advocating a search north of 25S independent of the quality and completeness of the sonar data near the LEP.
@Victor
Yes.
We can’t even agree on where the LEP is (or even a cost function) given the data we have.
@all
My horse is a little sore from being beaten, but I would like to suggest that most of the proposed paths would be eliminated by the requirement to propose a plausible path from the last known position at 18:22.
@Brian Anderson
Best wishes for a speedy and full recovery!
@sid. Why 1822? It might well be in the wrong place. Judging by the implied arrival 100s early at arc 1, it probably is (wrong).
@paul smithson
You asked at 06:17 am “In case you have time and inclination, I’d value your cross-check on the BTOR and BFOR for that path model”
You asked at 11:44 am “Did you get a chance to verify whether my (example) path model is predicting BTOR and BFOR correctly for FL340?”
The answer is no, not in the intervening 5 hours 27 minutes.
@victor. I fully endorse your recommendation for a further QA of the undersea search data at your indicated location.
@DennisW said: We can’t even agree on where the LEP is (or even a cost function) given the data we have.
I never expected 100% agreement. In fact, there is considerable interest in searching an area around 34.3S latitude. If it is shown that there are considerable holes in the data in that area, I think there would be even more support.
I think a difficult question to answer is which area to recommend if the data near 34.3S looks solid. Do we go north, south, or outwards? I don’t have a good answer at this point.
@DennisW
You stated “I don’t see the point of modelling the flight path at all, as I have said before. Any sensible person invoking decision theory would conclude that continuing the search North from 25S is the best option relative to minimax and entropy reduction (Victor’s opinion on a last ditch search operation is old school thinking)“.
So what is new school thinking?
(1) The BFO only tells us, MH370 went south and not north.
(2) The BTO is fictitious and was only faked to make it look like the SIO.
(3) Decision theory would conclude searching north of 25°S.
(4) ZS was a clever guy, who new at 18:29:15 he could head towards BEDAX and then head for Learmonth in Australia (YPLM). He knew if he shut the Right Engine down and descended to FL180, he had just enough fuel at LRC INOP to make it.
@Victor
I don’t disagree with your suggestion for the re-evaluation of any search data. What is missing is a plan i.e. who, when, where, criteria,…?
I don’t have any idea who looked at this data previously, what their qualifications were, or what criteria was used in deciding to continue North from 34.3S at the time. It is logical to assume that qualified people were involved, and made a reasonable decision. I place more weight on that than the UGIB (or anyone else’s) analytics.
Going South or outward has little appeal to me for many reasons.
@ paul smithson
18:22 is a concept. It is the last purportedly known radar location. If you pick the first ping that is a likely inferred location, but with some doubt in latitude. I am not necessarily hard over on a particular starting point and time in that vicinity.
@Richard
We have both been here a long time. You know my position on the ISAT data – it tells us the plane went South and came down rapidly at fuel exhaustion; it cannot tell us the latitude of the terminus.
My preference for continuing the search to the North is based purely on maximizing the information obtained from a negative search result – the same correct logic that Knuth used in crafting a mastermind algorithm.
As for you – “when the only tool you have is a hammer,…’
I have made a final update to the constant groundspeed great circle paths. This version was run on precise (1s) ping times and path step and I re-checked that that there was no better speed/azimuth combo for each. There are minor changes to the best-fit paths.
The net changes are:
– marginally lower speed (now 499.7 to 504.1)
– even more tightly clustered predictions of CPA time/BTO value and BTO at 1828 and 0011
– the close correspondence between the path-predicted extrapolations and the polynomial model extrapolations remains remains
Link is here
https://docs.google.com/spreadsheets/d/1rvlcFHyMemsrw8fBdkx2DM61k8tW5lpF_iYaPAudyDA/edit?usp=sharing
@paul smithson
Another GE back of the envelope…. (this time I hope I’ve got it right)
For example, your 185T path extrapolates back to a start location of 94.6, 10.948. Put a pin in the map there. Then put a pin in the map at a plausible location for the plane at 18:28. Somewhere near NILAM. Measure the distance from the first pin to IGOGU. Measure the distance from NILAM to IGOGU. The distance to your first pin from IGOGU is significantly greater than the distance to NILAM from IGUGU. You have to have a convoluted path to absorb the difference. Similarly, the implied linear distance from IGOGU for each of the azimuth cases will range from a shorter distance to a greater distance as the path azimuth decreases.
Funnily enough, the distance is probably correct for 186T path with minor correction for the path offset assumption.
Ultimately, I believe that your large BTO errors at 00:11 will be attributable to the average ground speed being 20kt too high.
@Sid. I’m not sure I follow.
@Paul
You just are not following along. Your analytics do not matter.
My imagination keeps wandering to a Far Side Cartoon with a bunch of geeks gathered under a banner – “10th Renunion of MH370 Analysts”. Drink in one hand, spreadsheet in the other. The only thing missing is a caption.
@Brian Anderson,
I too wish you the very best with your heart issues.
Please allow me a non-MH370 anecdote on this topic that’s very emotional for me, in hopes that it may help someone…
My father, now 95, was having issues a decade ago with dizzyness from low BP on standing or bending over. He got a pacemaker in 2012, and was doing well until 2016, when syncope blackouts were causing injuries from falls. In 2017, he had a TAVI (which is still functioning fine today) to help with the BP. By 2018, he was in serious decline and barely managed a walker between rooms, with repeated ambulance rides to the ER from extended blackouts.
Blood cuffs and even hospital BP monitors would give crazy readings. I got a Polar H10 chest band to check his ECG, and found that his heart rate never exceeded 90 BPM, and would drop below 50 when he tried to stand. Despite many objections about even questioning the doctors, I pushed to have the pacemaker tested. His cardiologist went into full CYA mode, declining to do a standing ECG because it was “too risky and not in the interest of the patient”. Later he refused all questions, and recommended a focus on final arrangements rather than the pacemaker. When he was again hospitalized, the manufacturer sent a rep that confirmed the pacemaker was functioning properly.
I traced the problems traced back to 2016 when the same cardiologist dropped the max rate to 90 BPM for unknown reasons. He probably did not realize that the only way this pacemaker could lower the rate (besides afib mode) was to skip a beat. Skipping every other beat dropped his heart rate to 45 BPM as soon as he exerted himself, causing him to pass out. Without exercise, muscle atrophy aggravated the condition.
If a misprogrammed pacemaker is causing unconsciousness and crazy BP readings, it might be possible to hack it into a safe fallback pacing by holding a magnet over it. I didn’t know that at the time. (And please consult a doctor before taking any risks.)
A new cardiologist and EP set a realistic upper tracking rate. Within two months he ditched his walker, and then the cane. Four months later he flew off to Florida to escape the cold. 16 months later, he’s back in Florida again, weathering the pandemic and still doing well for his age.
There were other solved complications with anemia and conflicting meds, also related to the take home message:
Sometimes it’s necessary to question the experts.
Corollary: Regardless of diplomacy, don’t expect them to be helpful to amateur sleuths.
Best Wishes again, Brian, for your continued recovery and health. And please All, stay virus-safe.
— Ed
Please excuse my gush. Back on topic…
Like Brian, I was only using the curve to estimate the time of closest tangent approach on the assumption of a straight path.
My point was that a 2nd order polynomial still has a good fit to arcs 2-5. A 3rd order polynomial should fit any four BTO points not just nicely, but exactly. Higher order polynomials can fit all the BTO exactly, but the sought extrema could be wild and meaningless. A spline could be fit to any series of BTO samples, but would also be meaningless with the minimum right at the 2nd arc.
Thus it makes sense to use the lowest order polynomial that still has a reasonable match.
I provide this info in support of various attempts to make a straight line fit, even though I have moved past that since 2018. I too was seduced by the apparent BTO appearance of a curve. Whether stated or not, I think it’s the first
basis for assuming a straight line path.
The assumption of perfect symmetry match except for winds and satellite motion falls short in my mind. Also assumed must be the straight line, a constant heading, constant speed, and possibly a flat earth (because I can’t easily visualize that projection with any precision). The match is more likely due to the low number of samples.
Coincidences do occur. The 17:07 and 18:28 BTO at known locations are clearly not on a straight path line but are still close to the 3rd order poly fit by reflection of the earlier points around a radial from the satellite through the IGOGU FMT.
Likewise, I believe that a turn was made at Cocos Island toward Christmas Island, and that coincidentally happens to be another reflection of a southerly path around a radial from the satellite to Cocos.
Second and third order polynomial fits for a straight path still have the 6th and 7th BTO coming late. That indicates to me that the plane either slowed after the 5th arc, or spherical projection of a straight for longer distances is a problem.
I must confess that my combined waypoint path does not utilize the perfect low altitude BTO null at the second arc, because that was dependent on a particular speed. Because anywhere on BEDAX-ISBIX is a close match to the 2nd arc, I instead used the overall time from FMT to 3rd arc and then Cocos to determine the speed. There surely would be a contrived path or speed change before the second arc that could make it perfect, but I didn’t see the need.
BTW, my BTO curve fitting and graphic plot were done in MATLAB, not a spreadsheet. so time steps didn’t matter.
I also wrote an iterative simplex solver that used proper GeographicLib geodesics and satellite motion in an attempt to converge on the BTO tangent with free variables for heading and speed. All to no good avail.
@Dr B.
With reference to our earier discussions on the drift models:
https://mh370.radiantphysics.com/2020/03/09/new-report-released-for-mh370-search/#comment-27946
Did you have any response from David Griffin regarding his drift model data south of 36.5S?
@paul smithson,
I have received new drift predictions from David Griffin. It is a different run than the previous data he supplied, and it goes from 22S to 44S starting latitude. This is for both flaperon and non-flaperon debris.
Some modifications to my software are needed to be able to combine the two data sets into one result from 0S to 44S latitude. We’ll update the drift probability curve in our paper when the new data are incorporated and verified.
@DennisW
You imagined “My imagination keeps wandering to a Far Side Cartoon with a bunch of geeks gathered under a banner – “10th Renunion of MH370 Analysts”. Drink in one hand, spreadsheet in the other. The only thing missing is a caption“.
The caption reads: “3rd Anniversary of MH370 being found by Ocean Infinity”.
@PaulS
Do you still need a 190 Path? You can make up a hypothetical straight path. In my “Straightness” essay I made up 180S and 187S paths. !87S was superior fit to BFO to Arc5. However, I currently favor active pilot to 30S and BFO drift as rationale for the “apparent” good fit to 187S.
@Dr B. Re updated drift model data. That’s good news and thanks for your commitment to update and extend the analysis. I will be very interested to see the result of that, including how it affects/extends the “probability of beaching in Australia” figure that you shared earlier (as % of all beachings, binned by latitude along 7th arc).
@TBill. I have no shortage of LNAV paths in the vicinity of 190! But if you would like to share with me what you think it ought to look like I am perfectly receptive.
@TBill. For ease of reference, can you share again the link to your straightness essay?
@PaulS
Link to- On the Straightness of the MH370 BFO vs. Flight Time Trend
https://docs.google.com/document/d/1d5_ZM6lfcgjVelP6k6RjPIvsZeOgDYtJXELYHDewg3k/edit?usp=sharing
@paul smithson
You have extended the straight path to a fictive starting point at 18:28. There is no turn included. But in order to get to the SIO there must be a turn.
The total distance traveled along any path need to be equal to that distance needed to get from the start to the end along the path.
Under the assumption that there is a turn, you should be able to reach the starting point near NILAM. If you measure the distance North of N571 on the straight path (for example) and use that distance to get from the intersection with N571 back to NILAM, the distances would be the same.
It would be easier to see if you used 186 and about 480kt.
@DennisW
I now understand most of your comments, if I understand you philosophical approach to this problem. You would rather search the unsearched area along the 7th arc even if there is a low probability of finding the plane so as to eliminate the area from consideration.
While this may be plausible in the abstract, it is impractical when the dollar cost and reputational costs are considered.
There is an acknowledged 10% chance that the plane is in the area searched, due to uncertainties in the coverage due to terrain etc. How does this compare with the un-searched area probabilities (excluding glide).
@DrB
Is it not possible to make the new drift data that you are using available to the blog?
@Richard
In rereading your post of 3May on a schema for selecting a route, it seems to me to regress from UGIA in which a LNAV route and LRC was used and the probability determined as the most likely scenario. A MRC at 0.84 is close to that route, and I am sure that an altitude can be determined so that the average ground speed is correct. There is little difference since LRC at 40000ft is very close to 0.84.
So, I cannot imagine that you would come to a conclusion other than that in the combination of your exhaustive study as extended by the UGIA paper.
@All
On the basis of path length (and fuel), routes further South necessitate an earlier turn after NILAM to reach the intersection with the 6th arc. Such routes a)may necessitate ignoring the BTO/BFO data at about 18:27. Under those circumstances a route at 186T proposed by @platt yields good results to a intersection at 29.12S.
Since most of the recently proposed routes ignore the route prior to 19:22 or 19:41, I can see no reason to exclude the route proposed by @platt. (It is somewhat inferior to the FMT route as it requires a slight climb (~250fpm) to bring the BFO into better agreement at 18:40).
There is sufficient fuel and the BFO/BTO errors from 19:41 onwards are acceptable.
@DennisW
@paul smithson stated: “If I understand correctly, your covariance discussion is essentially a demonstration of the rotational symmetry of the problem. As you shift the start latitude your best solution “rotates” around the closest point of approach to yield a new best-fit track angle”.
@sk999 responded: “It actually rotates about the 19:41:03 position, which itself slides up and down along the 7th arc as the track angle is varied”.
@DrB responded: “Neither explanation is correct. The best point of approximate rotational symmetry on the Earth’s surface is the sub-satellite point“.
To which, you stated: “I think all three descriptions are saying the same thing in different ways“.
I disagree!
These 3 analysts are not saying the same thing in different ways.
There is no rotational symmetry to the flight path of MH370.
(1) The point of closest approach is derived from a 3rd order polynomial fit to the BTO vs Time and is based on an arbitrary FMT location or start point of a flight path to the SIO. Depending on where the flight path into the SIO starts the time and location of the closest approach to the Inmarsat satellite changes, because the satellite is moving all the time. The Inmarsat 3F1 satellite was moving 2,412 km each day in March 2014 and moved 804 km between 19:41:03 UTC and 00:17:30 UTC on 7th/8th March 2014.
(2) The position at 19:41:03 UTC can vary between 16.0°N and 4.3°S. A MH370 flight path starting from say 14.0°N 91.3646°E at 19:41:03 UTC on a track of 180°T, at CM0.84 and FL400 ends at 00:17:30 UTC at 22.6°S. A MH370 flight path starting from say 4.0°S 93.2482°E at 19:41:03 UTC on a track of 180°T, at CM0.84 and FL400 ends at 00:17:30 UTC at 40.7°S. There is a difference of the average SAT of 0.61°C and the average ATW of 1.99 knots, between the two example flight paths, which were on the same track and at the same flight level and Mach speed.
The initial bearing can theoretically be anywhere from 157°T to 192°T and the SAT and ATW differences will change and be even greater. The flight level can theoretically be anywhere between FL350 and FL430 and the SAT will vary between -40°C and -61°C. In addition, the delta TAT will change the engine performance. The Mach speed may vary depending on the speed mode selected.
(3) The Arcs depict the points of equal elevation angle to the satellite and a MH370 flight path must path through each Arc (corrected for altitude) at the defined times. As Victor has pointed out, the rotational symmetry of the flight path is broken by the satellite inclination and the weather. As Bobby has pointed out the only approximate point of rotational symmetry on the earth’s surface is the nominal sub-satellite point on the equator at 64.5°E. In reality, this point varied between 1.6°N and 1.6°S, and 64.45°E and 64.58°E in March 2014.
@DennisW
You have variously described people in your comments on this blog as:
(1) coin operated.
(2) with no sense of history.
(3) no sense of past failures.
(4) short sighted.
(5) not following along.
(6) their analytics do not matter.
(7) geeks.
(8) hammer looking for a nail.
(9) presenting ideas of fantasy.
(10) with old school thinking.
(11) missing black swans everywhere.
(12) overwhelming.
You summarise your views of the analysts on this blog with the statement: “10 minutes of analytics show thousands of hours of analysis are very very (sic!) questionable“.
You ask: “Is this discussion really going anywhere?”
Many thanks for your words of encouragement!
I don’t mind that you disagree with me, but I find your rhetoric arrogant, condescending and unhelpful.
@TBill. Not to worry, I tracked it down at your June 4 2019 post. It was interesting to read. I’m glad that you discuss the fallacy of the linear fit BTO vs time that some seem to expect or even cite as evidence of straight flight. As you rightly point out a straight flight shouldn’t produce a straight BFO line at all, but a slightly bendy one.
Using a linear fit to observed values to guess what the C6 value ought to be at 23:14 (and implicit channel offset) is simply fallacious.
Even a linear interpolation between 22:41 and 00:11 produces errors of 1-1.5Hz in predicted BFO at 23:14 because BFO vs time is non-linear.
In my view there is strong indication in the MH370 data of a) bias shift b) bias drift in the MH370 data from 20:41 onwards. And if that is the case, then using BFOR, or BFOR-time correlation, or even BFOR variance from an unknown fixed frequency bias would not work for true path discrimination.
@Richard
I apologize.
I think you know that I have high regard for the thinking of most everyone on this site. I would characterize our differences as rooted in “perspective” not really “disagreement”.
Encouragement means nothing to me, and I forget that is not the case with others.
@DennisW
Many thanks for the apology. No worries!
I have a high regard for your views too, despite the fact that I disagree on many points. We do agree on the BTO and the fact that the only scenario that fits the observables is a terminus close to the 7th Arc. As you say: “The BTO is by far the most reliable data we have“. I also agree with you, that an active pilot and glide scenario is speculation, and signifies a wider search will likely not be required, but I have little evidence to exclude it entirely.
You have an allergy against the BFO, which I do not understand, but I do not have to understand everything. You struggle with the fuel model, which I find strange. You must know how much fuel your motorbike needs and what happens, when the tank is empty. You love statistics, but the weighting and generation of a probability density function is “a bit murky” to you.
You calculate the probability that MH370 is in our search area A1 is 36% and the probability of 33°S to 35°S is 60%. Yet you prefer to search northwards of 25°S. How do you know MH370 is further north? You believe the data simply does not constrain the terminus to an extent to be useful. You also hold the view that we have reached the limit to what can be extracted from the information we currently have.
We definitely both agree, that the Malaysian military radar and the 9M-MRO data from previous flights should be released. I am with you, regarding the fact that the political decision makers in Malaysia, knew what was going on and put up barriers between Malaysia and other states who wanted to help and between civil and military organisations in Malaysia. The ICAO report is damning of the involvement of Malaysian political entities at the highest level taking over the operational decision making and search/rescue direction. I agree that the Malaysian leaders would not have entertained a negotiation scenario.
We differ on the pilot murder/suicide scenario as you can see from the position statements, that you demanded from each of the co-authors, with non answers being ruled out. You do not understand the reason behind the satcom being switched off between IGARI and 18:25 and view it as a “drastic step with no apparent purpose“. When Victor explained that the excursion and subsequent stabilisation of the BFO values at 18:25 is consistent with a warm up, you dismissed it as serendipitous.
My investigation of a flight path to Learmonth, Australia was a genuine attempt to check, that there was sufficient fuel at LRC INOP to reach Australia and request asylum. I know it did not happen because the BTORs are horrendous, but it might have been the original plan. You are not the only commenter, who is in favour of heading in that direction to at least the Australian territories of Cocos Island and/or Christmas Island, which might also have been part of the original plan.
I am currently analysing the runway WeChat messaging again, to see what we can learn from that. As an expert in telecoms, you may be able to help me. As you pointed out, WeChat would have logged IP-address, time tag, data volume and caller SIM ID. Some of that detail is in the RMP report, but unfortunately not all. I am currently mapping the base transceiver stations from the Cell Global Identity (CGI) and the Service Area Identifier (SAI) for the 51 online accesses from ZS’s Nokia Lumia 925 on 7th and 8th March 2014 local time. All 51 online accesses where to Celcom Malaysia base stations with CGI identifier 50219. There were 12 different base stations used for connections. 10 connections for email, browsing, facebook and including 2 WeChat accesses were on 8th March 2014 between 00:00 and 00:40. MH370 pushed back at 00:28 and received take off clearance at 00:40. ZS took a lot of time out to check his messages during the pre-flight checks.
@Richard,
Simple things first.
The oscillator bias is a neither stationary nor ergodic. I challenged the DSTG computation of mean and variance. Their reply was a joke. You want to use BFO? Be my guest.
I have no issues with the fuel model. Not sure where you got that impression.
I am highly inclined to focus on results not effort. So far we have nothing.
@Brian Anderson. Above you said: “By the way, I can’t see the point of modelling paths with constant Ground Speed. Wind makes a big difference, and I recall commenting on the blog in very early days that it might be possible to differentiate between possible paths using the wind to differentiate.”
In the link below, you will see how wind variations make a surprisingly small difference to the BTO residuals as long as the period mean remains the same.
When we fit a path from Arc 2 with BTOR=0 to Arc 5 with BTOR=0 we have, in effect, fixed a groundspeed for that starting point and track angle. Now, maintain that same start position, track angle and mean groundspeed, but see what happens when we introduce some groundspeed variation along the way. The simulations show the effect of winds varying +/- 2.5kt, +/- 5kt, +/- 7.5kt and with different profiles (down, up, up-down, down-up).
BTOR at start and end point remain unchanged because we have kept the same mean groundspeed. The effect on BTOR for intervening arcs is rather small, even for quite large wind variation. Do we have any reason to believe that wind variations Arc2-5 were substantially greater than those illustrated at any altitude? I could run another simulation with winds +/-10kt but you can already see how little difference it is going to make.
https://docs.google.com/document/d/1uuKOxrciLp2wfz-55wo3pl0qdoYbVyzuIjKh0JRPfp8/edit?usp=sharing
I would agree that the constant groundspeed assumption would be problematic if we believed the true path speed mode was LNAV rather than constant M. Or if we have very much larger variation in groundspeed due to wind/temperature, particularly with monotonic profile. It also causes much larger distortions on a cumulative basis over several hours. However, for a constant M mode, over the period Arc2-Arc5 where (at any altitude) speed variation is quite modest, it seems to me that constant groundspeed models provide a very effective approximation because by fitting for BTOR=0 at start and end we have effectively captured the mean groundspeed required over the whole period.
Would you agree, or do you still see “no point” in modelling constant groundspeed paths?
I join others with sincere wishes for your speedy recovery.
Correction.. if we believed the true speed mode was LRC…
@paul smithson: I think a better test is to see if adding the true wind field improves the BTO fit for arcs 2 – 6, inclusive.
@PaulS
“In my view there is strong indication in the MH370 data of a) bias shift b) bias drift in the MH370 data from 20:41 onwards. And if that is the case, then using BFOR, or BFOR-time correlation, or even BFOR variance from an unknown fixed frequency bias would not work for true path discrimination.”
That is also my current thinking. We are letting straight flight hypothesis overrule the data, which suggests BFOR drift downwards. The fact that BFO fits so well for 187 South, is just because the BFOR drift makes 187S artificially look good. However, the fact that BFO fits so darn well for 187S (to Arc5) suggests there is not much scatter in the BFO data (to Arc5) except there is some drift ( I believe). If we accept the BFOR is drifting downwards, I think it probably implies active pilot flight.
@victor. Certainly that is essential to test an actual path model inclusive Wx. What I am trying to point out is that a constant groundspeed model should produce a very good appromimation to othe “true path” if wind variation is relative small.
Now, this would not be of any particular interest except that it transpires that the constant groundspeed creat circle path that starts on Arc 2 and ends on Arc 5 produces a perfect match to the BTO vs time function. And because of the rotational symmetry, you don’t even need to know which particular track angle.
It seems to me that this provides compelling evidence that the “true path” was a great circle, with CPA at 11482.x at ~19:53:xx and that it had a mean groundspeed over this period in the region of 500-505kts.
If all of this is true, then the actual true path needs to scrub that 350 excess BTO before you reach Arc 6. You could do that with a change in direction, or a change in speed. In the case of the path models I am advocating, the wind and temperature does that for you, providing the required ~30kt mean reduction in groundspeed over the last 90 mins to reach Arc 6 with very close BTO fit.
@Victor. A constant mach TT should be pretty close as well but not quite as good a match as great circle. I’ll do a simulation of TT as well to see how big the difference is. But (as path modellers have found) you are not going to get a match with HDG(T) or HDG(M) or TRK(M) unless you had an extraordinary coincidence of path and environmental conditions that conspired to provide a perfect mimic of a GC’s BTO f(t).
@paul smithson: It would be interesting to use your methodology on arcs 3-6, inclusive, rather than 2-5.
Recalling the adage involving grandmothers and eggs, I do realise that the IG (in fact everybody who cared to look) came to a similar conclusion back in 2014, before the far south lost its shine. So I shall not labour the point any further.
@DennisW
You stated: “I have no issues with the fuel model. Not sure where you got that impression“.
You previously commented “I still struggle with the fuel model issue“.
Please see: https://mh370.radiantphysics.com/2020/03/09/new-report-released-for-mh370-search/#comment-27647
@TBill
At the risk of opening up an old and contentious aspect of the BTF bias, let me refer you to the Inmarsat paper or the following:
https://www.dropbox.com/preview/Public/research%20note%20feb20.pdf?role=personal
Whether or not you accept my analysis of the overall satellite translation oscillator effect, you can see a strong influence of the eclipse effect.
Depending on how you have accounted for the effect at 20+UT, the bias is indeed time varying. But you will note its strong exponential character which is characteristic of the somewhat impulsive cooling during the eclipse and the thermal lag in heating once the sun again shines on the satellite.
BTF=BFO
@Sid. Please check the url.
@Richard
Thanks for locating my fuel model post. It sounds just like me :-), and the comment is a good one IMO. My intention at the time was to contrast the fuel range presumably estimated by the aircraft manufacturer with the fuel range estimated by a group (albeit a very bright group) of individuals with no pedigree in Boeing 777 fuel range estimation.
I say presumably above because the DSTG did not make Boeing’s involvement explicit. However, it is acknowledged that the DSTG had unfettered access to both Boeing and a significant amount of prior, and still unpublicized, Inmarsat data. I also made mention of the descent kernal in the DSTG book which is another example of data unlikely to have been created by the DSTG.
I did stop short of endorsing either range estimate.
https://www.dropbox.com/s/r6116cju52lfo3g/research%20note%20feb20.pdf?dl=0
Sorry. It opened for me..I created a new link…
@Sid Bennett
Victor, Bobby and I have been accounting for the eclipse effect in our flight models since 2014.
It is not a contentious issue, it happened and we can measure the effect and account for it completely.
@DennisW
In 2015, DSTG did not account for fuel. They state in section 8.3 Assumptions on page 58 “Infinite fuel“.
“Section 8.3 (4). Infinite fuel: the fuel constraints on the aircraft can be applied to the pdf after- wards. In the simplest case, maximum reachable ranges could be used to censor impossible trajectories. However, analysis of candidate trajectories has indicated that the majority are feasible. Broad information about the fuel consumption rate of the aircraft has been used to inform the range of allowable Mach numbers“.
Since 2015, we have come a long way. In our paper, we have presented a fully validated fuel model based on engineering data kindly supplied by ATSB from a previous 9M-MRO flight.
@Sid Bennett: Any frequency drift of the satellite oscillator is already included in the BFO calculation, and has zero effect on the BFO. What we don’t know is the frequency drift of the SDU.
This is not a contentious issue. It was resolved 6 years ago. Do we really need to re-visit it?
[After submitting this comment, I see that Richard had an almost identical response that he submitted prior to mine.]
@Richard
Yes, that was my take on it as well i.e. they “qualified” trajectories after the fact. No one, to my knowledge, has contested your fuel model. Frankly, I find that rather odd, but it is what it is. Certainly Boeing has no history of commenting on this blog.
@Richard, @VictorI
Please note that the post was directed to specific comments made by @TBill.
I believe that I and UGIA end up performing a very similar BFO adjustment. While the BFO is a less sensitive characteristic of the path, the inclusion of the BFO helps to sort out some of the implausible paths proposed. As such any suggestion that the BFO is not relevant should be resisted.
@Sid Bennett
You stated “Please note that the post was directed to specific comments made by @TBill“.
Your comment is in the public domain and anyone can respond as they wish, especially when your comment is misleading. If you want to have a private discussion with @TBill, then use another communication form.
I have to ask you, why are you stirring up old issues?
I have to ask you, why not focus your efforts on correcting your model?
@DennisW
Boeing do not comment officially on this blog, but we have received helpful input from a former Boeing employee.
@Victor and Dr B.
I mentioned yesterday my impression of BFO bias drift. The attached sheet with chart shows why. If the chart doesn’t render correctly in your browser, please download and open the sheet.
https://docs.google.com/spreadsheets/d/1iXfFK8zR3N8Q9JPV3pSVAT_ie9Cu5rSGK9zvlB9SyA0/edit?usp=sharing
All of the LNAV paths that I have looked at show clear trending behaviour in the BFO residuals. Do other path solutions do this too (even the ones considered to be “better behaved” with regard to BFO)? If they do, is this not prima facie evidence of bias drift? If they don’t, would someone please explain to me what has to happen (speed/heading) to successive positions along a straight-ish, level altitude flight in order not to exhibit such a trend?
1941 BFO should be largely insensitive to assumptions on latitude (within reason), speed, heading. Yet the predicted 1941 BFOR of this 20-degree track angle range of paths is clustered stubbornly around the -7Hz mark. Unless we resort to assuming a climb, is this not prima facie evidence of a shift in the FFB compared to the baseline?
@paul smithson said: 1941 BFO should be largely insensitive to assumptions on latitude (within reason), speed, heading.
First, you are confusing track and heading.
Second, I think you are implying that when the L-band Doppler shift is near zero, the BFO is insensitive to speed and track. That’s not true, due to the SDU pre-compensation. The BFO will still be sensitive to the north-south component of lateral velocity due to the (incorrect) assumed position of the satellite at 19:41.
@victor.
1. I understand the difference between track and heading.
2. Do you dispute the trended behaviour of BFOR? Perhaps I have miscalculated them? I used Barry’s spreadsheet, with Ffb reset to 149.86hz and observation-specific adjustments removed.
3. Do you dispute that BFOR at 1941 is largely insensitive to path model assumptions excepting non-zero rate of climb?
4. If you don’t, how is the apparently large deviation explained?
@Victor
The DSTG makes the same speed-heading misnomer in their Figure 5.7 :-).
To Paul’s point the sensitivity to speed and track is relatively subdued. Also I think their example is too far South.
https://photos.app.goo.gl/gNPc6DabH3kqBCjQA
@Richard. Since Bfo is so clearly understood, would you also venture to comment on the quandaries I have posed?
@Paul,
As Richard stated previously to Sid Bennett – Your comment is in the public domain and anyone can respond as they wish
I do have a response. Your question is equivalent to asking someone to comment on the path of a random walk.
@Richard
When commenting on a blog post directed to a specific person, it would seem appropriate to make the comment in the context of the discussion. I did not bring up the issue of BFO drift.
In this context, I would welcome your explanation of p11 item 5 and p25 Item 10 in UGIA.
What is evident from the Inmarsat paper itself (when the figures are digitized so that they can be inspected more carefully), is that the change in offset frequency due to the eclipse is large and quite abrupt in onset, and has a long tail. The correction used by ATSB et al is quite crude compared with the actual data. I am sure it was thought to be “good enough” at the time.
@DennisW
Without understanding the mechanism, a small collection of data may seem to have a random character due to undersampling.
@paul smithson: At 19:41, for a given position, the BFO varies with the N-S component of speed. I think we can agree this is the case.
You’ve presented that for a variety of paths that closely match the BTO values at arcs 2-5, the BFO at arc 2 is nearly constant. Without some investigation, I can’t explain what is occurring, other than to observe that near 19:41, the range is near a minimum and the satellite declination is near a maximum.
I don’t think we’ve ever said there was no drift of the BFO bias. In fact, Bobby went through some effort to quantify what was previously observed.
@Sid Bennett said: The correction used by ATSB et al is quite crude compared with the actual data.
This makes no sense. The correction is the measured frequency error, with or without the precisely known C-band and L-band Doppler shifts, depending on how the data is presented.
@victor. Thanks for the response.
Richard wrote “I am currently mapping the base transceiver stations from the Cell Global Identity (CGI) and the Service Area Identifier (SAI) for the 51 online accesses from ZS’s Nokia Lumia 925 on 7th and 8th March 2014 local time.
Does your source for Malaysia MNC’s list LAC & CellID 26B8602?
I’m good for location of the other 11 base sites.
Can it be assumed that the ordering of tabulated data at Appendix A-16 of Folder 4 is time order?
@paul smithson
Yesterday you wrote:
“.. it transpires that the constant groundspeed great circle path that starts on Arc 2 and ends on Arc 5 produces a perfect match to the BTO vs time function. And because of the rotational symmetry, you don’t even need to know which particular track angle.”
I noticed you do not use round track angles; it seems you use specific angles close to the round (5 degrees) numbers. Is there a reason for this / why not use the round numbers?
Hi Niels. That’s because the start points I used on the 2nd arc are simply a list of lat/long positions from Barry Martin’s path tool “BSM 7-9-4” (aqqa.org) sheet PE. And then selected the start positions that produced paths closest to 5 degree interval. You could equally use the track angle that corresponds to a perfect tangent at ~19:53:30 along a virtual ping ring BTO=11,482.5 and you should end up with the same answer. Now that we have derived the latitude/track angle function, it should be simple to find the latitude that corresponds to a particular track angle of interest.
Re tangent to CPA, it’s clear from the geometry that the precise BTO value (to within a few microsecs) of this ring should not be material to the track angle that you will find – in 2D equivalent, it simply moves in and out (marginally smaller/greater radius) on a set of nearly concentric circles. The 11482.5 is simply the common CPA from this data set. If the 20 microsecond quantisation was “rounding down” BTO figures that would have been, say, 5 microseconds higher rather then the CPA ring would be different by that amount.
@Sid
@PaulS
Thank you. That link is a little over my head, except I assume the reported BTO/BFO for MH370 is almost “beyond reproach”…in other words, many experts including those here, have refined the BTO/BFO data to the greatest extent possible. BFO bias drift is the major unknown.
For me, BFO is highly important. It is all we have to say where MH370 went on the Arcs, except we do also have the pilots home simulator study.
However, I feel the raw BFO reading probably must be corrected.
The “corrected BFO” data, normalized for estimated bias drift from start of flight, might look something like this:
BFO Actual/Corrected
Arc2 111 109
Arc3 141 138
Arc4 168 165
Arc5 204 200
Arc6 252 247
Now then, with this minor transformation, we can see the 180S path is superior BFO fit compared to 187S. Additionally, if I have my +- signs correct, I feel the 247 BFO at Arc6 is more consistent with the home simulator path Arc7 “cross” point.
Estimated BFO bias correction:
(assuming BFO bias shift of 5 units over flight from 16:42 Take Off)
Arc2 -2.0
Arc3 -2.7
Arc4 -3.3
Arc5 -4.0
Arc6 -5.0
@TBill
As I understand you latest post, all of the “corrected” values are based on some assumption. such as the bias shift of 5 Hz over time. What you are assuming is that the 180T path proposed by UGIA is a) correct and b) the only path.
When I model paths such as the last leg from 19:41 to 00:11 on 180T I get comparable results to UGIA. When I model a path from 18:40 or 19:41 to 00:11 0n 186T I get comparable fits. The BFO bias is unchanged.
Why not choose 186 rather than 187? Why not model the 186 path from IGOGU at 18:38:45 or so? Some people seem to be allergic to the concept.
@paul smithson
Thank you, Paul. So for each arbitrary track angle chosen you tune initial position on 2nd arc as well as the value of (assumed constant) GS, and then find near perfect fit with subsequent three BTO values.
You would expect the fit “always” (for arbitrary speed profile and navigational mode) to work for two subsequent BTOs, not necessarily for three.
To enter into the discussion about rotational symmetry as part of the explanation: did you have concentric ping rings in mind / how do you define it on a non-sperical earth and with a sub-satellite point wiggling around the equator?
Or did you mean it as part of the “observation” (“it works” for arbitrary track angle?)
@DennisW
You stated “What is currently being under-considered, IMO, is significant peripheral information: > A ZS WeChat moments before takeoff with an unidentified recipient (false ID SIM purchase)”.
The phone calls, sms, emails and on-line activity of the pilot and co-pilot have received a large amount of scrutiny. Their on-line activity included Facebook (and its associated Facebook Messenger), YouTube, WeChat, Instagram, Twitter, WhatsApp, Pinterest, CamFrog and more. The RMP report includes extensive details of all communications, mostly sourced from the FBI.
There has been significant discussion and much speculation on this blog and elsewhere, regarding ZS’s WeChat last log-in activity, which was recorded at 00:40:02 UTC, just 1 minute 19 seconds after Runway 32 Alpha 10 line up clearance at 00:38:43 UTC and 36 seconds before departure clearance at 00:40:38 UTC.
Speculation
Speculation is rife, regarding the nature of this WeChat communication. In 2014, Simon Parry of the UK Newspaper “The Mail on Sunday” turned the WeChat message into a phone call with a mystery woman, which the Malaysian Police promptly denied. Nevertheless, the rumour generated a life of its own and has meanwhile been written into the history books and will not go away.
“The captain of missing Malaysia Airlines flight MH370 received a two-minute call shortly before takeoff from a mystery woman using a mobile phone number obtained under a false identity” Simon Parry reporting from Kuala Lumpur for the Newspaper “The Mail on Sunday” – 23rd March 2014.
“Police Inspector-General Kahlid Abu Bakar on Monday dismissed reports in Britain’s Mail on Sunday that police were investigating a call senior pilot Zaharie Ahmad Shah made on his mobile phone shortly before the plane took off from Kuala Lumpur” Sydney Herald Newspaper – 24th March 2014.
“However, more suspicion fell on Captain Shah when it was then revealed that he had take a mysterious two-minute phone call in the cockpit, minutes before the plane took off. The call came from an unknown woman and was made from a pay-as-you-go SIM” Nigel Hawthorne – MH370: The secret files: At last? The truth behind the greatest aviation mystery of all time – 26th May 2016.
“In 2014, authorities first investigated a mystery woman who made a two-minute phone call to the captain of MH370, Zaharie Ahmad Shah, shortly before the plane’s take-off, using a pay-as-you-go SIM card that was obtained under a false identity” – Sun Newspaper – 6th January 2020.
Facts
(1) ZS had a Nokia Lumia 925 4G LTE with Malaysia Celcom and had the device with him on the day of departure of MH370. The co-pilot had an Apple iPhone 5S 3G UMTS with Malaysia Celcom. The co-pilot also had a Blackberry, but the iPhone was with him on the day of departure.
(2) ZS had 51 on-line activities on his mobile at the airport before the MH370 departure. The co-pilot had 149 on-line activities on his mobile during 7th March 2014 and on 8th March 2014 before departure.
(3) ZS had his mobile switched off during the day and only connected when he arrived in the airport area. By comparison, the co-pilot had his mobile on all day at home, when travelling and at the airport.
(4) ZS logged-in to WeChat at 00:40:02 UTC whilst MH370 was lined up on Runway 32R and waiting for take off clearance.
(5) The WeChat message at 00:40:02 UTC was a standard instant messaging text exchange with 754 bytes upload (ul_throughput octets passed) and 967 bytes download (dw_throughput octets passed).
(6) ZS logged-in 4 times to WeChat at Kuala Lumpur International Airport before the MH370 departure. 3 WeChat log-ins had identical data transfer upload and download size as (5) above. The 4th WeChat was slightly larger. By comparison, the co-pilot logged-in 2 times to WeChat, once at home with a much larger data transfer and once at the airport with only 40 bytes upload and 314 bytes download.
(7) ZS had 47 contacts on WeChat and all individuals are identified by an identity card number and all companies are identified by a company number.
(8) It is not possible to say with whom ZS communicated, as WeChat refused to disclose which contact(s) were involved.
(9) Both ZS and the co-pilot kept their mobile phones on and connected after boarding MH370. The co-pilot disconnected during push back and engine start. ZS kept his mobile connected until departure. The co-pilot was only connected via one Service Area ID (SAI) after 00:00 UTC on 8th March 2014 for 5 different on-line activities. ZS by comparison was connected via 3 different SAIs at the terminal, whilst taxiing and whilst holding at the runway for 10 on-line activities.
(10) ZS logged-in to his webmail twice, WeChat twice and FaceBook once after 00:00 UTC. The co-pilot sent one iMessage.
(11) All mobile on-line activity of both pilots is listed in the RMP report, which in turn is based on a report from Celcom. The Celcom report includes the full Mobile Country Code (MCC), Mobile Network Code (MNC), Local Area ID (LAI) and Cell ID (CI) for each activity. The MCC is always 502 for Malaysia. The MNC is always 19 for Celcom. The SAI comprises the LAI and CI.
@paul smithson,
You said: “What I am trying to point out is that a constant groundspeed model should produce a very good appromimation(sic) to othe “true path” if wind variation is relative small.”
If the wind variation is small, which it is not early in the SIO route for all track angles, and which it is not late in the flight at track angles greater than 180 degrees, then a constant ground speed assumes a constant TAS. But the TAS will vary for all speed settings when the SAT varies along the route, and it will also vary when the speed setting is not a constant Mach.
Modeling a constant ground speed ignores the local weather, and the effect on speed along the route is not negligible. So, what is the point of assuming a constant ground speed path, when we know that generally can never happen over the SIO.
You also said: “All of the LNAV paths that I have looked at show clear trending behaviour in the BFO residuals. Do other path solutions do this too (even the ones considered to be “better behaved” with regard to BFO)? If they do, is this not prima facie evidence of bias drift? If they don’t, would someone please explain to me what has to happen (speed/heading) to successive positions along a straight-ish, level altitude flight in order not to exhibit such a trend?”
You also said: “1941 BFO should be largely insensitive to assumptions on latitude (within reason), speed, heading. Yet the predicted 1941 BFOR of this 20-degree track angle range of paths is clustered stubbornly around the -7Hz mark. Unless we resort to assuming a climb, is this not prima facie evidence of a shift in the FFB compared to the baseline?”
Please refer to our plot of BFORs given in Figure F-1 in our paper. First, it is possible the 19:41 BFO is affected by a slight ROC; it appears to be somewhat of an outlier. Ignoring that one BFOR, then (taking the BFORs from Figure 16 in our paper), from 20:41 to 22:41 the BFORs are -1.9, -3.0, and -3.8 Hz. That is only 2 Hz peak-to-peak, which is consistent with just the random read noise and no major ongoing drift. The BFOR we get at 00:11 is -1.4 Hz, which is only about 1.6 Hz higher than the average of the previous 3 BFORs. That BFO reading at 00:11 may just be a little low due to random noise, causing the BFOR to be a little higher than average. So, excluding the 19:41 BFOR (for which we get -6.6 Hz), we don’t see any trend after that, outside the expected reading errors, between 20:41 and 00:11. The mean value is slightly negative, so there may have been a 2-3 Hz drift in the BFO bias compared to the calibration we did at the gate. That is certainly reasonable to expect, given the drift seen over the previous 24 hours and shown in Figure F-1.
I think the primary reasons you are seeing a “trend” in BFORs are the slight ROC at 19:41 and a slightly “below-average” BFO measured at 00:11 due to BFO noise.
In your worksheet, you say: “BFOR should be nearly insensitive to aircraft speed and track angle near the closest point of approach.”
This is not generally true for the BFOs, because of the incomplete Doppler compensation due to the satellite’s non-zero declination.
You asked Victor: “Do you dispute that BFOR at 1941 is largely insensitive to path model assumptions excepting non-zero rate of climb?”
Yes. As has been recognized for many years now, and as Victor pointed out, the BFO is sensitive to the N-S component of the the aircraft ground speed. To maintain a fixed BFO requires that the ground speed increase with tracks away from 180 degrees, by the secant of the track angle. Alternatively, with a fixed ground speed (as you have assumed), the BFO will vary as one increases the track further from 180 degrees. For the true route, the BFORs are mostly random noise plus possibly some OCXO frequency drift plus and possibly some vertical ROC at 19:41. There is no reason why this should also be true for routes other than the true route, because erroneous routes will have systematic BFO errors which add to those three effects.
@Richard
Thx. Nice work.
Dr B, thanks for the detailed response.
@paul smithson
You asked: “@Richard. Since Bfo is so clearly understood, would you also venture to comment on the quandaries I have posed?”
I am not sure I can add anything to that which Victor and Bobby have already commented.
@Don Thompson
You asked 2 questions:
(1) “Does your source for Malaysia MNC’s list LAC & CellID 26B8602?”
(2) “Can it be assumed that the ordering of tabulated data at Appendix A-16 of Folder 4 is time order?”
Both questions are, as always, very perceptive.
Celcom is the oldest mobile provider in Malaysia and has been through several generations of renumbering schemes for both Local Area Identifiers (LAIs) and Cell Identifiers (CIs). It is therefore difficult to track the exact status in March 2014. Some SAIs have an extra digit, which I understand was due to the inclusion of a direction indicator for the transceiver mast (0 = Omnidirectional, 1= bisector or trisector one, 2 = bisector or trisector two, 3 = trisector three).
A comparison of the ZS 4G with the co-pilot 3G data is also, only of limited use, even when we are sure that both their mobiles were connected to Celcom at the same time and in the same location.
To answer your specific question about the SAI “26B8602”, there are 5 occurrences of ZS on-line activity via this SAI, of which 4 are after 00:00 UTC when on board MH370. One occurrence was before midnight, so I assume this was also after boarding. Pre-empting your second question, the connections via SAI “26B8602” are interleaved after 00:00 UTC with connections via SAI “04942F99”, at the same location and in the same timeframe. I therefore concluded that the SAI “26B8602” were in adjacent locations.
In answer to your second question, I went backwards and forwards on how the lists were ordered. At first, I assumed that for each date the lists for pilot and co-pilot were in time order. Then I thought the lists were ordered by the type of communication. Finally I decided the lists for each date were in time order. The co-pilot data helped to convince me, as the first 20 connections on 7th March 2014 were almost exclusively within one SAI “0457317C”, at a ‘home’ location with use of “Siri” and a longer “CamFrog”. The conclusion that ZS did not have his mobile switched on until reaching the airport area also helped, as ZS had 30 connections in LAI “0494” and 38 connections if you include adjacent LAIs, all in the airport area.
How do you interpret the Celcom data?
@richard. Thanks, fair enough.
@paul smithson
I had a closer look and I can indeed more or less reproduce your results for 180 deg track assuming constant M=0.84 – 0.85 at FL350 . Apparently variations in wind and temperature are small in the first hours after 19:41 along the track, or at least tend to average out. Note that at FL350 with constant M the BTO errors are dramatic for arc 6 and 7 (for optimized fit towards arcs 2 – 5), and are difficult to optimize overall.
What you’ve found could be a reflection of the “true path” having a (leg averaged) constant GS appearance from arc 2 – 5, however possibly at different longitude and FL than you found. Note that a near “flat” M profile (constant M for decreasing weight) is also present for LRC at higher FLs and that the proposed path by Ulich et al. at FL390 ending near S34.4 has an M with only small variation near 0.84 (between 19:41 and 00:11).
At higher FLs (around 400) winds and temperatures along the path apparently develop such that (near) constant M can give an overall good BTO fit for the 180 deg track for arcs 2 – 6. I haven’t looked systematically at other track angles yet for M=0.84 in combination with the higher FLs, however I quickly found a good overall BTO fit for 185 deg CTT, FL410 and M=0.84.
Hi Niels. Thanks. Yes, I had also remarked on the excess BTO at arc6 for constant speed lnav paths. This is seen throughout the range of this path model family and is also predicted to the same magnitude by the extrapolated polynomial fit to our arc2-5 BTO datapoints.
This path type is, I believe, too fast for LRC/MRC/CI speed modes. And M0.84 at FL390 is a whole lot slower than the same M at FL340 ISA+11. In fact I think most would argue that they are simply too fast full stop and you would not expect fuel endurance through to 0017. Ah well, ho hum…
@Richard
When you say, ‘ZS logged-in to WeChat at 00:40:02 UTC …’, what do you mean by that?
From what I’ve seen of the WeChat app once it is loaded to your phone, the app ‘logs in’ when the phone is turned on and then continues to run in the background.
When you say, ‘The WeChat message at 00:40:02 UTC was a standard instant messaging text exchange with 754 bytes upload (ul_throughput octets passed) and 967 bytes download (dw_throughput octets passed).‘ how do you know that that 754/967 byte up/down exchange is a ‘standard instant messaging text exchange’?
On the basis of that we see that 754/967 byte up/down exchange each time the phone connects to a different SAI subsequent to the initial connection to 5021904943C88 might we not be looking at something more mundane like a reconnect?
@Niels said “So for each arbitrary track angle chosen you tune initial position on 2nd arc as well as the value of (assumed constant) GS, and then find near perfect fit with subsequent three BTO values.” Not quite. I am not shifting the Arc 2 position. The position on Arc 2 is a fixed lat long that has BTOR=0 (ie BTO=11500) – it is only the bearing and speed that is being “tuned”. I took the positions along arc 2 from Barry Martin’s ping ellipse sheet.
Let me try and clarify again what I did. Start at any position on Arc 2. Determine the speed and azimuth settings that give you minimum BTOR RMS 2-5 inclusive (or 3-5, since the Arc 2 BTOR by definition is zero).
To do this, you need to determine roughly what the right angle is. Start with coarse angle steps (eg. 5 degrees) and find the speed that gives you RMS min for each. Then narrow down further to 1 degree steps, 0.5 degree, 0.2, 0.1, 0.05, 0.01 degree steps. So you zoom right down to the area of interest, then iteratate bearing/speed pairs until you find the absolute optimum. It is quite tedious to do by hand. Each time you alter the track angle, you also need to optimise speed as the optimum will always be a unique pair.
Although in theory there might be an even better optimum if Arc 2 was also allowed to float instead of being fixed at zero, I have not found any example where it makes any appreciable difference and you still end up with BTOR <<1 at 1941.
Finally, on nomenclature. We should probably refer to initial bearing rather than track angle since on a great circle the actual bearing is changing as you move along the path (except 180 and 000). So a round-number initial bearing of 175.00 at 1941 is only a round number for that particular point in the path.
@Mick Gilbert
You asked:
(1) “When you say, ‘ZS logged-in to WeChat at 00:40:02 UTC …’, what do you mean by that?”
(2) “When you say, ‘The WeChat message at 00:40:02 UTC was a standard instant messaging text exchange with 754 bytes upload (ul_throughput octets passed) and 967 bytes download (dw_throughput octets passed).‘ how do you know that that 754/967 byte up/down exchange is a ‘standard instant messaging text exchange’?”
In the RMP Report Appendix J-1 on page 7 you will find the statement “Zaharie Last WeChat Log In at 00:40:02 8/3/14“.
There is a WeChat app setting to allow/disallow pop up notifications. There is also a mobile setting to allow/disallow WeChat pop up notifications.
The six WeChat communications by ZS and the co-pilot are categorised by Celcom as IM or Instant Messaging. WeChat supports a large variety of instant messaging including text, voice, walkie talkie, stickers, photos, videos, profiles, coupons, lucky money and GPS locations. Three of the ZS WeChat messages including the one on the runway were 754 bytes upload and 957 bytes download. One earlier message was 806 upload and 1367 download. The first co-pilot message at home was 7004 upload and 16401 download. The second co-pilot message at the airport was 40 upload and 314 download.
We do not know whether these were push or pull communications, or what the mobile and app settings were on each mobile for pop up notifications.
I concluded from the small data transfer size, that the messages were a simpler format such as a text message with one exception being the first co-pilot message which was much larger and could be a photo message.
I concluded from the fact that three small messages from ZS were all exactly the same size, that these were a standard message, such as check for messages.
I used the term “Log In” only as it was used by the RMP. I guess they meant something like check for messages.
I also concluded from the timing of the runway WeChat communication between runway line up clearance and take off clearance, that there was not much time to do anything more than check for messages.
@Richard
Okey doke, thank you. I’ve always found that ‘log in’ language from the RMP report a bit odd because near as I can determine once you have installed WeChat on a phone the user doesn’t log in in the normally accepted sense (as in entering user credentials).
The uniformity of those 754/967 byte up/down exchanges and the fact that they seemed to occur each time the phone connected to a different SAI struck me as curious. Would you expect a messaging app like WeChat to perform some form of ‘reconnection’ exchange as the user’s phone moves from cell tower ro cell tower?
@Richard said:It is not possible to say with whom ZS communicated, as WeChat refused to disclose which contact(s) were involved.
I think there is a strong possibility that the Chinese government knows the details of these communications. Remember also the claims that the Chinese hacked into the computers of the Malaysian investigators in the days following the disappearance.
@Victor
Re: WeChat
Hearsay I know, but here was a (an apparent Chinese) visitor on Twitter a few months ago suggesting he knew the WeChat content and suggesting it was innocent. That person was defending ZS. I was hoping we’d hear more by now but we have not heard more. Those Tweets may have been deleted as I can no longer find them.
@Sid
” What you are assuming is that the 180T path proposed by UGIA is a) correct and b) the only path.”
No Sid I have always had active pilot hypothesis. I like the home simulator general path. I do favor 180S as an approximation for how the flight south got started. Since BFO fit is the most important factor to me, I was mesmerized by the perfect BFO of the 186S path to Arc5. But I got over it.
The 180S path, depending on how one models it, has about BFO=200 for Arc5 vs. 204 measured. I was very bothered by that. Additionally the Arc3/4 BFO’s error on the low side too. Now I feel that low-side residual error is the approximate drift of the BFO bias.
@Victor, @TBill,
I am absolutely convinced (with evidence) that the Chinese Government has the data that we are interested in, regarding the WeChat communication on the runway at 00:40:02 UTC.
I did not want to raise that particular (rather thorny) issue with my comment.
It does not surprise me that someone in China claims to know, that it was an innocent communication, such as just checking for messages.
@TBill
In my view, absent the speculation deriving from the interpretation of the ZS flight simulator results, there is no support for the 180T flight path from 19:41 except that it, as a segment, has satisfactory error (including fuel)characteristics. (Recall that I have replicated the path from 19:22 in Barry’s spreadsheet and find nothing of substance to dispute).
Never get over a perfect fit, unless you believe that some of the “constants” have been adjusted. That is why I have stubbornly stuck to the BFO predictions I adopted years ago. They work for more than one case.
I need to rewrite the paper I produced a few months ago to use LRC. My results include a much sharper definition of the FMT time and a much narrower estimate of the path azimuth. This arises from the LRC effectively fixing the length of the path, combined with the requirement to intersect the 6th arc at 00:11.
I am awaiting DrBs report on the additional drift data obtained from DSTG to see how it impacts my conclusions. More importantly, the question of how to weight the drift data has not been (I think) fully considered. Are the aerial search results and the drift data to have as much weight as the Inmarsat data, or the previous undersea search results?
The premise of the UGIA report is that there were gaps in the undersea search that need to be revisited in light of the new interpretation of the Inmarsat data AND as an afterthought, a greater distance from the 7th arc should be searched (but denigrated based on the belief that there was no glide) since we happen to be in the neighborhood.
These considerations apply equally to the 186T path.
Note that the 186T path was apparently omitted from Richard’s comprehensive survey. It has therefore not benefited from the extensive analysis devoted to the 186T path in the UGIA paper, including a careful analysis of the initial search coverage and problems. I recall during the initial search that there were numerous revisits to specific locations near the IG predicted location, but little disclosed about why. Perhaps this information is available and has been looked at with the same level of scrutiny. I would welcome being informed on this subject.
last para second line should be 180T
@Mick Gilbert
In theory, moving from one cell to another should be invisible to WeChat. I am sure WeChat is continuously pinging all active users (over 1 Billion) to check if they are still connected.
I do not use WeChat for the reason Victor mentioned. I did not want to raise the thorny issue of the Chinese Government watching everything in real time on WeChat and at the same time explaining that the FBI provided the RMP with all the details of both pilot’s communications using Facebook, Twitter, Google, etc. I run a web site design business and in the last couple of days customer web sites have been attacked from China, Vietnam, South Korea, Ghana, Sweden and even the USA.
I can believe @TBill when he says that someone from China was of the opinion that the ZS runway WeChat communication was innocent, such as a “checking for messages” communication.
@Sid Bennett
You stated “Note that the 186T path was apparently omitted from Richard’s comprehensive survey“.
I have analysed your flight paths on the following dates:
(1) 22nd June 2014.
(2) 8th September 2014.
(3) 14th december 2014.
(4) 2nd January 2015.
(5) 8th February 2015.
(6) 24th April 2015.
(7) 8th June 2015.
(8) 26th October 2016.
(9) 5th August 2019.
(10) 15th March 2020.
@Sid Bennett
My apologies!
I stated flight paths, that should be path.
I have analysed your single flight path 10 times, since 2014.
Nothing much has changed in 6 years!
@Richard
The only thing that has changed is that recently you have agreed that there is nothing that disqualifies the 186T path except possibly the drift study, which is not presented South of 37deg.
@Sid Bennett
Then you agree that your previous statement, that I had excluded, omitted or ignored your 186T flight path is an outright lie!
@paul smithson
Thanks for the clarification. Still the good BTO fit for a wide range of initial bearings / track angles at a certain FL is an interesting aspect. I see it also in a different analysis, which I hope to share soon.
@Sid Bennett said: The only thing that has changed is that recently you have agreed that there is nothing that disqualifies the 186T path except possibly the drift study, which is not presented South of 37deg.
Look at the figure with the caption “Probability of routes based on data sets”. The first panel, which calculates the probabilities of matching the GDAS and meteorology data, shows a strong preference for the LNAV180 route at 34.3 latitude. The second panel, which shows low fuel probabilities south of 35S latitude, is under revision, and will likely show that the drop-off in fuel probability occurs further south.
After Bobby has completed his work and the panels to the figure are updated, my estimation is there will be a strong preference for LNAV180 over LNAV186, even if the LNAV186 has a higher overall probability than before, as the results presented in the first panel are unchanged.
@Richard
Calm down.
You specifically excluded it from your comprehensive study although it would have been obvious to include it based on it being the nominal original IG position. (as opposed to 190 or 192)
I will not delve into our private email exchanges, except to say that your last comparison spread sheet includes errors that you acknowledge.
The number of times that you have said it was not a feasible route is legion. But now it is grudgingly added as a possibility. I am very glad to have persisted. There are a small number of discrete high-probability routes. Ranting will not help to clarify the situation.
You choose only to answer questions that suit you. You have never addressed the BFO questions that I posed a few days ago. Did you use 153.2Hz or 150Hz as the bias during the path after 19:22?
Dr B. Your earlier comments on BFO were highly appreciated. Your annex on BFO represents a substantial and impressive body of work. I was particularly interested to see your fitted FFB drift over 16 hours in Fig F-1.
Do you think that this drift has any particular shape/periodicity? It it is a random walk, as Dennis W seems to suggest, then I don’t understand how one can infer anything about future drift from prior drift trajectory.
Is any part of that movement a maybe a fixed shift in FFB on power-up rather than drift during the period of contiuous operation?
@Richard
Re ‘I do not use WeChat for the reason Victor mentioned.‘
Same here. I installed it on an old handset just to see how a user would typically interact with it. I was curious as to whether the user had to ‘log in’ to retrieve or send messages. After I’d established that they do not, that once installed WeChat becomes active when the phone boots up and then runs in the background, I uninstalled it.
“I don’t understand how one can infer anything about future drift..” here I was referring to direction and slope. I see that the slope at least should be constrained by the Allan variance that you have described? Forgive me if I’m a little slow on this stuff, I struggle with BFO.
@paul smithson,
You asked: “Do you think that this drift has any particular shape/periodicity? It it is a random walk, as Dennis W seems to suggest, then I don’t understand how one can infer anything about future drift from prior drift trajectory.”
I have only attempted to predict one statistic, the 1-hour frequency deviation, based on less than one day of frequency bias measurements. One could do better if DSTG had published the bias values for each of the flight data sets they analyzed, but they didn’t do that unfortunately. There is no periodicity or “shape” that I can see. Still, I think DSTG’s plot of BFORs is consistent with that statistic. So, it may be the best we can do with the information we have at hand.
You also asked: “Is any part of that movement a maybe a fixed shift in FFB on power-up rather than drift during the period of contiuous (sic)operation?”
So far, I have not seen any evidence of a frequency step at a power-up. An upper limit of a step shift at 18:24 would be several Hz, and it might have been close to zero. We don’t have enough data near that time to know for sure. I do think that the average BFO Bias after 19:41 was about 152-153 Hz, so it may have increased by about 2-3 Hz compared to what it was at the gate. We can’t tell from the few BFOs we have whether that frequency shift occurred over many hours or at a single event.
@paul smithson,
You also said: ““I don’t understand how one can infer anything about future drift..” here I was referring to direction and slope. I see that the slope at least should be constrained by the Allan variance that you have described?”
The 1-hour deviation tells you the “typical” slope in BFO bias over a 1 hour time period. It does not tell you the sign (direction) of the slope. The sign of the slope is actually not random from one hour to the next. Look at the sign of the slope in Figure 1. It is not independent from one hour to the next. In fact, the sign of the slope can be the same for many hours in a row. This tells us that the time scales of the underlying causes of the frequency drift are considerably longer than one hour. In other words, the sign of the slope is correlated over periods of time longer than one hour. Another way to say this is that the temporal power spectrum of the Bias Frequency is dominated by frequencies below 1 cycle per hour. Remember that the 1 hour period was chosen because that was Inmarsat’s default time interval for checking to see if the AES was still active, which caused BFOs to be measured at 1 hour intervals. That 1 hour sampling period has nothing to do with the time scale of the OCXO frequency drift.
@Dr B. In the text you have explained why you chose not to use the phone call BFOs 1840 and 2314 in your route optimisation. However, I’d still like to know what those values (predicted) are. I looked for the predicted BFO and BFOR (before applying any channel-specific offset) in the report and annexes but was unable to find them. Would you mind sharing? Apologies in advance if they are there but I’ve overlooked…
@dr b. Thanks for first responses that crossed with my latest. Your points are clear and understood.
@paul smithson,
You said: “In the text you have explained why you chose not to use the phone call BFOs 1840 and 2314 in your route optimisation. However, I’d still like to know what those values (predicted) are.”
In order to make the 23:14 BFOs consistent with the values predicted using a BFO Bias of 150.0 Hz for our best-fit SIO route, a correction of 1.0 Hz must be added to both phone call measured BFOs using channel C6 (at 18:40 and at 23:14). The values of the “offset-calibrated” BFOs at 18:40, which have been increased by this 1 Hz, are shown in Figure E-1.
The +1 Hz offset frequency correction for C6 is not well-determined. It assumes that no BFO Bias drift has occurred since the calibration at the gate before departure. In other words, the BFO Bias value for channel C6 appears to be 149 Hz circa 23:14, and assumes no bias drift has occurred. Near the same time, the BFO Bias value for channel R4 which is needed o match the average of the 20:41 to 00:11 BFOs is about 152-153 Hz. Therefore, the C6 correction relative to R4 value could actually be as high as 3-4 Hz, assuming the non-zero mean BFOR from 20:41 to 00:11 is all due to OCXO frequency drift.
So, my conclusion is that one needs to add 1 to 4 Hz to the C6 BFOs at 18:40 and at 23:14. If you assume no bias drift has occurred since gate departure, you get 1 Hz. If you assume that the mean BFOR of the 4 BFOs at 20:41, 21:41, 22:41 and 00:11 is a reliable estimator of OCXO frequency drift, you need to add 4 Hz. I suspect the truth lies somewhere in the middle.
DrB. Many thanks.
@Sid Bennett
BFO Bias
(1) 25th April 10:27 – You quote @DrB in an exchange with @sk999: “The stability of the 20:41-00:11 BFORs does not indicate a large bias change from the time at the gate or a large ongoing drift, so those effects don’t appear to be causing the odd 19:41 BFOR. Perhaps it is due to the tail end of the climb”.
(2) You then quote our paper and ask “@Richard Can I ask which value was used in the calcualtions (sic!)? 150 or 153.2 or perhaps 152? There seems to be a difference of opinion”.
Why do you ask me what BFO bias I use, when you at the same time point out that we clearly state in our paper we use 150 Hz? Is this a trick question?
Are you trying to drive a wedge between Bobby and me?.
(3) In any case, Bobby responded to you at length the same day stating “There is no “difference of opinion.”
Bobby pointed out to you, that we clearly state in our paper we use a standard 150 Hz with channel offsets.
(4) 7th May 14:22 – You ask again “You choose only to answer questions that suit you. You have never addressed the BFO questions that I posed a few days ago. Did you use 153.2Hz or 150Hz as the bias during the path after 19:22?
You ignore the fact that Bobby answered your question and you ignore the fact that it was pointed out to you that we clearly state in our paper the answer to your question is a standard 150 Hz with channel offsets.
I have answered every question that I have been asked in this blog. I still have one outstanding request from @paul smithson to model his latest flight path, but that is on my list to do. We have answered every point you have raised and sometimes more than once, because you are like a broken record that keeps bringing back the same old discussion.
@Sid Bennett
Eclipse
(1) 5th May 12:11 – You state to @TBill: “Whether or not you accept my analysis of the overall satellite translation oscillator effect, you can see a strong influence of the eclipse effect”.
(2) Victor and I both point out to you that the issue of the eclipse was settled in 2014 and is completely accounted for in our flight models.
(3) The eclipse effect is also noted in our paper in section 4.4 on page 10.
(4) 5th May 15:49 – You state “@Richard, @VictorI Please note that the post was directed to specific comments made by @TBill. When Bobby writes to @sk999, you are allowed to but in, but when you write to @TBill, we are not allowed to but in. Your are hypocritical, one rule for you and another rule for the rest.
(5) Firstly I am not obliged to answer every comment you make to me. Secondly on a public blog I can choose to respond to any comment you make about me or what I have said, even if the comment was addressed to someone else.
@Sid Bennett
186T Flight Path
(1) Your 186T flight path has been discussed 62 times in the comments in this current post. Your 186T flight path was discussed 33 times in the comments in the post on our previous paper regarding a comprehensive survey of possible MH370 paths. In fact your 186T flight path has been discussed to death.
(2) 7th May 11:52 – You state to @TBill: “Note that the 186T path was apparently omitted from Richard’s comprehensive survey”.
(3) In our paper, we specifically state in section 5.1.7 on page 15 regarding our previous comprehensive survey: “The scan method for each lateral navigation method (LNAV, CTT, CTH, CMT and CMH) and for each speed control mode (constant Mach and long range cruise) required stepping through each possible initial bearing (initially from 155 °T to 195 °T) in steps of 1 °T”.
(4) 7th May 12:19 – I point out that I have analysed your 186T flight path on 10 different occasions.
(5) 7th May 14:22 – You repeat for your false statement despite my pointing out that it is not true: “You specifically excluded it from your comprehensive study although it would have been obvious to include it based on it being the nominal original IG position”.
(6) In our previous paper, we specifically state in the section entitled “Method”: “The scan method for each Lateral Navigation Method (LNAV, CTT, CTH, CMT and CMH) and for each Speed Control Mode (Constant Mach and Long Range Cruise) requires stepping through each possible Initial Bearing (initially from 155°T to 195°T) in steps of 1°T. In Constant Mach (CM) the value was set initially at 0.85 and decremented in steps of 0.01 Mach”.
(7) You continue your lies even when they are pointed out to you.
(8) 7th May 12:29 – You again falsely claim: “The only thing that has changed is that recently you have agreed that there is nothing that disqualifies the 186T path except possibly the drift study, which is not presented South of 37deg”.
(9) 11th April 21:17 – Bobby points out to you, that your 186T flight path is disqualified: “The route probability is only 11%, and the compound (route X fuel) probability is 8%”.
(10) Bobby also points out that our 186T flight path from a different start location and at a different flight level of FL410 has a higher probability of 53.5%.
(11) 23rd April 19:22 – I point out to you and @TBill, that “The Route x Fuel probability of our proposed flight path is 86.0%. The Route x Fuel probability to @Sid Bennett’s proposed flight path was 8.3%. The best Bobby could come up with, following a diligent search and after changing the flight level and the start point was 53.5%. That is not a finding in @Sid Bennett’s favour”.
(12) 7th May 13:12 – Victor points out to you: Look at the figure with the caption “Probability of routes based on data sets”. The first panel, which calculates the probabilities of matching the GDAS and meteorology data, shows a strong preference for the LNAV180 route at 34.3 latitude. The second panel, which shows low fuel probabilities south of 35S latitude, is under revision, and will likely show that the drop-off in fuel probability occurs further south. After Bobby has completed his work and the panels to the figure are updated, my estimation is there will be a strong preference for LNAV180 over LNAV186, even if the LNAV186 has a higher overall probability than before, as the results presented in the first panel are unchanged”.
(13) It is another lie to state that I recently agreed with your 186T flight path. Not only do I disagree with your proposed flight path, but the majority of commenters here also disagree with your proposed flight path.
@PaulS
@DrB
“(PaulS) asked: “Do you think that this drift has any particular shape/periodicity?”
That’s why I earlier asked DrB how hard it would be to get the BFO drift corrections for the earlier flights on DSTG Fig 5.4, whereas the report makes the point that those data are undisclosed to the public. Certainly seems obvious to me the BFOR is apparently drifting in the same direction during Flights MH371/370, at least as a hypothesis.
Of course, I would defer to Inmarsat on my BFO bias drift hypothesis. If they nixed the idea, I’d be shot down (yet again).
@paul smithson
I have been catching up on your recent comments on the underwater search, drift analysis, BTOR trend behaviour (with time and with weather), BFOR trend behaviour (with time), point of closest approach, BTO at various Arcs, BFO bias, BFO drift and/or shift and BFO channel offsets, especially during the calls starting at 18:39:55 UTC and 23:14:01 UTC.
On 3rd May, you requested “In case you have time and inclination, I’d value your cross-check on the BTOR and BFOR for that path model https://mh370.radiantphysics.com/2020/03/09/new-report-released-for-mh370-search/#comment-28276”. My apologies for the delay in running the simulation, it was due to the available time, not my inclination.
Start Point
Start Time: 18:33:15 UTC.
Start Latitude: 6.7974°N.
Start Longitude: 95.2364°E.
Initial Bearing: 190.735°T.
Speed Mode: Constant Mach 0.8400.
Flight Level: FL340.
Geometric Altitude: 35,000 feet.
Navigation Mode: LNAV.
GDAS Weather Data: Winds and temperature, bicubic spatial interpolation, linear time interpolation.
Paul Smithson BTOR and BFOR results
BTOR (predicted-observed): +9, +14, +13, -35, +15 (RMS=19.7).
BFOR (predicted-observed): -7.4, -8.1, +2.5, +5.5, +9.2.
Latitude at 7th Arc: between 39.2°S and 39.7°S.
Richard Godfrey BTOR and BFOR results
BTOR (predicted-observed): +5, -7, -35, -118, -114 (RMS=75.4).
BFOR (predicted-observed): -8.9, +0.3, +3.5, +2.9, +6.6.
Latitude at 7th Arc: 39.42°S.
I was surprised at the difference between our results, so I checked using Barry Martin’s model:
Barry Martin BTOR and BFOR results
BTOR (predicted-observed): +3, -1, -19, -109, -92.
BFOR (predicted-observed): -7.3, +1.4, +3.6, +2.1, +2.7.
Latitude at 7th Arc: 39.56°S.
Barry’s results appear to align closer to mine than your results. I use a standard BFO offset of 150.0 Hz for CU 4. I calculate the altitude at 35,424 feet for FL340 at a surface pressure of 1012 hPa and temperature of 27.3°C, but this will make only a small difference.
RG Fuel Results
REFE at 23:54:07 UTC.
MEFE at 00:03:49 UTC.
Fuel Shortage of 1,201 kg for MEFE at 00:17:30 UTC.
Assumptions: No descent, No Right Engine INOP, No Packs Off, No Rebalancing, No Cross-Feed Valves Open.
RG Correlation Results
Low correlation BTOR vs ATW + GSE.
High correlation BTOR Start vs End of Leg.
High correlation BTOR vs Time.
High correlation BFOR vs Time.
High correlation BFOR vs BTOR.
UGIB Yada Yada Results at 39.4°S
Aerial Search Probability not detecting floating debris 82%.
Drift Probability matching CSIRO previous data 0%.
Drift Probability matching CSIRO new data TBA (likely <1%).
Full Report:
https://www.dropbox.com/s/fh0kx612d46l7kq/MH370%20Flight%20Path%20Model%20V19.8%20RG%20LNAV%20CM0.84%20FL340%20190.735%20Test%20Paul%20Report.png?dl=0
In summary, this simulation is not that different to the one I ran back on 3rd August 2019 based on your input. In my view, there is a poor match to the satellite data, fuel data and the drift data.
@Richard
WOW!
@Richard. thanks, that feedback is useful and it suggests I have a problem with my adapted path model that I will need to track down.
@Dr B and co-authors. Some further cogitations on statistical discrimination of BFO.
I understand that you have been able to characterise the Allan variance, albeit based on only a single period. At least this provides an indication of the expected/permissible magnitude of bias drift over time. As you pointed out in your earlier response, the available observations suggest a monotonic tendency, over periods of a few hours.
Your report figure 36 plots of three BFOR statistics by track angle. I’d like to check that I’m understanding what you have done here and how you are interpreting it.
1. The RMS BFOR is a measure of “variability” in the BFOR without prior expectation of any mean value, so would not be affected by a one-off shift in the FFB. It should correspond with the BFOR noise that you have characterised as long as there is zero drift.
2. The standard deviation BFOR is a measure of how far the collection of residuals tends to depart from the mean, assuming a gaussian distribution. SD of BFOR should correspond to the expected noise (reading+trig) as long as we didn’t have a drift. I’d have expected RMS and SD to exhibit a similar pattern vs track angle but they have somewhat different minima – presumably something to do with skewed distributions.
3. The Allan deviation is a measure of how much movement there is from hour to hour in the BFORs derived for any particular path. You have characterised Allan variance from MH371 to obtain an estimate of 5.6Hz +/- 0.9 implying sigma 2.32Hz +/- 0.4.
4. Now, I am trying to understand how you are using the BFO statistics to qualify route fit.
a. I understand that by compounding Allan deviation and noise one ends up with a rather large expected BFOR variance, as you have illustrated in figure F-5. At five hours out, the chart shows compound variance of about 35Hz, so a sigma of ~6Hz. That is nearly double the “old” ~3.5Hz (+/- 7Hz for 95% confidence interval), and I don’t really understand why they should be so different. If sigma inclusive of drift is now reckoned to be ~6Hz, it renders BFOR mean pretty unhelpful for route discrimination. I understand that your route optimisation function doesn’t use mean BFOR.
b. You have also acknowledged in the text that the possibility of drift also means that BFOR vs UT correlation should be viewed with caution and that a strong correlation cannot be used to disqualify a route. Given your Allan variance calculations, surely we expect a deviation of ~2Hz per hour and absence of correlation would be unusual. What we can say is that the slope of BFOR – UT should not be much larger than that predicted by the Allan variance. But since that is quite a big number, I don’t think it is going to of much practical utility either.
c. With zero drift, the BFOR RMS (or SD) should not stray beyond limits of the noise distribution (reading+trig) and would have been a useful discriminator if we knew that the mean was static. Your intuitive view of the bias drift fit is that during MH370 it might have been reasonably flat. But then again, it might not. It could have continued going down, flattened off, or have been on the up after an inflexion before MH370. I don’t think there’s any way to know, is there? If there was significant drift during MH370, then I’d have thought it becomes impossible to rule out larger route BFOR SD values because noise has been compounded by drift. BFOR SD minimum compared to other routes might be preferable, but even that might be a “false optimum” produced by trended BFORs that are offset by drift.
5. Given points a-c above, I am having difficulty understanding how we can place analytic significance on the BFOR statistics that you have included within the route FOM. The BFOR-related statistics that you included in the route probability were:-
a. 1-hour BFOR deviation. Agree that this should be in line with Allan variance, but since that is mean 2.2 sigma 0.9, your Fig.36 indicates everything between 160 and 190 is permissible before you have even stretched beyond 1 sigma.
b. Correlation BFOR start-to-end each leg. Given our expectation of drift as a default condition, would such a correlation not be expected (rather than count against route probability)?
c. Correlation BFOR-UT. As above – we should anticipate this, so how does it help discriminate?
d. Correlation BFOR-BTOR. Agree that these ought to be independent so you don’t expect to see a correlation. I don’t know how this statistical distribution looks for your route survey. Sk999 remarked on the peculiar shape he reported in fig 6 of his covariance paper – which I believe implies that track angles 174-179 exhibit correlation, but this declines steadily for angles 180+. In any case, what constitutes an unacceptable BFOR-BTOR correlation? It is a fairly straightforward matter to tune any given route to remove BTOR-UT correlation. Once you do that, you are most likely also going to remove any BTOR-BFOR correlations.
6. Now, on a more constructive note, I’d like to suggest another way of approaching the BFOR stats. We want to be able to weed out routes that exhibit BFOR variability that is much greater than expected in light of BFOR noise (reading + trig) around an unknown background drift. Over a period of a few hours, the drift could be reasonably approximated by a straight line. We don’t know, a priori, whether the drift is down, flat or up – but we do know that its slope should be consistent with the Allan variance. So why not produce a linear fit BFOR-UT. Linear trend represents the underlying drift (compare slope coefficient to Allan variance) and the residuals to the linear fit represent the noise (compare to noise distribution). In combination, they might provide some insight on BFOR “fit” that does not require prior assumption on underlying drift.
7. I had started running some numbers on this to see how it works out but have elected not to continue the analyses until I have tracked down the bugs in my path model. What I have observed is as follows:
a. For LNAV constant M paths, using the starting positions on Victor’s “great circles” post I find “flat” BFOR vs time at around 172. Track angles less than that produce an increasingly steep negative trend, reaching -2.4Hz per hour at 162. From 172 upwards, the slope of the linear fit is increasingly positive, being around +2Hz per hour at 180 and +3.6Hz per hour at 190.
b. I wonder whether this change in slope of the BFOR-UT trend in the low 170s is the reason that previous analyses have repeatedly identified that zone as the one with the lowest mean BFOR.
c. The predicted BFOR for 1941 is resolutely negative across the full range 162 to 192, being between -4 and -7 between 170 and 192. I may well have a problem with my BFO calculator so will need to check this. But if it is confirmed, then it suggests either that 1941 is an outlier (?ROC) or that the direction of oscillator drift during MH370 was quite strongly positive.
I’d be glad to hear your views.
@Paul
Whenever you talk abot bfo “stats”, you are entering an unknown domain. The BFO bias drift is truly a random variable. Any attempt to quantify it is in the caregroy of guessing.
@paul smithson,
You said: “I understand that you have been able to characterise the Allan variance, albeit based on only a single period.”
Figure F5 shows the Allen Variance we measured for time increments ranging from 0.3 hours to 8 hours. We used the value at 1 hour just because that was the typical period between BFO measurements over the SIO.
You said: “1. The RMS BFOR is a measure of “variability” in the BFOR without prior expectation of any mean value, so would not be affected by a one-off shift in the FFB.”
No. If the BFO Bias varied from 150 Hz, the RMS BFOR thereafter would increase. That includes any shift of BFO bias from 150 Hz.
You said: “I’d have expected RMS and SD to exhibit a similar pattern vs track angle but they have somewhat different minima – presumably something to do with skewed distributions.”
As one gets away from the true route, the BFORs will develop a mean error. That route error can add to, or subtract from, the mean error that can exist due to BFO Bias drift. So, in general, the true route may not have a zero mean BFOR, nor will the BFOR deviations be minimized. That’s why the standard deviation is at a minimum at 176 degrees, but the RMS is at a minimum near 184 degrees.
You said: “I understand that by compounding Allan deviation and noise one ends up with a rather large expected BFOR variance, as you have illustrated in figure F-5.”
Actually, the Allen Deviation includes all the noise and drift components. So one doesn’t “compound” it with another noise source.
You said: “At five hours out, the chart shows compound variance of about 35Hz, so a sigma of ~6Hz. That is nearly double the “old” ~3.5Hz (+/- 7Hz for 95% confidence interval), and I don’t really understand why they should be so different.”
They aren’t. The 3.5 Hz includes mostly BFORs measured over shorter time scales than 5 hours, with smaller deviations.
You said: ” Your intuitive view of the bias drift fit is that during MH370 it might have been reasonably flat. But then again, it might not. It could have continued going down, flattened off, or have been on the up after an inflexion before MH370. I don’t think there’s any way to know, is there?”
No. You can only guess a smooth interpolation to bridge periods where you don’t have BFO data.
You said: “b. Correlation BFOR start-to-end each leg. Given our expectation of drift as a default condition, would such a correlation not be expected (rather than count against route probability)?”
Statistically, the noise in the correlation coefficients is fairly high because of having so few samples, so the overall probability is not strongly affected by one correlation coefficient out of nine metrics. The statistics of the CCs set the expectation.
You said: “c. Correlation BFOR-UT. As above – we should anticipate this, so how does it help discriminate?”
It all depends on the magnitude of the slope of the bias drift. That’s why we said to use caution with this metric. If one got great fits with all other metrics but the BFOR/UTC CC was terrible, Then I think you have to throw that one out. However, we don’t see that.
You said: “. . . what constitutes an unacceptable BFOR-BTOR correlation?”
Unacceptability is not a Go/NO GO decision. There is a monotonic, continuous decrease in probability as the CC deviates from its expected value (which is zero in this case).
You said: “So why not produce a linear fit BFOR-UT. Linear trend represents the underlying drift (compare slope coefficient to Allan variance) and the residuals to the linear fit represent the noise (compare to noise distribution). In combination, they might provide some insight on BFOR “fit” that does not require prior assumption on underlying drift.”
The Allen Deviation includes both effects. We only have 5 BFOs that we are try to fit for the SIO Route. If you remove two degrees of freedom by fitting a straight line, then you only have 3 degrees of freedom left to estimate the dispersion (standard deviation). You cannot get a reliable estimate of standard deviation with only 3 samples.
You said: “The predicted BFOR for 1941 is resolutely negative across the full range 162 to 192, being between -4 and -7 between 170 and 192. I may well have a problem with my BFO calculator so will need to check this. But if it is confirmed, then it suggests either that 1941 is an outlier (?ROC) or that the direction of oscillator drift during MH370 was quite strongly positive.”
I agree regarding the choices. Because we independently found that our FMT route required the climb to be completed shortly after 19:41:03, we favor that explanation for the negative BFOR at 19:41.
@Dr B. Please permit me a further response.
By “shift” I mean a one-off shift in the FFB that may be associated with a fresh power-up. “Probably not more than 10Hz” according to your page 11 and page 43. By “drift” I mean a continued change in FFB during MH370 flight. From your Allan variance study your 5-sample expected value for 1-hour deviation is 2.19Hz per hour with SD 0.88Hz.
You said “If the BFO Bias varied from 150 Hz, the RMS BFOR thereafter would increase.” Yes, of course. Silly me. So RMS BFOR should be close to minimum for the true course, but only if the mean has not shifted from baseline FFB and if the FFB does not drift during MH370.
SD BFOR is the variation around the mean, which need not match the baseline FFB. It should be close to minimum for the true course only if there is no drift during MH370, which (I think we agree) is an unlikely condition.
As a result, we don’t expect either mean BFOR mean or SD BFOR can be relied upon to distinguish the true route and neither of them is included among your 9 LNAV route optimisation metrics. However, your exhibit Fig 36 include the RMS_BFOR and SD_BFOR curves (along with the 1-hr deviation curve) as evidence supportive of 180. Have you not just demonstrated why RMS_BFOR and SD_BFOR should be considered inadmissible evidence? How can the figure demonstrate that “180 degrees is a good solution…as good a fit as any other bearing…”?
Correlation BFOR beginning and end of each leg will be stronger the greater the drift since it would be less obscured by noise. Same for BFOR-UT correlation. If BFOR is correlated with time, it will also correlate with any BTOR pattern that is trended against time.
Given the high likelihood of shift and the default expectation of drift, I still fail to understand why you have included “CORREL BFOR start leg-end leg” and “CORREL BFOR-UT” among your route optimisation stats. Surely in neither case should we have an expectation of r=0.
Meanwhile, a BTOR-BFOR correlation is quite likely to result from a route optimisation routine that minimises RMS_BTOR because it will try to “balance” errors and give you a trended BTOR against time. I would argue that this is of no analytic significance as long as the slope is small. Yet even a slight BTOR-UT slope will likely be enough to produce a BTOR-BFOR correlation.
All in all I am more perplexed than ever on why you have selected these BFO statistics or how you expect them to assist in the endeavour of route optimisation .
@Richard.
Your replication of the path model produces different BTO and BFO statistics. I have looked at the BTO aspect first.
It looks as if your model is travelling marginally “slower” because your path exhibits a BTO error that changes by about -20 per hour.
I have checked my adaptation of Barry’s path model and have ascertained that the Mach-TAS conversion is correct. In my version I changed FL to FL340, changed temperature fields (absolute) to temperature at 250hPa (GDAS) and changed ISA reference temperature accordingly. So my ISA delta and SAT refer to pressure altitude 34000ft. The geometric height of the aircraft is still 35,000ft above MSL and this figure is used in both the satellite range calcs and in the aircraft ellipsoid for purpose of translating speed into distance and lat/long position. Barry’s model, like yours, uses Vincenty to propogage a great circle path.
The only possible discrepancy that is of roughly the right size is the translation of vector distances at altitude to positions at ground level. The same speed in the horizontal plane at 35000ft covers a “ground distance” about 0.8NM per hour shorter than the same speed at sea level. As far as I can tell, this is implemented correctly in Barry’s model – using the aircraft ellipsoid for velocities, BTO calculation, and the determination of Lat/Long.
You may also be aware of a peculiarity in the version of Barry’s model available at aqqa.org that sets pressure altitude in the control panel but then uses a non-standard reference altitude for the ISA delta/temperature determination. That results in a faulty Mach-TAS conversion for a given ISA delta. In any case, his default pressure altitude is 35000ft, so not applicable for the model in question (FL340).
“The same speed in the horizontal plane at 35000ft covers a “ground distance” about 0.8NM per hour shorter” – Sorry, that is clumsily worded. What I mean to say is that if you travel 500NM at 34,000ft, the equivalent distance to traverse the same lat/long at sea level is about 0.8NM less.
@paul smithson: Agreed. At 35,000 ft (10.668 km), the fractional increase in distance compared to travel at sea level is 10.668/6371 = 0.167%. Over 500 NM, that amounts to 0.84 NM.
@paul smithson
Are you using a standard BFO bias for Channel Unit 4 of 150.0 Hz?
What settings do you have in your PARAM tab B126 for the FFB please?
What settings do you have in your PARAM tab B139 for the Channel 4 Offset please?
What eclipse settings are you using in PARAM tab B127:B131 please?
@Richard.
I am tracing the BFO issues now. I have already identified why I had major discrepancies to your numbers. I had re-set the base FFB to reference channel unit 4 at 149.86Hz and then removed the channel 4 and channel 6 adjustments from calculation of BFO predicted. In doing so, I had inadvertently over-written the observation-specific changes in FFB for the eclipse effect that would have applied at 1941 2041 and 2141. If we use CU4 as our reference value for FFB at 149.86Hz, Barry’s spreadsheet implies net adjustments of -0.5, +8.5, -1.5 respectively at these three times. Are these the same adjustments that you use for eclipse period compensation? What, if anything, is applicable at 1840, 1828?
@paul smithson,
You asked: “However, your exhibit Fig 36 include the RMS_BFOR and SD_BFOR curves (along with the 1-hr deviation curve) as evidence supportive of 180. Have you not just demonstrated why RMS_BFOR and SD_BFOR should be considered inadmissible evidence? How can the figure demonstrate that “180 degrees is a good solution…as good a fit as any other bearing…”?”
The reason that is so is the error bars shown on each estimate of the three BFOR statistics plotted in Figure 36. Because the number of samples (5) is so low, there is a large uncertainty associated with each estimated value of each statistic. In fact, there is a large range of bearings on either side of 180 degrees for which the estimated statistic is within 1 sigma of the minimum value of that statistic (which does not occur at exactly 180 degrees). That means the bearing for the minimum statistic is not well determined (in all 3 cases), being uncertain by 5-10 degrees.
You said: “Given the high likelihood of shift and the default expectation of drift, I still fail to understand why you have included “CORREL BFOR start leg-end leg” and “CORREL BFOR-UT” among your route optimisation stats. Surely in neither case should we have an expectation of r=0.”
To my knowledge, an abrupt step in the BFO Bias frequency has never been seen. Therefore, there is no basis in the data to believe that is a “high likelihood” event. If one occurred circa 18:24, it is unlikely to have been more than a few Hz, as demonstrated by the excellent agreement of the 18:28 BFOs with a course parallel to N571.
The expected value of the slope (i.e., linear drift) is likely close to zero, and this leads to an expected value of zero for the CC BFOR start leg to end leg and for the CC BFOR to UTC. There is a significant dispersion in the slope, and this is captured in the 1-hour BFOR deviation statistic, and it is reflected in both CC statistics. If we had a more or less continuous record of BFO Bias over many days, we could establish the 1-hour deviation with greater certainty, especially its observed mean value, which tells us the linear component of long-term drift (and how close to zero it is). But we don’t have that long-term record (because the data was not made public), and so we don’t have a good understanding of the long-term drift. That’s why we said to use the CC BFOR to UTC with caution. As it turns out, it’s not that large, especially when the 19:41 BFOR is ignored.
You also said: “Meanwhile, a BTOR-BFOR correlation is quite likely to result from a route optimisation routine that minimises RMS_BTOR because it will try to “balance” errors and give you a trended BTOR against time. I would argue that this is of no analytic significance as long as the slope is small. Yet even a slight BTOR-UT slope will likely be enough to produce a BTOR-BFOR correlation.”
I disagree. The fitting process has no inclination to produce a trend of BTOR w.r.t. time. As our Table G-2 shows, the CC of BTOR to UTC is small, only -0.15 (-0.3 sigma), due to BTO read noise. The CC BTOR to UTC is certainly a helpful addition for route optimization.
@Dr B. Thanks for the response. Re “To my knowledge, an abrupt step in the BFO Bias frequency “. I was referring to step change in FFB following a power cycle, not during the course of continuous operation.
@paul smithson
You asked: “Are these the same adjustments that you use for eclipse period compensation? What, if anything, is applicable at 1840, 1828?”
I use a standard BFO Bias for channel unit R4 of 150.0 Hz.
I use an EAFC correction according to Victor’s equation: EAFC Effect (Hz) = 40.16 × SIN((‘Decimal Time
(UTC)'(secs) − 7.5981)× 2 × PI() ÷23.93447). This is valid at all times. I think Barry Martin uses Victor’s equation as well.
I use an Eclipse effect in addition to the EAFC correction of 0.04 Hz at 19:41:03 UTC, 10.32 Hz at 20:41:05 UTC and 3.30 Hz at 21:41:27 UTC to align with the Inmarsat calculation. @Sid Bennett has asked Barry Martin to be able to program different Eclipse offsets for his analysis.
Between 18:25 and 18:40 UTC, the Channel Unit and for C6 the Codec are changing:
(1) 18:25:27 UTC is R8.
(2) 18:25:34 to 18:28:06 UTC is R4.
(3) 18:28:10 to 18:28:11 UTC is T8.
(4) 18:28:15 UTC is R4.
(5) 18:39:55 to 18:40:56 UTC is C6.
19:41:03 to 22:41:22 UTC is R4.
23:14:01 to 23:15:02 is C6.
00:11:00 UTC is R4.
00:19:29 to 00:19:37 UTC is R10.
R4 is the standard 150.0 Hz.
R8 is offset -3.3 Hz.
T8 is offset -4.4 Hz.
C6 is offset +1.0 Hz.
R10 is offset -1.5 Hz.
In addition Don Thompson pointed out that the C6 is not Channel Unit specific, but CODEC specific.
The 29 Channel Unit 6 BFOs at 23:14/15 UTC are all CODEC #3737 and observed values vary between 216 Hz and 222 Hz.
The 51 Channel Unit 6 BFOs at 18:39/40 UTC are either CODEC #3730 or #373E and observed values vary between 86 Hz and 90 Hz.
Thanks Richard. That’s clear. I intend to reproduce my analyses this evening incorporating those bias adjustment numbers. I’m cognizant of the channel and codec variations – but thanks for reiterating.
A short paper on BFO error characteristics can be found at the link
https://drive.google.com/file/d/1dsMd0ax0Gkw_AN0EOVDNehAYJbHP4COW/view?usp=sharing
I conclude that once we allow for the likelihood of background drift in the BFO bias, there is very little of practical analytic use that can be gleaned from BFO error patterns – whether BFOR mean, SD, RMS. Across the full range of track angles, BFOR-UT correlation is consistent with Allan variance magnitude as estimated by UGIB. This exercise has reconfirmed my sense that BFO statistics do not provide useful discriminatory power among routes with comparable BTO error statistics.
@PaulS
Thank you for the BFO paper.
I am sticking to my May-6 post of above, that the BFO data looks solid, and is showing a gradual decline in BFOR through Arc5, and presumably Arc6 continues that trend. If true this probably shifts flight path Arc7 cross point to 30S territory, more consistent with the 400-knot flight paths.
Another way to look at this, forget about Arcs 1,2,3,4,5,7. Look only at Arc6 BFO. The Arc6 BFO value is heavily dependent on geographic location, almost like a compass showing where MH370 went, if MH370 was flying straight and level over Arc6.
The reported value of Arc6 BFO=252 (in consideration of about 485 knots speed and 180S track) is consistent with about 33 South Arc7 crossing point. But the $64,000 question then becomes, is 252 the correct BFO Arc6 number? I feel the data supports a value more like Arc6= 247 “adjusted for drift” BFO which (in consideration of more like 400 knot speed and 170 Deg Track) points to more like 30 South crossing point.
At least my scenario is possible as a hypothesis (I hope). And if it did happen like that, it suggests the only reason straight/passive path looks semi-good is the drift in BFO places Arc6 crossing point (unadjusted for drift) in an area where straight flight looks like it might fit the unadjusted raw data.
@paul smithson
Thanks for the interesting plots. Can you help be to better understand the interpretation.
The BFO data set is independent of the path angle. That is the same BFO data set is compared against the predictions of BFO for the specific path and the residual obtained. I see the slope that you determined as correlated with the azimuth rather than UT. Your last figure shows that but the y axis is labeled as deg/hr. The slope is a characteristic of the path azimuth. Ideally, if the model is correct, the region where the slope is about zero should represent the correct path. (Depending on the choice of fixed bias level.
Also, I had been criticized for selecting a fixed FL and adjusting the M for best fit. As I have altered my analysis to use LRC at 39000 or 41000, the path results become more definitive.
I am assuming that the starting points for the paths are on the 2nd arc at 19:41. Whether a path is possible or useful depends on whether the plane could have reached the starting point at that time flying from the “known” location at 18:22.
@Sid.The paper is addressing the patterns in BFO residuals (BFOR) i.e. the difference between predicted and observed BTO values. Each path starts at 1941 close to Arc 2 on an LNAV course and constant mach that produces reasonable fit to arcs 3 through 6 (see BTO RMS statistics).
The paper shows that if you plot the BFO errors for each path against time, you typically see a slope. For track angles 176 is goes upward. I have tried to explain how it is the systematic change in these BFOR slopes that is driving the patterns in BFO error statistics against track angle. Slope refers to the linear fit to the errors of each path and is expressed in Hz per hour.
If the BFO bias was immutable, then the true path should have BFO errors (mean and standard deviation) close to minimum compared to other path candidates. However, the BFO bias is known to drift. So the trouble is that we don’t know whether the trended errors are due to having the wrong path solution or if one of them (or something like it) is the correct solution with a background drift in BFO bias.
@paul smithson,
A comparison of Figure 38 with Figure 37 in our paper quantitatively demonstrates the improvement in SIO Route discrimination that occurs when the BFO-related metrics are evaluated numerically. Your notion that these metrics don’t matter is incorrect. Small changes in these metrics can affect the probability noticeably.
I will also point out, again, that if the 19:41 BFO is either ignored in calculating the metrics, or corrected for its likely ROC, then for the 180-degree route both the mean BFOR and the slope of the BFOR are very close to zero, and are well within the expected BFO noise. In other words, only the 19:41 BFO appears to support (a) the notion that the BFO Bias was different for the SIO Route than it was at the gate, and (b) that the BFO Bias was drifting with time then. When you eliminate or compensate the 19:41 BFO, then all the other BFOs until 00:11 are consistent with no ongoing drift and no change in BFO Bias.
@Dr B. We could dismiss 1941 as an outlier (requiring ROC) or we could take it at face value. One thing that persuades me towards the latter is the Channel 6 data.
For the constant mach LNAV family of paths, I interpolated a BFO residual for 2314 for each path using adjacent R4 values. Now, compare that to the residual that is predicted using the R4 bias. Across track angles ranging between 162 and 192, we find that the CU6 value requires downward adjustment by between 5.5 and 6.8Hz. If that same adjustment is applied to 1840 (for a hindcast track from 1941, whatever track that is), we obtain a negative BFO residual close to that at 1941. So now we have two outliers, of similar magnitude. Dismiss both?
The 2nd Arc BFO measurement at 19:41 has a unique property. It is very near the minimum on the BTO curve fit, implying an approximately tangent heading. On any level tangent heading, the doppler shift would be null, unaffected by speed. The plane would be applying near zero correction at the 19:41 ping, as it does not compensate for ROC, altitude, or satellite motion.
I believe the 2nd Arc ping might be considered a BFOR null point, except for any assumed ROC.
After applying known satellite corrections, BFO drift values from cold start at KL might be compared to drift from the 18:25 SDU restart at known location and speed to the near-tangent 2nd arc.
@paul smithson,
You said: “For the constant mach LNAV family of paths, I interpolated a BFO residual for 2314 for each path using adjacent R4 values. Now, compare that to the residual that is predicted using the R4 bias. Across track angles ranging between 162 and 192, we find that the CU6 value requires downward adjustment by between 5.5 and 6.8Hz. If that same adjustment is applied to 1840 (for a hindcast track from 1941, whatever track that is), we obtain a negative BFO residual close to that at 1941. So now we have two outliers, of similar magnitude. Dismiss both?”
As indicated previously, our best estimate of the relative BFO adjustment of C6 relative to R4 is a downward adjustment of 1 Hz, based on matching a LNAV SIO Route. However, one cannot know the 18:40 flight parameters accurately enough to use those BFOs to calibrate the C6 frequency offset independently and then apply it at 23:14. Therefore one cannot use the 23:14 C6 BFOs to test any SIO Route. That is why we do not use them when fitting SIO Routes. The 23:14 BFOs cannot be characterized as outliers, because we have no reliable means of independently calibrating the C6 frequency offset. The 18:40 BFOs may be adjusted based on matching the 23:14 BFOs to the SIO Route, assuming no maneuvers occurred near that time, and that is what we did. Using that method, we don’t see significant BFORs at 18:40, but we also recognize that there are acceptable variations in flight parameters at 18:40 such that any BFO within 3-4 Hz of the observed, uncalibrated values can be matched.
@370Location,
You said: “I believe the 2nd Arc ping might be considered a BFOR null point, except for any assumed ROC.”
There is no reason why the BFO being at a minimum would have any systematic effect on the BFOR. Neither the BFO read noise nor the OCXO drift depend in any way on the BFO value, so the BFOR is also independent of the BFO for the true route. Thus, the BFOR should be uncorrelated with the BFO. If this is not the case, then there must be systematic route or model errors.
@paul smithson
Discussing things is so much more difficult in a blog. I am having much more success in Zoom where I can wave my hands…..:-)
Let me restate my point.
The 5 BFO measurements you use are unchanged for each of the paths. Forget about UT. An essentially identical plot would have been obtained if the x-axis was distance along the track. So, the slope represents the first order BFO error term with distance. (You are presuming that the error arises from a change in “bias” rather than the path angle). Without spending the time to review the math, my recollection is that the BFO component of the uncompensated (by the SDU) Doppler contains a sine function of the aircraft heading with respect to the satellite N-S path. So, for relatively small angles around the correct path, the error slope looks linear. (As usual I am going out on a conceptual limb and expect pushback from the mathematicians.)
So, the zero slope would be the “correct” azimuth.
What would the study look like if you included an estimate of the BFO error at 18:40? For the UGIA hypothesis it would be zero as the error is attributed to a descent at the time. For the FMT hypothesis it could be taken to be a range of perhaps +/- 3 or 4 degrees.
I am actually puzzled by the large BFO error at 19:41. I don’t find it. My assumption is that the BFO bias changed materially prior to 19:41 and was relatively stable (except for the eclipse effect) thereafter.
There is a real nugget in the comment of @370Location about the null in the BFO. This follows from @Brian Anderson’s original insight that the path is essentially tangent to the 2nd arc. There is a Doppler component due to the N-S movement of the satellite that needs to be considered, but (apart from instrument errors) the BFOR should depend more strongly on the bias than on the aircraft azimuth. Again, this needs some looking at. (Right now I am called to perform an “at home” IT intervention…..)
@Sid. I don’t follow.
@370Location
At a 19:41 tangent heading there will imo still be a dependence of BFO on aircraft speed, as the satellite is not at the nominal position (there is a non-zero s-bar, see eq.5, 6:
http://bitmath.org/mh370/mh370-path.pdf)
@Niels
Yes, there is a contribution to BFO from aircraft induced Doppler at 19:41. At this time the satellite is nearly at zero speed with respect to both Perth and the aircraft. It is turning around in its “dither”. I calculated some time ago (Sept 26, 2015) that the aircraft was traveling at a minimum speed of 400knots (higher at tracks other than 180) to produce the observed BFO.
@Dennis W. Was that before you became a BFO apostate?
@Niels
Does Ashton Fig. 8 change the conclusion? The satellite is essentially stationary at that time.
@Dennis W. By the path tool I am using, ground speed needs to be lower than 460kt to get within 3.2Hz of the 1941 BFO and 425kt to hit it on the button. Subject to eclipse adjustment assumptions, zero drift et cetera. I don’t believe there are automated mode paths of any sort that have the aircraft travelling that slowly at 1941, though I’d be glad to be corrected. Hence my earlier observation that 1941 is going to produce a negative error in the region -5 to -7Hz for pretty much any viable path unless you start invoking ROC.
@Paul
“@Dennis W. Was that before you became a BFO apostate?”
I have been a BFO apostate for a long time now.
As far as viable paths are concerned, I have abandoned that concept as well. The fact remains that the ISAT data cannot be used to infer a terminus. It tells us only two things – the plane went South at the FMT, and came down rapidly at fuel exhaustion.
@Sid Bennett
It is pretty common knowledge.
https://photos.app.goo.gl/EmfkrbVQDNCV9sFP8
Thanks all who considered the doppler null. I can’t dispute the math, but perhaps the doppler equation being framed relative to the satellite clouds the 2nd Arc conditions.
At near-tangent 19:41 the satellite ECEF velocity was Vx=1.893 Vy=-0.923 Vz=1.866 m/s. So, moving SW at about 5 knots relative to Perth and the 2nd Arc. That’s about the speed of a sailboat or a jogger. (The sub-satellite point would be smaller.) It was also descending toward Earth at about 180 FPM.
One factor to consider is that the plane’s BFO correction is based on the satellite being geostationary over the equator. With the satellite sub-point just reaching 1.64N at 19:41, it would be applying a BFO correction as if the plane were 181 km south of its actual location.(But it would have continued a declining offset for hours). In terms of heading shift on the second arc, that’s about 2.9 degrees between the actual tangent point and the plane’s zero BFO correction. So, speed and heading would be a small but computable factor.
For practical purposes, that 5 knots and 180 FPM still might be considered as a null reference for the true doppler, cancelling all other offsets except the small BFO correction applied by the plane, and unknown real ROC.
In terms of ROC with the assumption is that the plane was flying straight, it might also be assumed that it had reached its target altitude by one hour after the FMT, and was not executing a step climb at that moment.
@370Location
It is a bit difficult to go from the detailed equations back to the basic physics, I’ll try: If we assume the satellite being stationary above 1.64N around 19:41, for example the 180 deg track “tangent” latitude would be 1.64N. As indeed the correction algorithm assumes the satellite over the equator it will hence generate a correction term based on the aircraft moving. The other way round: if the aircraft is at the equator this term should disappear, however now a real Doppler shift is generated based on the satellite being over 1.64N.
An interesting question could be if (based on symmetry) then the minimum of the BFO curve would coincide with the latitude of the aircraft being at 0.82N.
@DennisW
Can you tell me the source of that figure so that I can read the narrative.
My eyes are not too good. Can you tell me the difference in likelihood at 180 and 186 at a speed of 480kn?
@Sid
It is figure 5.7 in the DSTG Book.
I don’t understand how the DSTG assigns probability to various speeds and tracks in that figure. 480 knots at 186 would have a very different BFO than 400 knots at 180.
@DennisW
Both the UGIA and the 186T model us a ground speed of about 480kn for the leg beginning at 19:41. The difference in likelihood appears very small.
I have some work work to do today so I will probably be tardy in replying further….
@370Location
I use DrB’s CBTO CBFO Excel spreadsheet to calc BTO/BFO, and to test impact of changes in the key variables.
@TBill
I must admit to not knowing about Dr.B’s spread sheet. Can you share a link?
Thanks…
Possibly this CBTO CBFO spreadsheet by @DrB:
https://drive.google.com/file/d/0BzOIIFNlx2aUV2lQQm96OVJ2OFk/view
from his list of documents:
https://drive.google.com/file/d/0BzOIIFNlx2aUS05JcEhsUXprcFE/view
I Was using Barry’s spreadsheet via Sid for Vxyz.
Thanks for at least considering a nullish 2nd Arc BFO, even if it does not change the BFO conclusions.
@Sid @370L
Yes above that is what I use for BFO test calcs. I almost never look at BTO since I assume that BTO needs to be matched. So I am always looking for BFO match, although I make allowance for BFO bias drift. If DennisW is BFO apostate, I am apparently the minister of the church.
@370Location
Thanks for the references. They are a valuable resource. I am not that organized….
@paul smithson
I would like to explain my comments by example. Can you send me the spreadsheet from which the second figure (linear fit)of your May 12 (6:28) post was created?
I’ve tried to determine the 19:41 latitude based on matching the minimum of a 3rd order D(t) polynomial fit with calculated D(t) curve based on a 180 degrees TT at constant GS typically in the 400 – 450 knots range with varying starting position. As I feared, a first scan reveals that the time and location of the matching minima vary strongly, depending on small variations in the polynomial used. With small changes in the polynomial I can get 19:41 latitude estimates between 1.88N and 9.24N. I must say that the polynomial fits that look most reasonable at first sight (including a 18:39 BFO data point and assuming a southerly course at that moment) fall in the lower end of the range (I have a 19:41 latitude at 1.88N and one at 3.35N for two slightly different 3rd order polynomials). There is however a problem with the latter two “scenarios”: the distance from N571 to the 19:41 latitudes is too small to fit the constant GS assumed, given the more than 1 hour time interval considered. I don’t know how to deal with a “delay” in this polynomial based path modeling.
Alternatively, I could perhaps assume a time at NOPEK or BEDAX after a “late” turn south and create a virtual BFO data point which I then use for the polynomial fit; it then all becomes rather speculative.
The basic problem, of course, is that there are not enough data points around 19:41 to accurately determine the proper polynomial D(t) and its minimum.
Note that D = df_up + df_comp
I have completed a revision and update of my March paper. The link is:
https://www.dropbox.com/s/zve7tipjkrbbrjc/MH370%20Report-rev2_May2020.docx?dl=0
There is better explanation of the interpretation of the cost function to incorporate the effects of the LRC fuel model, and the possibility of a rhumb line path after the FMT that is easy to initiate.
@Niels
Another way to look at it, assume the new proposal is correct and revisit sub-satellite location estimate/speed per @Brian Anderson’s original geometry with the proposed new understanding. At this juncture, we should be using actual flight paths vs. polynomial fit since polynomial fit is not a real life flight mode. Presumably the new proposed path is relatively consistent with Brian’s original estimate, except maybe actual speed was slower then faster instead of constant.
For those interested in details of BFO calculation: The figure in the link shows D = df_up + df_comp for the aircraft travelling south at 180 deg TT, M=0.66, FL300 (that’s near 400 knots) and passing latitude N1.8 deg at 19:41.
It shows df_up switching sign when aircraft passes the sub-satellite latitude, and df_comp switching sign when the aircraft passes the equator.
I’ll have a look what happens if you change speed and/or track. Slopes should change with speed.
The slight curvature in D mainly comes from the df_up (due to the satellite motion setting in); the df_comp is rather straight (as it is based on an assumed fixed / perfect geo-stationary satellite). This actually suggests that (for constant GS), a minimum in D(t) is mainly formed by the motion of the satellite (relative to earth-xyz) and should be expected close to 19:41.
https://www.dropbox.com/s/fihkesl00wam6ze/D_components.pdf?dl=0
Similar plots for M=0.84, FL350 and FL390 (TT180 deg), up to the 00:19 latitude. I included the D(t) polynomial which was fitted to the data. In terms of fit to the BFO data, there really seems to be a problem around 19:41 and the first hour or so after 19:41. Note also that the D(t) polynomial has a minimum south of the 19:41 location, which could tell us something.
https://www.dropbox.com/s/98dph650gliq12c/D_M084.pdf?dl=0
@Niels,
It tells us the 19:41 position is north of both the equator and the latitude of the sub-satellite point.
@Niels
@DrB stated: “It tells us the 19:41 position is north of both the equator and the latitude of the sub-satellite point“.
Which would in turn eliminate:
(1) @Sid Bennett’s flight path at 39,000 feet in LRC speed mode with a FMT at 18:39:30 UTC on an initial bearing of 186.0°T, which shows MH370 is positioned at 19:41 UTC at a Latitude of 0.7586°S 93.5155°E.
(2) @Paul Smithson’s flight path at 35,000 feet in CM0.84 speed mode with a FMT at 18:33:15 UTC on an initial bearing of 190.7350°T, which shows MH370 is positioned at 19:41 UTC at a Latitude of 2.4972°S 93.4930°E.
@Richard
Sorry I can’t respond right now. I am playing bridge on line.
I would need a much more detailed explanation of the conclusion.
@paul smithson
I would still like to follow up on our May 13 discussion of bias drift.
@Sid. I suggest that you model some BFO results of various flight paths in order to see how the error patterns vary systematically with the track angle. Then you can explore or reproduce the results that I posted previously. You will first need to adapt Barry’s spreadsheet to incorporate updated eclipse adjustments. I’ll explain how if this is of interest.
@DrB, Richard
Imo if the minimum in D(t) polynomial is not close to 19:41 it tells us that the level flight and/or constant groundspeed conditions are not met around 19:41. Which is interesting. However, I don’t see how it would tell us something about the 19:41 position.
Besides that, the plot that I shared with the nice BFO match for later times (FL390) has a starting latitude which results in good BTO match along the whole route (as expected as it resembles your proposed path). So far so good; however uniqueness remains the main worry. I would not be surprised if I can make similar BFO plots including good BTO fits for other bearings.
@Niels
You stated: “Imo if the minimum in D(t) polynomial is not close to 19:41 it tells us that the level flight and/or constant groundspeed conditions are not met around 19:41. Which is interesting. However, I don’t see how it would tell us something about the 19:41 position“.
Irrespective of where @Sid Bennett or @paul smithson wish to position MH370 at 19:41:03 UTC, north or south of the Equator or on the Equator, at an altitude of 35,000 feet or 39,000 feet, on an initial bearing of 190.7350°T or 186.0547°T, or using speed mode CM0.84 or LRC, they have some explaining to do. Please see the attached overview of their flight parameters.
https://www.dropbox.com/s/rjcvkschacfqo0g/BTO%20and%20BFO%20at%2019-41-03%20UTC.png?dl=0
It would behove both of them to explain the unacceptably high BFOR at 19:41:03 UTC for both of their flight paths.
In our paper, we show a BFOR fit at 19:41:03 UTC.
(1) MH370 descended to avoid radar detection during the FMT.
(2) MH370 descended to avoid other aircraft traffic on the busy airways N571, B466, P574, P627, N563, M300, P570 and P576.
(3) After passing BEDAX, there remained only one additional airway to pass under, and that was M300. About 5 minutes after passing BEDAX, an ECON climb to FL390 was begun at 19:23:50. M300 was crossed at 19:27:52 at FL212, which is well below all air traffic on M300.
(4) It seems likely that the climb was still ongoing at 19:41:03 UTC with a ROC of several hundred fpm, thereby reducing that BFOR to a normal level. We estimate the climb ended at 19:41:21 UTC.
Since neither @Sid Bennett, nor @paul smithson, indicate that MH370 descended during the FMT, how do they explain the BFOR at 19:41:03 UTC?
@Richard. You said “…nor @paul smithson, indicate that MH370 descended during the FMT, how do they explain the BFOR at 19:41:03 UTC?” I think I have explained, in some detail. Perhaps you did not read my paper demonstrating that no “trended” BFO error is self-evidently better than any other? Each linear fit is associated with a different path solution. We don’t know which one is “true” because to know that you need to know precisely what the drift rate of the bias was.
So I believe that the monkey is on your back rather than mine to explain your outlier at 1941. Since invocation of arbitrary ROC to rectify troublesome BFO data points is apparently “passé” I’d like to know how else you account for this outlier in your path solution.
@paul smithson
I have read all contributions on this blog.
I have gone to some length to show the shortcomings in your proposed flight path.
https://mh370.radiantphysics.com/2020/03/09/new-report-released-for-mh370-search/#comment-28417
https://mh370.radiantphysics.com/2020/03/09/new-report-released-for-mh370-search/#comment-28430
https://mh370.radiantphysics.com/2020/03/09/new-report-released-for-mh370-search/#comment-28434
A number of the points I have made, are still unanswered. The monkey is on your back.
@DrB has already answered your various points in full.
You claim to have explained in some detail, but we are not convinced. The monkey is still on your back.
@Richard, Paul Smithson
Recent further insights in the D(t) polynomial (in particular regarding its minimum) take away some of my doubts that there was a ROC involved in the 19:41 BFO. However there are other explanations possible: it could still be that GS was both “low” and non-constant around 1941.
Also the 19:41 BTO seems to be a bit “off”: often I get quite significant path curvature in the 19:41 – ~21:00 interval when doing the BTO-only path generation based on the BTO polynomial (LRC speed setting).
@Niels
You stated: “However there are other explanations possible: it could still be that GS was both “low” and non-constant around 1941“.
If you change the MH370 position at the Equator and 93.655789°E and altitude to (say) 20,000 feet (in the table I provided earlier) in order to achieve a BTOR of zero, then for a GS of (say) 300 knots, the BFOR increases to 9.9298 Hz. This is even worse, than before. But my argument is not with you.
My argument is with people like @paul smithson, who claim that a ROC at 19:41:03 UTC is arbitrary, when it has long since been known and practised by pilots to avoid radar detection, that a descent to a low level is most effective. (I spent years building terrain following radar systems for military aircraft.)
My argument is with people like @paul smithson, who claim that a ROC at 19:41:03 UTC is passé, when it has long since been known and practised by pilots to avoid crossing flight routes without ATC authorisation, that a descent to a level below the minimum for that flight route is required.
@Richard. Regarding FFB and eclipse adjustment, I use nearly the same numbers as you and Victor. FFB 149.86Hz, eclipse adjustments 0.05, 10.16, 3.36, 0.87 at Arc 2,3,4,5 respectively.
The paper that I shared on BFO error patterns used those adjustments. If there is a background drift in bias going on in the order of +/- about 2.5Hz per hour, then any path in the range 165-195 will produce an acceptable BFO error pattern. Dr B responded, saying he feels (note my choice of verb) that there wasn’t a substantial shift in bias on SDU restart or drift thereafter. But he doesn’t know that and nor do you. If you prefer to cling to “static” BFO mean and standard deviation expectation without regard to the shift and drift uncertainty described in your own paper, be my guest.
@paul smithson
The only “Klingons” around here, are you and @Sid Bennett.
I presented a number of rational arguments for a descent during the FMT, concerning radar and traffic avoidance, which you have once again ignored.
@Niels
I have extended my table at 19:41:03 UTC to cover a wider range of possible flight parameters (although some are at the limit of the B777 performance). The position at 19:41:03 UTC is set to give a BTOR of zero.
(1) I think you will agree, that to achieve the fuel endurance until 00:17:30 UTC a speed mode of around a CM 0.84 would be required.
(2) The table attached below, covers MH370 positions at 19:41:03 UTC from 2°N to 2°S, altitudes from 45,000 feet to 16,000 feet, initial bearings from 160°T to 200°T.
https://www.dropbox.com/s/792icxwbmlhpuoj/BTO%20and%20BFO%20at%2019-41-03%20UTC%203D.png?dl=0
For a ROC of zero, the only BFOR fits at 19:41:03 UTC are for a high altitude and faster GS flight.
@Richard
http://www.quotationspage.com/quote/24501.html
@paul smithson
I agree that “manners maketh man”!
So why are you so ill-mannered?
@Paul
I have been following along, and find the 19:41 BFO interesting even for a BFO apostate. There are a few possibilities…
1> BFO drift (could be)
2> ROC (could be)
3> Not 180 degree track at 19:41 (my preference)
The drift is hard to reconcile with subsequent BFO “fits”. The ROC infers an attempt to be stealthy which I see little motive for, and it is not compatible with the Kota Bharu / Penang tracks. Oh well. I really don’t have a dog in this fight.
@Dennis. Within the range of interest, level flight BFO is more sensitive to speed than to track angle or latitude. The only way to get to zero BFO error is with a speed much slower than the UGIB scenario demands, or invocation of ROC to make up the difference. Take your pick if you fancy either of the choices. Alternatively, you could elect to believe that we may be seeing BFO variability associated with FFB shift or drift.
19:41
Arc2 seems obviously seems to be a maneuver in progress.
If one accepts the 180 South hypothesis, at 1941 MH370 could in theory be right on flight path L896 above ISBIX just making the FMT south (if we allow for alternative ways to get to Arc2).
C’mon. The entire UGIB thesis is predicated on no manoeuvres between 1941 and 0011.
Regarding possible radar avoidance / ROC:
To have BFOR = 0 at 180 deg TT (19:41 level) one needs a GS somewhere in the 410 – 420 knots range. One scenario could be that a possible prior descent was meant to avoid other traffic, not to avoid radar detection. Any FL below 300 or so would be ok for that purpose.
@Richard: the table you shared based on M=0.84 is less useful/realistic at lower FLs. Perhaps a table based on LRC M would work for a wider range of FLs.
@Paul
I am talking about track angles much different that 180 i.e. 150 at which
BFO is ~109Hz at 480knts. For lat 5N long 93.7.
@Niels said: One scenario could be that a possible prior descent was meant to avoid other traffic, not to avoid radar detection.
That can be accomplished with a 500-ft vertical offset and/or a lateral offset from the airway, without a need to descend.
@Niels,
I purposely used CM 0.84 throughout for four reasons:
(1) Comparability, if all variants are at the same Constant Mach.
(2) We know that the fuel endurance was until 00:17:30 UTC, which implies not much fuel was wasted with manoeuvres or inefficient fuel modes.
(3) LRC at 19:41:03 UTC is close to Mach 0.84 between FL360 and FL430 anyway.
(4) The flight level range of FL360 to FL430 covers both @Sid Bennett’s flight path proposal as well as @paul smithson’s flight path proposal.
It took a lot of work to produce the CM 0.84 table. I am not sure when I will get time to do a LRC table.
The minimum flight level on N571 is FL250 (please see page 5 of our paper).
@VictorI
I was thinking about the crossing of several airways after turning south.
@Richard
“It took a lot of work to produce the CM 0.84 table. I am not sure when I will get time to do a LRC table”
I understand, I’ll see if I can do something myself there.
This is the quick sensitivity test I did for BFO errors at 1941. From what I could see it is largely immune to latitude change but I did not test this systematically and this example was done assuming latitude ~2S
https://docs.google.com/document/d/11DwhRomDywVsCv2P6lQR8WUzG_b90pdi1Vk-t4hfL9k/edit?usp=sharing
@Paul
I find the graphic in the DSTG Book to be accurate. I am not “in love” with tracks near 180. I still like a track angle toward the Cocos best in terms of reconciling action, motive, and search strategy.
Certainly a search recommnedation near 34S on the 7th arc violates the prudent use of decision theory.
https://photos.app.goo.gl/TK7veGGcAdpFJCB87
The BFO at 19:41 is problematic. In this discussion it is taken as a fact.
But, the eclipse started, I believe, a few minutes before and it is an extremely sharp temperature/frequency change at the satellite. The exact way in which the eclipse effect is applied to the signal chain has always somewhat eluded me.
Recall that the eclipse start time changes from day-to-day in a regular manner and any Inmarsat GES compensation technique that makes use of the previous day’s data to establish a baseline would potentially be in error.
It has been a long time since I looked at the GES down-converter and compensation scheme and I recall that there was some doubt as to exactly how it worked.
Perhaps Mike or Victor can help.
@Sid Bennett: I’ll try once more to explain why your concerns about the EAFC and the eclipse don’t matter.
The (highly accurate) pilot signal is generated at Burum and the frequency error (after compensation) is measured at Perth. The measured frequency error of the received pilot signal is composed of the following:
1. L-band (uplink) Doppler shift between Burum and the satellite
2. Satellite frequency drift (including the effect of the eclipse)
3. C-band (downlink) Doppler shift between the satellite and Perth
4. EAFC applied to the signal that is received at Perth
Items (1) and (3) can be calculated based on the satellite orbit, which is well-known. These quantities can then be subtracted from the measured frequency error.
After this subtraction, what is left is the sum of (2) and (4), which was provided for us by the ATSB in tabular form back in June 2014. The same information is provided graphically by Ashton in the JON paper, except only (1) is subtracted from the measured frequency error, which leaves (2) + (3) + (4).
Notice that no assumption about (2) or (4) is required to calculate the BFO for MH370 since we only need the sum of (2) and (4), and not the individual components.
@VictorI
Victor, I get it, but exactly how is the EAFC computed? My impression was that it uses the past 24hr data, and I recall that several minutes of data are averaged for each estimate.
@Sid Bennett: Read MITEQ’s pilot receiver manual for the details. Both the Long Term Drift of the satellite oscillator (which by the way dominates all other components) and the Doppler shift are measured (from the past 24 hour data) and compensated. However, as we know, the Doppler compensation is incomplete because of an algorithm error associated with the (southern) latitude of the GES.
But all of this DOES NOT MATTER in the calculation of the BFO for MH370, and hasn’t mattered since the ATSB published the EAFC plus Satellite Drift data back in June 2014.
@VictorI
The correction frequency is updated at 5 minute intervals based on the average frequency measurement during the past 5 minutes. The granularity of the frequency correction is 1Hz. All of this usually does not matter. However, at the start of the eclipse, the rate of change of actual translation frequency at the satellite is quite large. Perhaps 3.5Hz in the the 5 minutes. This error is entirely un-compensated until the next 5 minute update. I do not know the relationship of the update interval to clock time.
@Sid Bennett: You keep providing reasons why you believe the compensation provided by the EAFC does not completely cancel the satellite oscillator drift. I keep explaining that as long as the frequency error at the GES is accurately measured after compensation by the pilot receiver, it DOES NOT AFFECT the calculation of the BFO for MH370. The pilot receiver’s incomplete cancelation of the C-band Doppler and the satellite drift contributes to the frequency error, which is measured.
I don’t know what more to say. I thought that my previous comment on May 19, 2020, at 6:56 pm made it very clear how Inmarsat determined the (EAFC + δFsat) values it published, and how to use those values in the BFO calculations for MH370.
@PaulS
On BFO calcs at 1941 sensitivity maybe double check a few numbers against DrB calc sheet. I had seen funny geographic/time behavior in that region in some other models, which is why I eventually settled on using DrB’s model.
@VictorI
Thanks for your patience. I do not have sufficient understanding of the exact operation of the receiving chain. I have used enough bandwidth on the subject.
I didn’t think that the published, tabulated, BFO used that technique.
In the linked pdf TT path calculations (FL390, M=0.84) where I changed the 19:41 D value (by 4 Hz) before making the polynomial fit D_poly. This polynomial fit is then compared to the calculated D for each of the paths (TT 180 and TT 182 deg) and the comparison plotted as a function of latitude. Both the TT 180 and TT 182 deg paths (FL390, M=0.84) have a good BTO fit.
Also added for TT 182 deg the same procedure with a 5 Hz correction.
The TT 182 deg path (ending around S35.5) shows the slightly better “D functional” fit, however we should be careful with firm conclusions here as some drift cannot be excluded. Note that even with some correction in D at 19:41 (for example to account for a possible ROC) it is difficult to get a full match of the two D curves around 19:41.
It is interesting to see that the match in the D functions (occurring especially in the later hours) coincides with the good overall BTO fit, where the starting position was varied to obtain this fit. I will explore some more path options, including LRC at different FLs and expect more of these “matching” cases based on CTT, at least around S35 deg (LEP).
https://www.dropbox.com/s/ay6jm6ix6jeo4nz/D_M084_TT180_TT182.pdf?dl=0
@Niels
Further to your proposal of matching the BTOR at zero and finding the minimum BFOR at 19:41:03 UTC, I have completed 3 tables for the LRC speed mode.
The tables cover the range of altitude from 18,000 feet to 42,000 feet at initial bearings from 160°T to 200°T.
The range of start positions on the 2nd Arc at 19:41:03 UTC is from 2°N to 2°S.
https://www.dropbox.com/s/z1o4lx0xrz10218/BTO%20and%20BFO%20at%2019-41-03%20UTC%20LRC%20160%C2%B0T.png?dl=0
https://www.dropbox.com/s/97hvakl5hrwsgji/BTO%20and%20BFO%20at%2019-41-03%20UTC%20LRC%20180%C2%B0T.png?dl=0
https://www.dropbox.com/s/8r2kuqie0tadakj/BTO%20and%20BFO%20at%2019-41-03%20UTC%20LRC%20200%C2%B0T.png?dl=0
The best match to BTOR = 0 and BFOR = 0 at 19:41:03 UTC and LRC speed mode is:
(1) For an initial bearing of 160°T at ca. 26,000 feet.
(2) For an initial bearing of 180°T at ca. 18,000 feet.
(3) For an initial bearing of 200°T at ca. 22,000 feet.
It would appear, that whatever flight path you choose at LRC speed, that a descent took place.
@Richard
Thanks a lot, that’s useful information. Yes, to me the 19:41 BFO looks indicative for anything between a level flight significantly below typical cruise speed and altitude, and conditions close to cruise (end of a climb phase). Unless we are just looking at a ~7 Hz error..
The polynomial method could indicate that it took a while after 19:41 to reach final cruise conditions. However, important to realize here that the rather low order polynomial is not able to capture quick maneuvers very well (even if the data would be less sparse).
For the high altitude scenarios, the models are a constant altitude. If there were to be a cruise climb, when would it have occurred and what ROC would be used?
@Sid Bennett
You asked “If there were to be a cruise climb, when would it have occurred and what ROC would be used?
(1) We know that MH371 performed four step climbs and the last one to 40,000 feet occurred 2 hours 40 minutes after the cruise was established, when the aircraft weight was 200,760 kg.
(2) MH370 at 19:41:03 was 2 hours 39 minutes from the start of the cruise and the aircraft weight was ca. 200,725 ± 250 kg (depending on air conditioning packs status, any descent to avoid radar and whether the right engine was shutdown).
(3) If there was a MH370 step climb to 40,000 feet and it was performed by the book, then it would have occurred at around 19:41:03 UTC.
(4) The MH371 step climbs from 36,100 feet to 38,100 feet was at 400 fpm and from 38,100 feet to 40,000 feet was at 380 fpm.
@Sid Bennett
“….and conditions close to cruise (end of a climb phase)”: Ulich et al. in their paper give an example for this with a ROC of 400 fpm at FL389, 484 kn TAS at 19:41:03. In their scenario the climb started from FL100 at 19:23:50.
@Niels. I’d be interested in what is a typical rate of climb under the assumed control mode, altitude/weight/speed. If this matches the ROC required to scrub the BFO residual then assumption of “climb ongoing” is enough. If, on the other hand, the ROC required to scrub the BFO error is << typical, then we would need to have serendipitously coincided with just the right stage of end of climb where ROC had reduced to the required level. Perhaps one of the authors can tell us whether 400fpm is a typical ROC or not.
@Paul Smithson
It is a good point. And for the lower FLs and GS values the required ROC is even smaller.
@Niels, @paul smithson,
A typical cruise step climb, as evidenced by the MHXX flight, is between 500 fpm and 1000 fpm.
In section B.2.3 we state “Interestingly, the climb rates in MHXX were not the same for all steps. In fact, two steps were at 500 fpm, one was at 750 fpm, and one was at 1,000 fpm.
@Richard
Sounds like an interesting “proof” of pre-1941 descent above, or as Paul states just a bad BFO data point. Of those two options, I favor the proof of descent.
I believe the home simulator hit FL400 at the N10 point near DOTEN. I assume we still believe MH370 likely reached FL400 for period after IGARI.
@TBill
It is called the weight of evidence!
I agree with you.
I assume @Sid Bennett and @paul smithson do not agree with either of us.
@Richard
If you have read my paper, I have said nothing to disagree with the conclusion of UGIA paper that there is a plausible route at 180T that includes a low-and-slow segment.
Regrettably, you take the possibility that there exists one or more other routes as a personal attack. I distressed that you do.
You continue to provide excellent factual material for discussion, and I continue to ask questions to clarify assumptions.
Essentially all of the high altitude paths (all of mine) are simulated at a constant altitude. Note that when I asked the question, I did not realize that it would have such a definitive answer and that it likely coincided with 19:41.
Having said that, it seems that any detailed use of the BROR at 19:41 should acknowledge that it could be caused by a climb, which could either be a scheduled cruise climb or part of the return to high- altitude flight as you have hypothesized. (I am not planning to use the cruise climb as it smells too much of gilding the lilly.)
@paul smithson
Apparently we are guilty of the same sort of unproven collusion that results in the airlines having essentially the same fares on competing routes.
Would you reconsider sending the spread sheets I asked for a few days ago. If I redo it, it is wasted effort, and I do not know your exact initial conditions.
Richard. It is not a question of agreeing or not. Your theory now predicts an ongoing climb at 1941. You have made a case that this might reasonably have been expected to occur at around this time. Neither of us can prove whether or not this took place. It is simply another example – along with similar treatment of the 1840 BFO – that predicts/requires ROC to account for “problematic” BFO values that don’t align with your theory. Maybe you are right, maybe you aren’t.
@Richard
It is not fully clear to me why you refer to “cruise step climbs” in relation with the 19:41 BFO. In your proposed scenario isn’t it towards the end of a significant climb from FL100 to Fl390, which for most part would take place at climb rates above 1000 fpm or even above 2000 fpm initially?
@Niels
You asked “It is not fully clear to me why you refer to “cruise step climbs” in relation with the 19:41 BFO. In your proposed scenario isn’t it towards the end of a significant climb from FL100 to Fl390, which for most part would take place at climb rates above 1000 fpm or even above 2000 fpm initially?”
My apologies for not being clear. There are different types of climb:
(1) Initial Climb after take off is usually at full thrust for a period of typically 2 minutes. You can expect a ROC of ca. 2,000 fpm to 2,500 fpm.
(2) Climb to Cruise altitude is at reduced thrust after ca. 2 minutes. You can expect a ROC of ca. 1,000 fpm to 1,500 fpm.
(3) Cruise Climb or Step Climb to change to a more fuel efficient flight level. You can expect a ROC of ca. 500 fpm to 1,000 fpm and a change in altitude of 2,000 feet, 4,000 feet or 6,000 feet.
(4) Our MH370 FMT hypothesis involves a Climb from FL100 to FL390. This is a non standard climb. In my view and as expressed in our joint paper: “At 19:23:50 UTC the climb to FL390 starts and is completed at 19:41:21 UTC. All the airways between N571 and M300 have been successfully crossed, well below their respective minimum flight levels. The best-fit 19:41-00:11 route start position is matched perfectly.“.
Whether or not any additional step climb(s) took place is an assumption, where an open discussion ensued and which I was helping to investigate. It is theoretically possible that either @paul smithson’s scenario or @Sid Bennett’s scenario, both based on a level flight but at different cruise altitudes, could benefit from a step climb or climbs.
@DrB observed “I have wondered about step climbs, but that possibility would only be driven by maximising range. Since he did not fly at MRC, fuel conservation does not appear to be a priority, so step climbs are unlikely“. I agree with @DrB that a step climb is unlikely, but I was happy to test the assumption.
@paul smithson observed”Since invocation of arbitrary ROC to rectify troublesome BFO data points is apparently “passé” I’d like to know how else you account for this outlier in your path solution“.
I have argued that the FMT we have proposed is a result of rational decisions to avoid radar detection during the FMT and avoid other traffic on busy airways. @paul smithson rejected those arguments as contrived, in order to deal with a BFOR “outlier”.
You have shown, that there is more than one possible explanation to the BFOR at 19:41:03 UTC.
We have made our case and I accept your criticism that there are other possibilities. If you and @paul smithson disagree with our hypothesis, then that is your perfect right.
@Sid Bennett
You stated: “Regrettably, you take the possibility that there exists one or more other routes as a personal attack“. Yet another try to avoid the issue!
I have argued in detail, as to why I believe your path is wrong.
@Victor has argued in detail, as to why your path is wrong.
@DrB has argued in detail, as to why your path is wrong and even suggested a correction.
Please get real. We are not convinced.
Many of the so called IG are not convinced.
Many of the analysts on this blog are not convinced.
@Richard. Your model run on my path proposal described here estimated that final fuel exhaustion came at 03:49, the right engine having gone down some 9:42 earlier. Can you tell me what initial fuel load was assumed for this? I was a little surprised by the result since my estimates (using the M0.84 tables) came up quite a lot shorter – predicting ~23:45. If this were split into two tanks and separate engine efficiencies, it would come out at roughly 24:41 and 23:49. I’m not sure why my numbers are so different to yours and would like to try and trace the difference.
@Richard
Many thanks for the explanation regarding (step) climb.
Regarding “We have made our case and I accept your criticism that there are other possibilities. If you and @paul smithson disagree with our hypothesis, then that is your perfect right.”:
I really still don’t know what to make of the 19:41 data point and if it is reasonable to include it in a “fixed setting” path all the way to fuel exhaustion. There is much we try to squeeze out of little data, so probably we all agree doubt is a healthy aspect of the process. And if it would remain that has a value of its own. As said before, I’m quite comfortable with S34.5 as “center point” for a search recommendation; my main doubt is in the margin one should allow “around it” (especially the length of 7th arc segment).
In this context, the extended path/fuel probability scan that @DrB was considering to make (based on the possible multiple path probability optima as a function of FL, as well as looking at optimization of the combined fuel/path probability) would still be highly relevant.
@Niels,
You said: “In this context, the extended path/fuel probability scan that @DrB was considering to make (based on the possible multiple path probability optima as a function of FL, as well as looking at optimization of the combined fuel/path probability) would still be highly relevant.
I am currently working on refinements to three probability density functions: (a) debris drift, (b) fuel, and (c) SATCOM/GDAS.
The initial intent for the work on the debris drift PDF was simply to extend it down to 44S. Richard and I have been collaborating with David Griffin to do this. This work has been fruitful, because we have been able to improve upon the initial calculations by several means. This work is ongoing but nearing completion. Preliminarily, it appears to provide a more precise indication of the crash latitude.
Our recent discovery of different optimal flight parameters for bearings greater than 180 degrees is driving our desire to refine both the fuel PDF and the SATCOM/GDAS PDF for bearings between 180-192 degrees. Some of those new route fits are complete, but more remain to be done to fill in the gaps. I will finish those once the debris drift work is completed and published. I have made some minor refinements to the fuel PDF calculations that enable optimizing the product of the fuel and the SATCOM/GDAS probabilities during the route fitting. Based on my initial work on this task, the drop-off in fuel probability for bearings greater than 180 degrees is expected to shift by several degrees to more southerly crash latitudes. I also expect some noticeable changes in the SATCOM/GDAS probability in that region.
@DrB
Many thanks for the update. I’m looking forward to the reports/updates! Good to hear that also the debris drift studies are still being progressed, and that you have been further collaborating with David Griffin.
@Niels
You stated “ I really still don’t know what to make of the 19:41 data point and if it is reasonable to include it in a “fixed setting” path all the way to fuel exhaustion”.
I have a lot of sympathy for your view.
Personally, I am convinced regarding the satellite (including BFO) and GDAS data.
I also note, that the FMT route we have proposed is more complicated than initially expected, but it is a perfect fit between the forward and reverse path in position, timing and fuel.
The fact that this FMT route also fits a radar and traffic avoidance, is a bonus.
This bonus results in a climb and solution for the BFOR at 19:41:03 UTC, which is an extra bonus.
The fuel model has been optimised to distinguish between all the fuel options, such as packs status, right engine shut down, fuel rebalancing and cross feed valves status.
Soon, you will see that a more complete and thorough analysis of the drift data, will further confirm our LEP and exclude certain other options.
It will take more time to investigate all the combinations of path, altitude, speed mode, fuel options, drift and aerial search. Only this time consuming analysis, will prove that not only our hypothesis is true, but all others are false.
@paul smithson
You stated: “If this were split into two tanks and separate engine efficiencies, it would come out at roughly 24:41 and 23:49”.
My fuel model result was a REFE at 23:54:07 UTC.
Your result is 23:45 UTC.
The difference is most likely to be explained with differences of assumptions, which I will dig out.
Meanwhile, I do not understand your statement quoted above.
How can a fuel exhaustion at 23:45, translate into left and right fuel exhaustions at 24:41 (56 minutes later) and 23:49 (4 minutes later).
@paul smithson
You asked: “@Richard. Your model run on my path proposal described here estimated that final fuel exhaustion came at 03:49, the right engine having gone down some 9:42 earlier. Can you tell me what initial fuel load was assumed for this?
In the full report on your path proposal, which I attached in the comment you referenced, I included the Aircraft Weight at your start point and at each handshake. The ZFW was assumed to be 174,369 kg at 24:19:37 UTC. The fuel weight at each point is simply the Aircraft Weight – ZFW. For example, at 18:33:15 UTC the Fuel Weight was 203,386 – 174,369 = 29,017 kg and at 19:41:03 UTC the Fuel Weight was 200,607 kg – 174,369 kg = 26,238 kg.
I assumed an altitude of 35,424 feet. The delta SAT at 18:33:15 UTC was 10.7385°C and at 19:41:03 UTC was 11.5772°C. I assumed the Air Conditioning Packs were on, there was no descent, the Right Engine was always on and the cross feed valves were closed.
@Richard. Thanks for that.
With reference to previous query – fat fingers.
If MEFE with consolidated fuel/PDA is 23:45, then separating out tanks and engines with flame-out separated by ~8 mins gives you roughly 23:41 and 23:49. Not 24:41 (obviously).
@paul smithson
Separating out the tanks and engines, you get a time difference of ca. 8 minutes.
Separating out the tanks and engines, I get a time difference of ca. 9.7 minutes.
So separation is not the reason for the difference between our results.
Your MEFE is at ca. 23:45 UTC.
My MEFE is at 24:03:49 UTC.
The difference is ca. 9 minutes or ca. 470 kg of fuel. The estimated 1σ prediction error in the fuel shortfall (and thus also in MEFE) is 427 kg of fuel.
So our MEFE difference is marginal, but we both agree there was a fuel shortfall at 00:17:30 UTC.
To analyse it further, I would need to know your fuel weight at 18:33:15 UTC and the average delta SAT for the flight path from 18:33:15 UTC to MEFE, assuming packs were on and there was no fuel rebalancing.
Sorry! Fat fingers or slow brain or both!
19 minutes, not 9 minutes…
That of course is way out of tolerance and requires an explanation.
@Richard
I saw mention of a research paper on Science Dailey yesterday that you will find interesting.
Abstracted from the Abstract:
“A key challenge ….. is to make Search and Rescue (SAR) algorithms more efficient. Here we address this challenge by uncovering hidden TRansient Attracting Profiles (TRAPs) in ocean-surface velocity data. Computable from a single velocity-field snapshot, TRAPs act as short-term attractors for all floating objects.”
I tracked down a preprint of the research paper “Search and rescue at sea aided by hidden flow structures” here:
http://www.researchgate.net/publication/335880840_Search_and_rescue_at_sea_aided_by_hidden_flow_structures
@George Tilton
Many thanks for the fascinating paper, regarding the Search and Rescue algorithms.
Please allow me a few observations:
(1) The paper is focused on Search and Rescue (SAR), but the findings are possibly relevant to MH370 floating debris, not just to people (or water training rescue manikins weighing 82 kg) floating in the ocean. MH370 floating debris averaged around 4 kg, the Flaperon was the heaviest item found and reported at 40 kg.
(2) The data provided by David Griffin (CSIRO), which we are using in the preparation of our next paper is based on the BRAN2015 model and has been checked against the BRAN2016 model. This is different to the MIT-MSEAS model used in this paper.
(3) The BRAN2015 model is not just a larger-scale model comprising measurements of environmental flows, producing Eulerian data, i.e., instantaneous information about the time-varying velocity field governing the motion of tracers or drifters, but also uses satellite altimetry data, as does the MIT-MSEAS model used in the current study.
(4) The acronym TRAP standing for TRansient Attracting Profiles is an understandable, but unfortunate choice.
(5) Is Broken Ridge a sort of large scale TRAP? Broken Ridge intersects the 7th Arc between 32°S and 33°S. Broken Ridge is an area of significant upwelling and downwelling. Floating debris tends to go around this area, rather than trying to cross it. Broken Ridge experiences significant changes in water depth causing upwelling, as well as being at the latitude where the winds and waves drive convergence at the surface and therefore downwelling of water. This causes buoyant material to accumulate at this latitude, right across the Indian Ocean. The same phenomenon occurs in all ocean basins, leading to the formation of the many garbage patches that have been observed. Another factor causing big differences in the way tracers, drifters or simulated trials transit the Southern Indian Ocean, as a function of their start latitude near the 7th Arc, is where ocean eddies happened to be at the start time.
(6) I fear, that the bigger picture is much more complicated than TRAPs. You have to consider currents, upwelling, downwelling, gyres, eddies, cyclones, convergence zones, and yes also TRAPs.
(7) TRAPs are a more local phenomenon.
(8) I have been to Martha’s Vineyard, where the sea trials took place for this study and with all due respect, the waters are not to be compared with the Indian Ocean, where I have also sailed a yacht. The currents, winds, depths, upwellings, downwellings, gyres, eddies, perfect and imperfect storms are all different.
(9) TRAPs are very important for SAR operations and may also effect MH370 floating debris items gathering in clusters, but the fact that 13 MH370 debris items ended up beaching in northern Madagascar, or 12 MH370 debris items beached in Mozambique and South Africa, or a Flaperon even reached Reunion, or an Outboard Flap was even discovered in a sea cave off the coast of Tanzania, has in my view, more to do with the Southern Equatorial Current, the windage of the various items, the along and on/off shore currents and winds, and the tides at each beaching location.
@Richard
I agree with your points…the technique requires a snapshot of conditions closer to the time of the incident. MH370 debris was subject to conditions over a much longer time scale (months to years).
I have something I will upload to my Google drive tomorrow that you will be interested in. It is getting late here in the States…
@Richard
You probably have plenty of nautical charts of the SIO.
Here is a portion of one on which I drew/pasted the ATSB search areas back in 2018. The original source chart was based on historical ocean current data from 19th century ship’s logs…the best data they had 75-80 years ago.
It will be interesting when your paper is published to see how your modeled drift patterns based on modern data compare to the ocean currents on this chart.
https://drive.google.com/file/d/1AWuUc4EkQu5F70rLtRmKVG02KHli2xWi/view?usp=sharing
Regards
@George Tilton
Strange! The SIO still looks much the same after all those years.
As an addition to the recent “19:41 BFO” discussion I prepared a short note on “BTO-only” path generation.
https://www.dropbox.com/s/drolcoirj44176z/BTOonly_polynomial_v3.pdf?dl=0
Victor,
Thank you and your fellow IG workers for the comprehensive report. I had been hoping that someone would try and include all the clues in one study. I’ve been following MH370 since 2014 and think your proposed route makes the most sense. I’m not convinced about an end of flight scenario though.
Norm Springer, Retired Land Surveyor
@Norman Springer: Thank you for your comment.
The remaining big questions are all between 18:22 and 19:41. I’m not hopeful that much more can be discovered.
@Ulric
To the contrary. We are awaiting DrB’s further analysis of the drift data.
In addition, the full solution space between 18:22 and 19:41 has not been explored to the same extent as a few paths from 19:41 to 00:11.
@Sid Bennet
Thank you. It’s very encouraging that skilled people are still working diligently on this.
@370Location. Having looked through your comprehensive work on hydro-acoustics, seismics and infrasound and your interpretation of various detections, here are some comments to complement those of others.
https://www.dropbox.com/s/o04u0au6sfg5ka3/For%20Ed%20Anderson%2C%20Java%20Anomaly%20comments.docx?dl=0
@370Location. One highlighted correction made and some editorials.
Mike Exner sent me a link to a Flight Global article referencing fuel indication problems on the B777. For the center tank, the indicated mass could be incorrect due to errors in the calculation of fuel density. (Volume and density are separately measured and combined to calculate mass.) As a result, the fuel loads for a mission could be too high or too low.
Although this problem pertained to the center tank, and MH370 had only fuel in the left and right tanks, it does highlight the need for accurate fuel indication for use in our endurance calculations.
@victor Thanks for sharing. That’s very interesting. Good find, @ALSM.
The associated FAA airworthiness directive, issued 3 June 2020, can be found here:
https://rgl.faa.gov/Regulatory_and_Guidance_Library/rgad.nsf/0/8d8f6fb8417828ca8625857c004b2852/$FILE/2020-11-11.pdf
As Victor mentioned and as stated in the AD, “this issue affects only the CWT and not the main tanks”.
@Victor, Andrew. The other point to bear in mind is that centre tank fuel should have been automatically scavenged on the previous flight. So even if the reading on centre tank was “wrong” it still had to be empty.
Still, the other point about the general difficulty in reconciling “fuel dispensed” with “fuel loaded” does introduce an uncertainty regarding the precise quantity of fuel on board that (I think) most of use were not previously aware of.
I brought this FG article and 777 AD to Victor’s attention because much has been written over the last year about the value/importance of using an accurate fuel burn model to constrain MH370 path models. The AD pertains only to the center tank, but one has to ask, why ONLY the center tank? Are not similar calculations required to estimate the fuel quantity (mass or volume) in the left and right wing tanks? I don’t know the answer, but the FG report and AD got my attention. At the very least, the experts on fuel burn models need to re-consider the assumed accuracy of the fuel quantity sensors and calculations used to derive the numbers that are used in the burn models.
The AD is applicable to The Boeing Company Model 777-200, -200LR, -300, -300ER, and 777F series airplanes, certificated in any
category, equipped with a Center Wing Tank (CWT) having a capacity
of 26,100 U.S. gallons or greater.
The AD does not mention -200ER.
@Victor, Andrew, airlandseaman
It’s interesting, and quite likely instructive, that the AD does not address itself to the B777-200ER.
Per the AD,
(c) Applicability
This AD applies to The Boeing Company Model 777-200, -200LR, -300, -300ER, and 777F series airplanes, certificated in any category, equipped with a Center Wing Tank (CWT) having a capacity of 26,100 U.S. gallons or greater.
That leads you to wonder if there’s anything about the design of the -200ER’s centre tank that would see it excluded from this issue.
@Mick Gilbert
@Pilatus
RE: “It’s interesting, and quite likely instructive, that the AD does not address itself to the B777-200ER.”
I think that’s because the Type Certificate Data Sheet (TCDS) does not distinguish between the -200 and the -200ER. Later variants such as the -200LR and the -300ER are listed separately, whereas the -200ER aircraft such as 9M-MRO (Serial 28420) are all listed under the ‘Model 777-200 Series’.
https://rgl.faa.gov/Regulatory_and_Guidance_Library/rgMakeModel.nsf/0/a58eb197f168e5c98625847000582c03/$FILE/T00001SE_R43.pdf
Let’s keep in mind…we don’t care about the center tank. We care about the accuracy of fuel estimates for the left and right tanks. The question is: Does this AD bring to light the possibility that the fuel burn models for MH370 could be less accurate than assumed?
@Andrew
Thanks for that clarification. That makes sense at an FSB certification level but for a matter like this, where the centre tanks on the -200 are markedly different from the -200ER that lack of distinction is potentially confusing.
On topic, there is a very good description of the differences between -200 and the -200ER with regards to the centre tank and specifically the Fuel Quantity Indicating System sensor set-up in the Singapore Transport Safety Investigation Bureau report on a fuel discrepancy incident involving B777-200ER 9V-SVC back in 2014.
https://www.mot.gov.sg/docs/default-source/default-document-library/b777-(9v-svc)-fuel-discrepancy-16-april-14-final-report.pdf
@Mick. A 41 tonne discrepancy! What a fascinating find and a very interesting incident. I am amazed.
@paul smithson
@Andrew
Yes, interesting read, isn’t it.
Andrew, if they were 41 tonnes heavier than expected, shouldn’t that have manifested itself on take-off? I would have thought that the required rotation speed would have been much higher than what they would have calculated.
@Andrew: I wonder if health monitoring or any other function within the AIMS attempts to validate the weight using airspeed and AoA data. Perhaps that would be too crude given the accuracy of the AoA measurement and also uncertainty in the location of the CG.
@Mick Gilbert
RE: ” That makes sense at an FSB certification level but for a matter like this, where the centre tanks on the -200 are markedly different from the -200ER that lack of distinction is potentially confusing.”
The AD is applicable to all 777s with a CWT capacity of 26,100 US gallons or greater. Ergo, it applies to the so-called ‘-200ER’ but not the standard -200, which has a much smaller CWT (12,400 US gallons). The B777-200 was originally offered in ‘A’ market and increased gross weight ‘B’ market versions. The ‘B’ market version subsequently became the B777-200ER, but it was certified as a B777-200. I’m fairly sure those who need to know can work it out!
RE: “…if they were 41 tonnes heavier than expected, shouldn’t that have manifested itself on take-off? I would have thought that the required rotation speed would have been much higher than what they would have calculated.”
Absolutely! Also, the thrust setting would have been far too low, so the acceleration during take-off would have been less than normal. Assuming they rotated at the speed for the lower (incorrect) weight, the aircraft would have been quite sluggish to get airborne. I’m surprised those aspects were not mentioned in the report.
@ALSM
RE: “The AD pertains only to the center tank, but one has to ask, why ONLY the center tank? Are not similar calculations required to estimate the fuel quantity (mass or volume) in the left and right wing tanks? “
I don’t know why this issue affects only the CWT, but I believe it’s related to the measurement of the CWT fuel density during refuelling, such that the system uses a density that’s too high when calculating the mass of fuel in the tank. Consequently, the system closes the refuelling valves too soon, believing the correct mass has been reached. Closing and re-opening the refuel panel door seems to reset the system, which then displays the actual mass.
The AD was only issued a week ago, so more information might come to light in the weeks ahead.
@Victor
I notice the Singapore the incident report gives some data estimate that I have been looking for: estimate of jet fuel density in that region (0.780 Kg/Liter)…vs. approx. 0.803 Kg/liter used in MicroSoft Flight Sim, which I assume to reflect standard USA density.
Of course it would be better if we knew actual MH370 fuel density, but the slightly lower 0.78 value is consistent with what I might expect for the region.
I believe the density is multiplier in the Boeing fuel endurance calcs, but not sure the impact (not at my usual desktop).
@Victor
RE: ” I wonder if health monitoring or any other function within the AIMS attempts to validate the weight using airspeed and AoA data.”
I’m not sure – I haven’t heard that such a function exists on the 777.
@TBill: The density of the jet fuel varies with temperature. If density is not measured, I would expect the density would be estimated using a temperature measurement.
@Andrew: It’s probably impractical given the accuracy of the AoA sensor and all the variables that might affect AoA versus airspeed.
On the subject of totaliser and FMC discrepancy, this may be of interest:
https://www.infinidim.org/totalizer-vs-calculated-fuel
And this one, commenting on the magnitude and direction of typical discrepancies between totalizer and FMC – specifically at the top of climb.
https://www.infinidim.org/calculatedtotalizer-fuel-pre-fuelling.
@Victor Iannello et al
The Five Deeps expedition was recently brought to my attention (https://fivedeeps.com/home/expedition/). The expedition’s goal was to make manned dives to the deepest points in each of the Earth’s five oceans.
Apart from a rather ‘cool’ manned submersible (https://fivedeeps.com/home/technology/sub/) the expedition dove on the the Java Trench and sonar mapped the deepest part of the Diamantina Fracture Zone (https://fivedeeps.com/home/expedition/indian/). The western extent of that mission appears to have brought them across the seventh arc a ways north of the current POI.
@Mick Gilbert: They were surprisingly close to our LEP. On Mar 11, 2019, the vessel passed over 033° 44.522S, 094° 15.493E, or about 36 NM away.
@Mick & Victor
I also ventured down that rabbit hole!
DSSV Pressure Drop is fitted with a ‘full ocean depth’ Kongsberg EM124 MBES on a hull mounted gondola. A Geoscience Australia image acquired during Fugro’s MH370 survey and depicting the Diamantina Fracture Zone is included at that linked webpage.
It appears that ‘Pressure Drop’ executes a wide area MBES survey of the potential dive site prior to deploying the ‘Limiting Factor’ manned submersible. I assume ‘Pressure Drop’ is continually collecting MBES data during its voyages.
‘Pressure Drop’ executed a survey of the Diamantina Fracture Zone’s Dordrecht Hole which is situated approximately 360NM east of the potential MH370 search area. Only a few tens of metres differentiate the seafloor depth at the Dordrecht Hole and the deeper Java Trench.
Each of the three OI vessels are now equipped with similar full ocean depth Kongsberg MBES systems, Constructor’s was fitted subsequent to its MH370 mission.
A KML file depicting the track of ‘Pressure Drop’ over the Dordrecht Hole is here.
@David,
Your detailed review document of my reports is greatly appreciated. My apologies for the slow response. I’ll attempt to address the major points here in the forum without being too verbose, in hopes that others might offer their insights.
Re Implosion: I can only speculate on the source of the sound.
I’ve seen that burst ratings on large tanks can be 100x the buckling pressure. The ratio for smaller tanks is probably not as dramatic, but you’ve probably seen what happens to a railroad tank car when steam condenses inside. That’s less than 14.7 psi.
Full implosion of a pressure vessel might not be necessary. Just the buckling of a structural component due to weight shifting might be enough.
A fuel-air mix doesn’t cool under compression. Think diesel. That’s probably not significant, being slow enough over minutes to be near isothermal.
If it were parts of the plane hitting the seafloor at 4 m/s, one might expect a series of sounds. Perhaps a large section like the fuselage stayed afloat longer and then hit a wing already on the seafloor.
Re Explosion: Gas leakage from a damaged battery should not cause explosion in a vented cell, but poly packs can bloat and explode in a thermal overrun chain reaction. Primary lithium cells (avionics backup batteries, sealed emergency flashlights?) might also react with water and explode.
The size of the explosion needed for detection is dependent on the location. Surface events over deep water are almost undetectable, yet a device battery pack exploding on a sloping coastal seafloor was detected as clearly as the San Juan submarine implosion. Seismometers can also be fairly sensitive. The only strong events seen at Christmas Island I recall mentioning were references to cataloged quakes. The seismic signals from the Java Anomaly were only detectable on the nearest seismometers.
Re ARA San Juan: I mostly analyzed the signal to check my algorithms, and to document the upslope-then-downslope T-wave reflections at favorable angles along the coastline causing the three major arrivals. The explosive charge test was in slightly deeper water than the sub. It might have caused a bubble-pulse implosion as analyzed by the CTBTO. I didn’t see that, but I suspect both noise sources would have traveled first upslope to 200m depth and then downslope into the SOFAR channel. Multiple conversion points might have looked like a bubble pulse. I was also unable to pick it up on seismic stations.
I don’t know if there was any sort of signature that might help determine the depth of the Java Anomaly, but I suspect it may have been SOFAR depth or deeper (including the seafloor).
I haven’t seen those references to using one-shot explosives for underwater seismic survey. I would be a shame to rule out the Java Anomaly as being MH370 on the possibility of illegal blast fishing at that particular place and time, in deep water.
Re Infrasound: I might never have known about the LLNL poster report were it not for your mentioning it in this forum. Only on a later reading did I notice that the magnified graph at the bottom of the poster had better detail on the 22:46 blip.
The spectrograms are of sounds near the upper limit of the seismometer sampling rate. The 100km range reported for CTBTO infrasound detection of a jet passing might be for a slower pressure pulse, especially with Mach .85 speeds. I did not explore that because I cannot obtain Cocos infrasound data for MH370. I was only verifying that the premise of the (flawed) study was correct, and local jet takeoff/landing is easily detected by infrasound.
My understanding of the CTBTO analysis is that they looked at an array in Japan since the search area was still in the South China Sea, and they were looking for a midair explosion. The report only showed automated threshold detections. I don’t think they ever reported on Cocos analysis after the search moved to the 7th Arc. The 180-188 heading would have taken the plane some 400km west of Cocos, so probably out of range.
The Hubert Foy analysis can be accessed here:
http://africsis.org/wp-content/uploads/bsk-pdf-manager/Article_on_Missing_Malaysian_Flight_14.pdf
(Removed www from africis.org, as dns is broken on their own links.)
I suspect much more could be done with the array of seven infrasound stations, in terms of tracking the altitude and direction of travel if it was a near flyby as I explored with the one seismometer.
I take the recent ADSB timestamps as accurate and matching the seismometer timing, whereas the only 2014 info was the scheduled arrival/departure times. Still, the match was very good.
Re Seismic: I see what appears to be constant throttle reverse thrust on an unreported 00:55 UTC landing at Diego Garcia, 13 km from the II.DGAR seismometer.
The landing whump might be a combination of very low frequency and higher pitched tire friction. I was concentrating on what looks like engine whine.
I’ve also been examining what might be low pass jet flybys away from water, and the doppler is not what I’d expect. It looks like the sound from the plane is conducted through the ground below the plane as it approaches a seismometer with minimal doppler, but less as it recedes with doppler drop. Weird. That should not effect an infrasound array.
I previously looked at planes sequentially passing over a seismometer on final approach, near Alice Springs, IIRC. Absent noise interference, it looks like both seismic and infrasound can be used to detect low jet traffic.
A Beechcraft went missing in N California last year. I found faint detections of its outbound leg but I was unable to track its return from takeoff at the coast, so it probably ended offshore.
Re Misc: I examined seismics for the Lion Air crash, and found no obvious signal. It could be because of local noise, or that the energy of the crash into the shallower water was directed offshore.
You asked about ditching vs a holding pattern, but I only wrote that the 55 minute delay might be more likely due to sinking rather than an impact after an unlikely holding pattern at that spot. I considered not mentioning the holding possibility.
Re Barnacles: As for most prolific range, I believe they reproduce in 18-24C but can survive to 35C. Thanks for pointing out the error on 35C reproductive range. I meant to write 24C, and should probably note instead the full 18-24C. I’ll fix that.
I have just reread the Final report 3oct2017 appendix F on temp vs growth. I see now that there are mixed results. I will take a closer look at my wording about faster growth at cooler temps.
Re Intentions: I’ve tried to avoid tying my findings to any intent, the timing of the detections implies flying at lower speed, and so lower altitude. Several of your questions about why or how, and intent or motivation aren’t really anything that comes directly from my evidence. I’ve tried answering some of those questions on Twitter exchanges, and it appears that stepping into any one camp is grounds for dismissal. I’d like to defer a discussion about intent, and stick to what I’ve reported.
Re Drift: Like the fuel modeling, I have not run my own simulations on drift. I’ve digested all the MH370 papers I can find on the topic by others. I am hoping that the true experts will be open to running my far northern site through their forward drift models.
Re 7th Arc Anomaly match: I don’t depend on gliding before entry or ditching. The AF447 debris field was relatively small, with some fragments on top of each other. Given that the sound was from deep water, it would seem that the accuracy of the candidate site is as good as the localization of the sound, regardless of what happened at the surface. However, I’m working on improving the filtering of a very weak H08 signal arrival on the same bearing as the Java Anomaly. If my 1:15:18 time late event time is accurate, the the weak signal indicates an impact five seconds after the last ping at 00:19:37. There are also signs of a VLF 1 Hz signal several seconds earlier that might be due to faster sound speed outside the SOFAR channel.
Well, I tried to keep the brain dump brief. Thanks for exploring my reports, and to all for allowing the bandwidth here.
— Ed Anderson
@370Location. Thank you.
A few return comments:
• I agree re bursting vs buckling though have doubts still as to the origin of an implosion/explosion powerful enough, particularly with the likelihood that water entry would have relieved the pressure difference in pressure vessels. Also there was just the one noise as I understand it.
• Re an explosion of a fuel-air mix, while the rapid air compression in a diesel, adiabatic except for cylinder heat added, generates the temperature needed for an explosive ignition on fuel injection, in a slow compression of a fuel-air mix on sinking the mix will be cooled by its surrounds, needing another source of ignition.
• According to the CTBTO the Argentinian depth charge exploded at 30 m, so not beneath SOFAR depth as you have it – though perhaps you mean it bounced from the bottom back up. (From their report of March this year, under Fig 5, “Using an equivalent TNT yield of 102 kg for the Mark 54 depth charge….and the observed cepstral delay of 0.45 s gives a detonation depth of approximately 30 m……..”)
The French CEA said 33m at p.10 of the slides below:
https://ctnw.ctbto.org/ctnw/abstract/33155.
• Re allowing for taxi times, what I was getting at is that the LLNL posters times are not in round 5 minutes intervals but to the minute, suggesting these were not gate departure times but actual take-offs and landings, e.g; 12:44, 15:03, 13:43, 15:59. If so taxi-times are ‘allowed for’ already. Without their addition the data timing does not match well?
• Re your, “If my 1:15:18 time late event time is accurate, the weak signal indicates an impact five seconds after the last ping at 00:19:37. There are also signs of a VLF 1 Hz signal several seconds earlier that might be due to faster sound speed outside the SOFAR channel.” Interesting.
• You stand to make a contribution to seismic and infrasound detection of aircraft generally.
370Location wrote: “Re Seismic: I see what appears to be constant throttle reverse thrust on an unreported 00:55 UTC landing at Diego Garcia, 13 km from the II.DGAR seismometer.
The landing whump might be a combination of very low frequency and higher pitched tire friction. I was concentrating on what looks like engine whine.”
Is data available for the II.DGAR seismometer during the period 0530UTC-0900UTC 2014-03-07? Is so, it should be possible to correlate with an Omni Air 767-300 that landed, and departed, NSF Diego Garcia during that period. It approached & departed via waypoint BUMMR (yes, really) at S6º E71º55.
It’s possible that the 2014-03-08 0055UTC event was a similar, regular, Air Mobiity Command charter arriving via Paya Lebar from Kadena or Yokata, Japan. I have no timings for that routing.
@Don Thompson
RE: ”It approached & departed via waypoint BUMMR (yes, really) at S6º E71º55.”
In the early 1990s there was a series of waypoints in an arc around Diego Garcia. They were named, in order, WHATA – BUMMR – MOMMA. BUMMA and MOMMA still exist, but have been moved from their original positions. I guess some people didn’t appreciate being posted to Diego!
@370Location. My third paragraph second line. By “it” I of course mean the noise.
@David, Thanks for letting me clarify my thinking…
Re Implosion: I get your point about water entry, perhaps from a broken connector/pipe. What I was suggesting is that the negative buckle psi of a sealed container might be well below a rupture plate psi.
Re fuel/air ignition: I never meant to imply that a combustible vapor mix might self-ignite. I was suggesting that a spark or damaged battery might ignite it. I mentioned the compression because that would increase the explosion energy.
Re ARA San Juan: I have not been trying to use the submarine or test charge as a signature for MH370. I had previously thought that the SOFAR depth might be near the depth of the test charge. The sub was found at a depth of around 900m, while the water depth near the test charge was around 1250m. I just ran a plot, and the SOFAR depth in that area is relatively shallow at around 225m. That’s approximately the same depth as upslope T-wave conversion. The sub would be below SOFAR depth, and the 33m test charge well above it. If both needed upslope conversion, then the conversion point would be some 28 km west of the sub and 55 km west of the test charge. I didn’t calibrate the Ascension hydrophone locations with other events that day, just used the CTBTO reported lat/lon for the bearing calc. The timing wouldn’t shift that much to the north, but would be significant to the east.
Re Infrasound takeoff/landing times: The poster was about checking to see if the jet traffic was detectable at all. The scheduled times just gave an approximate idea of when to look. The takeoffs/landings were easily detectable by seismometer both in 2014 and 2019. Infrasound in 2019 was able to track the position of the plane on the runway. I expect the recordings have accurate subsecond timing calibration, better than ADSB (or airline schedules).
Thanks for your estimation that this work is worthwhile. 15 months after taking the site public, this forum has the only search engine links to: http://370Location.org
@paul smithson
RE: “And this one, commenting on the magnitude and direction of typical discrepancies between totalizer and FMC – specifically at the top of climb.”
In-flight discrepancies between the totaliser and calculated fuel quantities have been an issue on the B777-300ER for quite some time. Discrepancies of the magnitude described in Ken Pascoe’s blog typically occur on ultra long-haul flights with fuel loads well over 100,000 kg (ie a significant amount of fuel in the centre tank). In normal operations I have not seen or heard of large differences between the totaliser and calculated quantities when only wing fuel is loaded. To my knowledge, the issue has still not been resolved.
I have been told the airlines are awaiting further information regarding the airworthiness directive mentioned in the comments above; however, it is not thought to be related to the issue described in Ken’s blog.
@370Location. OK thanks.
@Don Thompson,
I pulled II.DGAR data for 48 hrs to search for the Omni Air traffic, and found another seismometer in the same bunker at twice the bandwidth. I got bogged down because the azimuth info on the older STS-1 recorder points right at the runway, while the STS-2 appears to have some phase error (or my polarization analysis code is flawed).
There are several takeoff/landing events in the 0500-1000UTC time period. Here’s a large .pdf that should be zoomable:
https://www.dropbox.com/s/0n50zwo2tsw7x3e/200612-2351-DGAR%40050000-100000-Win500-SeismicPlot-fig.pdf
I won’t attempt to interpret those events, but the 8 Hz sounds in green are coming from a different direction than the runway. Because they start and stop abruptly, I suspect they are from a building near the seismometer on bearing 125.
The 00:55 event I mentioned looks different from the other traffic. Here it is at 40 samples/s:
https://www.dropbox.com/s/zpwlg3mz8ufr6la/200612-2222-DGAR%40005300-005700-Win500-Spectrogram-fig.pdf
And again at 20 samples/s with the STS-1 azimuth info:
https://www.dropbox.com/s/f571fgcr5wkmhv5/200604-0545-DGAR%40005300-005700-Win250-SeismicPlot-fig.pdf
What I figured to be constant throttle reverse thrusters, I now see is modulated at a rate of about 1 Hz that slows somewhat. I’ll leave that as a puzzle, as I only have guesses. Something else kicks in continuously from dusk to dawn, but 00:55 is just past that disturbance.
@Andrew. Thanks for that.
why has the 777-200 sized aircraft found near mauritius in march 2014 never been investigated. also why has this aircraft never been identified if its not MH370. Why do the authorities keep avoiding this area between Round and Serpent Islands. are they afraid that they will find it. do they want it found or not, if they do then Serpent Island area needs to be searched.
@peter: Please be more specific about the “777-200 sized aircraft found near mauritius in march 2014”. What facts support this?
Hello,
While awaiting DrB’s analysis on the new drift data, I have been pondering my assumptions regarding the path.
Some time ago (maybe a month or so) I suggested that a family of paths existed where the total path length is nominally constant, and also constrained by the LRC fuel model.
Further, after being pummeled regarding the flight control mode, I started to consider the rhumb line options.
My favored solution, as you all know, is the 186T (GCP or loxodrome) with a turn at about 18:40 at IGOGU to ISBIX. To answer the criticism regarding the flight mode after ISBIX I had hypothesized that a pilot has selected a track hold from the control panel. In this case it could be 186T as the initial azimuth after the turn to ISBIX or turning the knob to 186T. In effect this is a waypoint solution.
Having a bit of time on my hands, I started to consider turn times earlier than 18:40 from the offset path of N751 and found that with a little adjustment in the start times or lat/long I could get plausible solutions with azimuths between 186 and 189. These were rhumb limes.
But, since there was no waypoint except IGOGU after 18:22 or so and the turn would be made prior to IGOGU, by control panel input, I think, in retrospect, that the azimuths of a true track solution for an earlier turn time would be restricted to integral degree azimuths.
I hope I have made myself understandable. I really don’t want to do a systematic study if I have forgotten some important point.
(today is on-line bridge day, so any further comments from me will have to wait until later….)
@Victor
I think you’ll find that @Peter is the infamous Peter McMahon (aka Matthew McMahaon now) from the below tabloid stories and the NZ DJs (Duncan Heyde and Thane Kirby) from quest escapades and the same one who trolls NOK social media accounts. He’s just reinvented himself on a new trolling campaign.
https://www.thesun.co.uk/news/5839167/missing-flight-mh370-found-on-google-earth-riddled-with-bullet-holes-crash-investigation-expert-claims/
https://www.dailymail.co.uk/news/article-5823535/Radio-DJs-crowdfund-search-MH370-explore-Indian-Ocean-missing-plane.html
@Mick Rooney: Thanks for the heads-up. As you can see by the lack of any response from contributors here, this kind of silliness doesn’t get oxygen on this site.
Anybody (Aussies?) seen this video about MH370 on Discovery Australia.
Very intriguing interview with Dr. Usama Kadri.
https://www.youtube.com/watch?v=Qzvr2w2IVug
CanisMagnusRufus,
Sensationalist click-bait. Not in the least bit intriguing. Let’s move on – nothing to see.
@sk999
+1
I stopped watching it closely when one expert claimed the 7th arc was based on the maximum distance from fuel considerations. Then Usama Kadri again got my attention, until that discussion also went off the rails by a suggestion that it’s possible that the true path extended to the west of Diego Garcia. What a waste.
The missing 25 minutes of data has been mentioned before – and is intriguing. Do we know the time span involved – UTC begin / UTC end ?
@ VictorI
when I see the reaction here, I’m reminded of JW’s reaction to objections to his Northern route.
I noticed, both here, and in JW’s blog, the intolerance towards any opinion that suggests that maybe, just maybe, we should be cautious about accepting the BTO as sacrosanct.
Heck, I’d even go as far as to say both blogs exist to ‘protect’ the official theories based on SATCOM & BTO data.
I’m glad Dr. Kadri is pursuing the hydrophone data.
@CanisMR: I am willing to challenge the interpretation of the BTO data if there was evidence that it might be corrupted. I am not aware of any. It remains the most solid piece of evidence we have in the time after the last radar point. Without the BTO data, we would have no idea where to search.
@Victor
Yes, the speed of light has not changed in over three and a half centuries of measurement.
Usama Kadri, the focus of the “Discovery Australia” program, has written at least two papers on analysis of the hydrophone data r.e. MH370:
1. https://www.nature.com/articles/s41598-017-14177-3
“Rewinding the waves: tracking underwater signals to their source” (2017)
2. https://www.nature.com/articles/s41598-018-37626-z
“Effect of sea-bottom elasticity on the propagation of acoustic gravity waves from impacting objects” (2017)
I will not comment on the scientific merit or validity of any results in these papers – even the author acknowledges that they are sketchy at best. It is useful to note the following:
a. There is no citation to ANY published report or paper on MH370. No MOT report. Not ATSB report. No JON. No Bayesian Methods. Nada. Squat. Zilch.
b. Over half the citations are to papers where Kadri is first author or a co-author.
c. The first paper has had 3 refereed citations – all by Kadri himself. The second paper has had none. (YMMV – depends on which citation index you use.)
d. In the first paper, there is the following statement:
“Also, note that MH370 is believed to have crashed close to the 7th arc due to fuel considerations.”
e. Discovery Australia interview, Kadri:
“If you blindly trust the 7th Arc then you wouldn’t even look there … at this data.”
[The context, I think, is in reference to a proposed location near Madagascar, although the youtube video is unclear.]
However capable Kadri may be in his field of expertise, it is clear he has only the vaguest idea about how the search area was defined in the first place, and his concept of “blind trust in the 7th arc” is, at best, based on ignorance, not knowledge.
I repeat – not the least bit intriguing.
@sk999
So were the discoveries of the sunk subs ARA San Juan, and the Minerve were achieved without recourse to any analysis of underwater sonic waves?
How are those search efforts any different from what Dr. Kadri is trying to do?
@sk999
“due to fuel considerations”
I have not yet read the article. But, you are being overly critical.
Indeed we believe that the existence of the 7th ping at 00:19 resulted from fuel exhaustion and associated re-log-on when the APU started.
Without fuel exhaustion, the 7th ping would not have occurred for another 50 minutes or so.
When I read the article, I may have more to say.
In my humble opinion, there are multiple independent sources of information that can be analysed in searching for MH370.
1. Satcom data (BTO/BFO) – most promising
2. satellite imagery
3. hydrophone acoustic data
4. radar (Thailand/Indonesia/Australia/Diego Garcia/Maldives/Mauritius)
5. drift modelling
6. AIS of fishing vessels/ships/ pleasure craft
If the search was genuinely a good faith effort, it would make use of all this information.
See below, excerpt from Le Monde on the discovery of the Minerve.
***** Google Translation *****
“Triangle of uncertainty”
But it is thanks to the calculations of the Atomic Energy Commission that the prospecting area was able to be refined, further south than the one hitherto predicted. The “uncertainty triangle” traced by surveys of seismic stations that recorded the implosion of the Minerva from various points in 1968 has been reduced, which significantly increases the chances of finding the ship. In addition, the SHOM (Hydrographic and Oceanographic Service of the Navy) was able to model in more detail the deep currents of the region and also use the estimates made from a sheet of oil escaped from the sinking.
**********************
https://www.lemonde.fr/societe/article/2019/07/22/le-sous-marin-la-minerve-disparu-en-1968-a-ete-retrouve-au-large-de-toulon_5492027_3224.html
@CanisMagnusRufus: People here simply prioritize the available data based on our estimate of the relative reliability. Nobody is ignoring data unless it conflicts with data deemed more reliable.
In the case of the San Juan, there was an acoustic event in the vicinity of the last known position (LKP), and that calculated position of the acoustic event was close to the extrapolated track of the sub. In that case, the acoustic event of course provided important information. In the case of MH370, we don’t have a LKP that is close to the crash site, nor are we even sure that a crash on the surface of the ocean will generate a detectable acoustic wave. The two cases are very different.
@VictorI
I feel there is important information to be obtained from hydrophone data regarding MH370 for 2 reasons.
1. The fact that 25 crucial minutes of the hydrophone data from DG are missing should raise all sorts of red flags.
2. And when Curtin University first released their results of the hydrophone data analysis, on the same day Kate Tee’s fantastic tale of sighting what may have been MH370. I believe this was done to bury the story of Curtin results.
Here’s an excerpt from the blog of a military veteran:
On March 13th, Martha Raddatz, Senior Foreign Affairs Correspondent for ABC News filed a story about the comms systems being shut down separately with this statement: “U.S. officials said earlier that they have an “indication” the missing Malaysian Airlines jetliner may have crashed in the Indian Ocean and is moving the USS Kidd to the area to begin searching.”
I believe this is one of the most credible pieces of information about the disappearance of this airliner to come from any source.
First, it went to the Senior Foreign Affairs Correspondent for ABC News, not some stringer or foreign journalist. Her source is probably a cultivated one. Second, the source is carefully masked as a generic “U.S. Official” which generally means a military source who doesn’t want to be identified for leaking information. Third, the word “indication” was used without elaborating on it except to tie it directly to the plane crashing into the sea. I’ve seen information obtained from submarines disclosed in this kind of obscure language before in the media. I think a USN Sub on patrol off Malaysia, perhaps transiting to the Persian Gulf, may have heard the airplane hit the water.
Here is what may have transpired. A sub’s passive sonar station is constantly manned night and day. It consists of a series of arrays of hydrophones that run along the hull on both sides and a computer that can analyze the sounds the sub hears and help classify them for the combat information center on the sub.
This computer can also determine a line of bearing on the contact and estimate the range (and even the depth, if submerged) by comparing the sound signatures between hydrophones as they run along the hull. Its accuracy in predicting range decreases depending upon the distance of the sound source and other factors like temperature, depth, salinity, and the thermocline layers that these factors combine to create.
A 330-ton airliner hitting the water at 500-600 knots would sound like a gigantic explosion underwater. And I mean gigantic, roughly 4,500 lbs of TNT going off and exerting a force of 20,000 psi on the water at the impact area. This would result in a giant over-pressure condition in the water that would emanate out as a shock wave (in contrast, the big depth charge explosions in WWII movies were only 300lb charges). It would have a huge sound signature that would travel tens, if not hundreds, of miles, depending upon conditions.
If the sonar operator heard such a sound, they would give it a contact number and log it. At intervals during the day and night, the submarine un-spools an ultra-high frequency antenna buoy and transmits a micro-burst of radio energy to a Sat, which gives the sub’s position, course, heading, crew emails, and various situation reports that would include contacts of interest or unusual occurrences that they think they should phone in. A large underwater explosion would probably qualify as an unusual occurrence.
Raddatz’s report does not say what time that indication was obtained, which further suggests a submarine provided the information. Tell the time and place you heard the noise and you’ve got a good idea of that sub’s position. We can assume from the time the ACARS pings were being logged that this would have been early daylight of March 8th. That “indication” was considered so credible that the Navy diverted the USS Kidd to the area at high speed to investigate an area that was probably more narrowed down for it by the Pentagon.
Unfortunately, the connection between that underwater explosion and the missing airliner was not made by the Pentagon until the 11th or 12th, by which time the debris field would have dispersed considerably if any floating debris even existed.
https://sofrep.com/news/alright-goodnight-malaysia-want-know-happened-flight-mh-370/
@CanisMR: The search was moved from the SCS to the Indian Ocean based on the military radar data. There was disagreement among the civilian and military officials over where to search. The logjam was broken when the US moved its assets to the Indian Ocean. I based this on first-hand accounts.
@Victor Iannello
Victor, re ‘The search was moved from the SCS to the Indian Ocean based on the military radar data.‘, just to be clear on that, we’re talking about a shift of the search zone to the Northern Indian Ocean at that time.
The USS Kidd was despatched from assisting the USS Pinckney in the Gulf of Thailand to search the north-western end of the Strait of Malacca/Andaman Sea on or around 14 March. Three days later, on the 17th, the Kidd and other US 7th Fleet assets were detasked when the search zone shifted to the Southern Indian Ocean.
@CanisMagnusRufus and all,
Re: https://www.youtube.com/watch?v=Qzvr2w2IVug
Debunking comments on that Youtube video are being blocked by Discovery Australia. If anyone else has followed up with facts, check that your comments are visible to the public, and not just you. Mine are blocked. (This is a historical problem with mis- and disinformation of all sorts on Youtube. Crackpot theorists can hide any criticism without the critics realizing it.)
A Discovery Channel UK Facebook page teaser for that MysteriesOfTheDeep episode on MH370 made the rounds on Twitter:
https://www.facebook.com/DiscoveryUK/posts/10157207574111711
The allowed my debunking comments on that page, which some might find of interest, or be willing to expand on.
It triggered Twitter exchanges with @usamakadri1 but they were fruitless.
https://twitter.com/search?q=%40usamakadri1&f=live
The ATSB asked me to help Kadri with the data, and I did. He had no interest in discussion of the acoustics, such as my attempts to characterize his novel Acoustic Gravity Waves. I also helped to review Kadri’s first paper for the ATSB and others in this group. It had some major flaws. His second paper miscalculates the bearing for known seismic survey sources, and the signal he says comes from Madagascar is the same anomalous signal that I’ve pinpointed on the 7th Arc near Java. I made some notes on Kadri’s second paper here:
https://370location.org/2018/07/refining-hydrophone-triad-bearing-calibrations-with-seismic-survey-source-info#feb2019update
The missing data gap that is touted as a conspiracy came over three hours after 7th Arc timing and was brief. That makes it mostly insignificant compared to the signals that I have found and analyzed. Three of his purported signals are impossibly within that missing gap. He reports on a signal arriving at Cape Leeuwin hydrophone H01 at 00:50:00 on bearing 234.6 degrees, which has been hailed by others as evidence for sites well south of 7th Arc. There is no evidence of such a signal in any frequency range at that time. It falls between the three signal clusters reported by LANL, and should be visible in that published report.
Kadri’s responses on Twitter are very telling. He has no interest in correcting his calculations so that they might be useful.
The news report of a US official with a tip on dispatching a USN destroyer to the SIO is interesting, but we may never get any info about whether it was based on an acoustic detection. It may well have been early intel on the satellite data. If the USN really did have a sub in the IO and it detected the impact, it does not make sense that they would be joining in on other shifting aerial and surface search areas.
It still baffles me that news media and documentaries have reported on Kadri’s work, while detailed acoustic analysis with a fruitful result is all but ignored. As far as I can tell, the only search engine links to my 370Location.org website (which has been public for over a year) come from my comments in this forum. I thank you for allowing me to participate.
@Ventus45 asks “Do we know the time span involved…?”
The H08 hydrophone data from Mar 8 2014 has a large DC offset jump at 03:07:41 UTC. There is some attenuation of the data until goes to zero from 03:35:36 to 04:00:00 UTC.
It’s possible that I mangled it on conversion from the files I obtained unofficially.
The CTBTO has released all of their H08 hydrophone data since Dec 8, 2014 onto the public seismic networks. They also released all Cocos Island IO6 infrasound recordings only since May 3, 2014, despite standing requests for Mar 8, 2014 data.
http://ds.iris.edu/mda/IM/
If the CTBTO could make all of their MH370 recordings from the Indian Ocean public, it might reveal new insights. Their infrasound array has eight stations on the island, and could confirm or refute what appears to be a flyby of MH370 detected by a single seismometer.
If anyone has connections with the UN, CTBTO, or national research labs, please do lobby for public release of the MH370 recordings.
Ditto for anyone who could lobby the French CNRS and OHASISBIO for public release of MH370 recording data from six hydrophones that were active near Amsterdam Island. Their unpublished 18 page report LDO-201608 on possible acoustic matches with MH370 has details on the data.
https://www-iuem.univ-brest.fr/lgo/les-chantiers/ohasisbio/?lang=en
Correction – CTBTO infrasound since April 3, 2014 (not May) is public. Anything earlier than that is only accessible to institutional researchers on contract with the CTBTO.
@Mick Gilbert said: just to be clear on that, we’re talking about a shift of the search zone to the Northern Indian Ocean at that time.
Correct. It’s good that you highlighted that, because it’s been a source of confusion in the past.
@370Location: I have little doubt that your analysis of the acoustic event is correct. Where we differ is whether this event is likely from the crash of MH370. I must admit that the proximity to the 7th arc is very intriguing.
I hope readers here and elsewhere continue to analyze and discuss your work.
@VictorI,
Thank you, Victor, for your encouragement, and for continuing to provide this expert forum.
What sets the anomalous Java event apart from any geological source is the strength of the arrival across the ocean on the Diego Garcia hydrophones. Even Kadri detected it above the seismic survey noise that LANL said excluded H08 from being useful. It is there in both Curtin reports, first on H08 (assumed to be a quake in the Java trench) and then as the signal analyzed from Scott Reef. Nobody, including me, Curtin, OHASISBIO, or others recognized that all hydrophones (and T-wave stations) with a path are precisely consistent with a specific origin on the 7th Arc.
Catalogued quakes at M4.1 and M4.4 near Java that day are nearly invisible on any hydrophones, but prominent on seismometers. This anomaly that’s strong on hydrophones barely registers on nearby seismometers.
I haven’t seen anything similar in days of recordings that I’ve analyzed. It’s as strong as many ice events, but without that characteristic frequency dispersion from a shallow source.
Something odd happened directly on the 7th Arc near Java at time MH370 debris would be sinking.
Has anyone ever considered what would happen to a pallet of Lithium-ion batteries, probably some being damaged during the aircraft’s impact with the water, but all being placed under increasing pressure as the aircraft and its contents descended toward the seabed?
The rate of descent is dependent on the permeation of water into homogeneous spaces and the compression of other susceptible spaces. In respect of Lithium-ion batteries, the electrical conductivity of sea water, may also add to the resulting outcome, i.e. in the event of an explosion.
To put it into perspective, implosions caused by over pressurization of containers is one thing, and landing gear tyres/tires are another. Though in the case of tyres, AF447 showed that the tyres stayed on the wheel rims and the increasing water pressure caused water to slowly replace the contained air.
Interesting. Perhaps all those Lithium-ion batteries were progressively being crushed by the increasing pressure as they sank. One may have shorted out internally and exploded first. That shock wave would have impacted all the others nearby – all of them similarly crushed and ready to short circuit and explode anyway. Think of the first one as being a detonator – setting off all the others together – as a larger charge / blast.
I have indeed considered the possibility of the lithium-ion batteries on board being a possible source of an explosion. A primary lithium backup battery might also react directly with seawater. Here’s a quoted paragraph from my website:
“An underwater explosion after impact is also possible. A compartment with a highly compressed fuel-air mixture might have ignited. The cargo manifest listed 221 kg of lithium-ion batteries, plus hundreds of batteries used in phones, flashlights, laptops, plus avionics backup batteries. Lithium-ion battery packs are known to catch fire and explode from mechanical damage or overcharging. The impact would have damaged many batteries, causing internal short circuits. Not only the shorted cells overheat, but cells wired in series-parallel can be subject to immediate overvoltage from neighboring shorted cells. Either condition can initiate a thermal runaway that results in violent outgassing of combustible vapor, with a chain reaction of packed cells leading to explosion. CTBTO reports that in 2006, a primary lithium battery pack exploded in an ocean bottom seismometer off the coast of New Jersey, and was clearly detected by the hydrophone triad at Ascension Island, 7,900 km across the Atlantic Ocean.”
(See the 370Location.org site for a link to the full CTBTO report.)
@370location
Very interesting paper – thanks.
http://www.oal.whoi.edu/multi/videos/Mark_Prior_ECUA_2010_paper2.pdf
The bottom lander, designed by Oregon State University, deployed as part of the Shallow Water 2006 experiment involved a sealed housing for the lithium batteries. The project described the incident as resulting from gas accumulated inside the battery housing igniting and the explosion blowing off the housing endcaps. This logger was located very close to the edge of the continental shelf (the project reports provide a specific location) at a depth of only 110m with the sloping continental shelf enabling translation of the impulse into the deep sound channel.
That an impulse from such an explosion would propagate across the ocean isn’t a novel idea. A calibration method has been demonstrated to show that the mechanically induced implosion of glass spheres at DSC depth will generate an impulse that will propagate over oceanic distances.
However, considering all the possible lithium battery sources onboard 9M-MRO I’m not aware of any that would be enclosed where a buildup of gas might lead to an explosion: the avionics LRUs all involve enclosures permitting through flow of air for cooling; the PDRM/RMP test report on the Motorola battery (should you choose to believe it) describes that the packaging was not ‘air-tight’; there is nothing in the cabin or holds that would sustain a pressurised “bubble” around PEDs after impact.
It does not seem likely that, following the aircraft-ocean impact, so many separate, small, Li-ion battery units would deteriorate due to physical damage and immersion so as to cause a simultaneous impulse.
@Don
A very sensible conclusion, IMO.
@Victor
@DrB
I was studying DrB’s prior CMT path to 31.5 South, and this gave me the idea correlate the pilot’s home simulator work approx. 3-Feb-2014 with the winds aloft below 22 South, on the hypothesis that by the 7-March-2014 flight date, the pilot might have seen that the winds had picked up strongly during that month. Which seems to have been the case. (These days I like the idea that the home simulator work might have been 180 CMH w/ 25 knot winds west-to-east).
This wind change might explain a planning shift to Track or LNAV, either from the outset of the post-FMT flight (if passive) or perhaps after Arc5 (if active). Many have pointed out CMH or CTH does not work due to the high winds below 22S, but OK, that’s an easy button to push to negate that wind effect, on the assumption the pilot had a plan.
@Don,
Thanks for the input, and the additional info on the long distance detection report.
One possible noise source might be waterproof flashlights. There are many reports of Li-ion batteries turning sealed flashlights (and vape pipes) into small pipe bombs. Some explosions have been lethal. I see that many of those use the CR123 cells, which might be in series. Any battery could internally short out with a strong impact. Many people travel with flashlights in their carry-on bags, and there may be some with primary lithium cells kept on the plane.
I have wondered if a buildup of hydrogen gas from the palette of Li-ion cells might combine in an air pocket and be explosive with an ignition source.
Another possibility is that a volume of built up vented gas might bubble out at once, leaving say a cargo container to then buckle in on itself.
I can’t really know what made the sound, but something made a loud noise directly on the 7th Arc around the time MH370 debris was likely sinking. We can speculate about sources, but I think it would be wrong to rule out a pinpointed search on the assumption that the plane must have sunk silently.
@370Location. “….but I think it would be wrong to rule out a pinpointed search on the assumption that the plane must have sunk silently.”
If the effort, application, expertise, persistence and measured approach evident in developing your theory were to be the measure, there should be a search there.
However, please consider the obverse to your above assertion.
Is a search there warranted when there has been no reasonable observation advanced by you or others as to:
• what would cause an implosion or explosion during sinking or,
• what would explain the course and speed changes needed to get the aircraft to that spot at that time or,
• the final descent rates evident or,
• why there would have been a turn to Cocos only to fly past it or,
• the fly past of Christmas island or,
• finally, selection of an airfield further on with runway too short, when there isn’t the fuel to reach it anyway or,
• what might have been pilot motivation.
Besides, you have hypothesised a ditching without addressing why there would be no evidence of survivors, liferafts, lifejackets or ELT signals from a crash site not in an isolated ocean.
David,
Good observation.
The debris evidence, or lack of evidence, certainly does provide some limits to likely point of demise.
@David,
Thanks for your input. Those are all very good questions. Some have been raised before on Twitter as strawman arguments, where lack of a concrete answer is used to dismiss other evidence that does exist for an acoustic candidate site.
I think answers to each of those “why” questions is unknowable without more evidence that will become available when MH370 is found. We can only speculate about the functionality of the plane for landing, or motivations of the pilot. A mass murder or hero crew scenario does not change the acoustic evidence.
I can only guess at the noise source, and have discussed several possibilities. I have tried to show that it need not be an extremely loud noise to be detected, that it is anomalous between typical detection levels for hydrophones vs seismometers, and that surface impacts may not propagate to those sensors.
Speed changes can be partially due to winds along that flight path. I am not fully satisfied with my own fitting of an extra waypoint detour to accomodate the speed changes after Christmas Island. The timing/speed might also be matched by climbs and descents, but I chose low altitude flight at the time. It could be that the pilot tried to reach land after XMIS by climbing to a more efficient altitude. Variants on what happened between the possible detection at XMIS and the solid evidence for the endpoint should not exclude the candidate. I would truly appreciate it if anyone could plug the timing into their sat/flight model and come up with a better scenario.
I have seen good evidence both for both ditching and/or flutter damage on debris. I don’t think my acoustic candidate site is dependent on that, or descent rate. I have tried various methods for acoustically detecting both a horizontal and vertical impact.
One approach that I’ve been at for months is considering that the impact might affect the natural microseism patterns usually caused by ocean swells resonating with the the sound travel time between surface and seabed in the range of 0.1 to 0.25 Hz. I experimented with various methods of tuning into what might be a shift in “pelagic resonance” induced by the impact. I found remarkable evidence of shifting wave patterns detectable by dozens of regional seismometers, but no amplitude spike or frequency shift triggered by MH370. I have tried several variations of AI methods of Blind Source Separation (BSS) to isolate a seismic impact pattern.
I am still examining how quakes and surface impulses arrive at hydrophones using autocorrelation techniques, with hints of spreading shock waves, reflections off terrain, and long range surface to seabed reflections outside the SOFAR channel.
Back to your questions, I believe ELT detections are by satellite doppler shifts, so would be unaffected by the distance from shore.
As for a lack of debris evidence found near the Java coast, I thought I did address that by noting that the short term winds and long term drift patterns took debris west and SW away from the Java coast. Cocos Island might have been first landfall. I checked, and researchers surveying debris there were not watching for MH370 evidence. The debris drift would have crossed shipping lanes, but I’m told it’s rare for ships to log or report floating debris, and it would have dispersed widely within days. I’m not aware of any aerial or satellite searches of the drift area from a Java site.
I’ve tried using satellite imagery of sunglint reflections from the area on Mar 11 which might reveal debris or oil disrupting the wave texture of the sea surface. I see interesting patterns, but don’t claim it as evidence. Some notes, contrast enhancements, and a link to the NASA MODIS source images at the bottom of this page:
https://370location.org/2018/02/a-strong-anomalous-acoustic-event-on-the-seventh-arc-near-java/
As to whether my observations are “reasonable”, I can only strive for that!
To All,
So as not to be distracting with just my own candidate site and speculation, I spent yesterday examining the only two obvious acoustic signals to arrive from western directions at the Cape Leeuwin hydrophone array H01 on early Mar 8. They are both very late arrivals.
One arrives at 06:37:42 UTC on a bearing of around 238.6 from H01:
https://www.dropbox.com/s/2886pjlkn7z2qk7/200722-2253-H01%40063640-063840-Win4096-BearingOverTime-fig.pdf
That bearing goes through the northern section of early aerial searches guided by satellite images of potential debris. The most distant source would be S Africa. It has three impulses separated by about 15 and 30 seconds, which could help with triangulation matching. No match has been found on H08, but the SOFAR path to Diego Garcia may be blocked by shallow peaks of the SouthWest Indian Ridge (SWIR).
The second event is more compatible with the UGIA report. The H01 signal arrives at 09:55:53 UTC from bearing 261.2. It is also a double event but the impulses are just a few seconds apart:
https://www.dropbox.com/s/ccqiu716l65uunm/200724-0602-H01%40095543-095603-Win1024-BearingOverTime-fig.pdf
No matching H08 signal was found, but there are more blocking shallows and peaks along the NinetyEast rise and the Triple Junction. The most distant origin might be S Madagascar, but in the vicinity of the 7th Arc the latitude is from 35.65 to 35.75S. The 7th arc crossing would be around a straight tangent path from ISBIX of about 183 deg. A similar path that intersects the southern OI 70km search boundary would on 180.8 deg. A due south path crossing the 2020 UGIA candidate (and the OI Seabed Constructor bullseye track) would end some 166 km S of the 7th Arc. That’s a long glide, so not farther east.
The signal arrival seems to shift slightly between the impulses, from 261.3+ to 261.1 degrees, depending on the algorithm used. That could be a clue to the origin.
Amsterdam Island G.AIS or other seismometers may be useful for matching the signal.
@370Location
could you please draw the above mentioned signal sources on a map? It would be easier to understand for some of us non-technical people.
BTW, it is so much easier to get interested in your theories when you move away from POI’s near Cocos and Christmas Islands. Thank you.
A due south path crossing the 2020 UGIA candidate (and the OI Seabed Constructor bullseye track) would end some 166 km S of the 7th Arc.
That’s within the possible range for a controlled glide. For this hypothetical location, what would be the time of the event?
@CanisMagnusRufus,
I am posting this preliminary info here in hopes of helping the more technical folk refine their candidate locations, and perhaps get their constructive feedback.
Without triangulation from another hydrophone, seismometer, or other calculation, it will be a long search path. I have seen other maps of acoustic estimates being misused as “X marks the spot”. We are not at the point of releasing a map with these signals.
You are welcome to download a recent .kmz file from my site:
https://370location.org/?s=kmz
It can be used in Google Earth Pro, and contains the locations of the H01 and H08 seismometers, and the 7th arc. From there you can plot the bearings I’ve given.
My apologies for the distraction if you have no interest in the core of my work.
@VictorI,
The time of the arrivals is of course very late, so the origin time is only relevant for matching, but I think you are asking about what times might be expected around 7th Arc timing.
The propagation time for the UGIA due S intersect on bearing 261.2 to H01 is estimated at 1246s. That would put the signal origin at 09:35:07 UTC.
Propagation time to the 7th Arc intersect at around 92.0E would around 1355s. If the plane impacted there at 00:19:37, the H01 arrival should be at 00:42:12 UTC.
The expected H01 arrival time for the UGIA intersect would be 19:37 plus 1246s plus the time for the glide. I have seen weak signals around that time with various algorithms. If someone can estimate the 166 km glide, I’ll take a closer look with newer methods.
@370Location: For starters, assume the glide takes about 16 mins. We can refine that later.
@VictorI,
A 16 min glide after 7th arc timing would put the origin at 00:35:37 and expected H01 arrival at 00:56:23 UTC.
I’ve made a signal plot for a wide time window starting just after the loud 00:52 LANL ice event, and continuing for seven minutes after the expected arrival time:
https://www.dropbox.com/s/dagwn7u0unmd0p9/200726-0715-H01%40005220-010320-Win16384-BearingOverTime-fig.pdf
This plot uses a method that ignores signal strength by correlating just FFT phase with equalized frequency bands. It also uses a very wide sliding window (16k samples = over a minute). This smears the results in time, but reduces noise and captures more persistent weak signals.
I do see a very weak signal from approximately the same 261.2 bearing as the stronger event some 9 hours later. It can be seen at 00:59:05 on the plot, for an origin at 00:38:19 UTC.
False aliases on a single array pair tend to be more colorful in the plot, and within a few seconds of a more dominating signal.
For an origin at 00:38:19, a reflection off of the shallow crests of Broken Ridge might arrive H01 at around 01:01:25 on bearing 276-277 deg.
@370Location. You have said that the CTBTO has not classified the origin of the Java noise as an earthquake. The case that it was from MH370 could be strengthened were it demonstrably unlikely that other natural possibilities and such as fishing charges, military explosives and geological research could be the cause.
Do you have any information as to how commonly other unidentified noises with similar characteristics are encountered by hydro-acoustic sensors?
@David,
Sorry to say, but the CTBTO has been absent from supporting any MH370 research except for early PR purposes. They will not release the hydrophone data to the public, or infrasound recordings that could confirm a flyby of Cocos Island.
There are multiple agencies that analyze seismic events from the public network and catalog them. USGS and CNSS, for example, have slightly different estimates of the epicenter and depth for a somewhat rare M4.1 quake near the Java trench at 23:52:18 UTC Mar 7. That was less than half an hour before 7th Arc timing (and causing interference at XMIS flyby). A catalogued quake in that area occurs about once a week.
I have data for some 18 hours of hydrophone recordings around the expected impact time. I mentioned that only two signals came from westerly of H01. There were maybe two minor impulses that came from the direction of the first reported Curtin event around bearing 301 from H01.
Most of the impulse noise is from ice events. Seismic airgun surveys are repeating signals that come and go as the ship enters relatively shallow water that can conduct the signal into the SOFAR channel. Military explosives must be extremely rare. They would probably cluster in a short period. Illegal fishing explosives would probably be within the coastal shelf. I don’t know how those could be identified.
I investigated a huge database of pinpointed lightning strikes as a possible source of acoustic noise. It seems that even extremely loud surface events over deep water do not propagate into the SOFAR channel, and are lost in the noise. The same would hold true for any noise source near the surface over deep water.
Given the rarity of isolated impulses happening in deep water, I think the odds of a strong one occurring directly on the 7th arc must be astronomical, especially within the narrower time frame of when MH370 debris might be sinking.
CTBTO has released all hydrophone data since Dec 2014, so it might be possible to conduct such a survey. It would take a lot of data crunching.
@370Location. Thank you.
All: Network Solutions, which issues the SSL certificate for this site, was having issues with the auto-renewal of the certificate. The issue should now be resolved. If you are receiving error messages using https, try clearing the cache in your browser, close it, and try again.
Thanks Victor for the update on the Security certificate. Did not notice any issues in the past few weeks.
@370Location – Your work is really interesting from an ardent reader of this blog view point – Thanks for all your efforts and thanks to Victor for being open to provide opportunities for experts like you to share a different perspective/analysis on this blog.
Hi,
Some news about 1MDB “scandal” (if Z did it, possibly linked to “why”):
https://www.theguardian.com/world/2020/jul/28/1mdb-scandal-najib-razak-verdict-malaysia
with a link to an older but very interesting summary:
https://www.theguardian.com/world/2016/jul/28/1mdb-inside-story-worlds-biggest-financial-scandal-malaysia
Best regards,
PL
@PaxLamda
I have long felt that there was a connection between the MH370 diversion and the 1MDB scandal. The amount of money involved is truly mind boggling. I don’t know of any way to pursue that theory without a whistle blower coming forward which seems very unlikely at this point.
I don’t get the sense that Malaysia has any interest in pursuing the search for the aircraft, and would prefer to let the issue pass away quietly.
I don’t think anyone believes there is a flight safety reason to pursue the search. It is essentially dead in the water.
@ST
Much appreciated, and I share your gratitude to Victor for providing this forum.
— Ed
@DennisW said: I don’t know of any way to pursue that theory without a whistle blower coming forward which seems very unlikely at this point.
At one point, I thought there was a reasonable chance that a whistleblower would give us clues about a conspiracy to divert the plane. The closest we got were the comments from Tim Rogers, who I believe is well-intentioned, but also could have been fed disinformation. At this point, I lean towards believing the captain acted alone, and the 1MDB scandal was one in a series of events that motivated his actions.
@Victor
I have little doubt the plane was diverted for a reason. The actions of the Malaysian government in the hours after the plane went off the Beijing flight path cannot be explained except by the fact that officials in high places knew full well what was happening and why. They fully expected the aircaft to land safely. ZS could not have executed that scenario by himself from the aircraft flight deck.
Currently I’m checking some old calculations using my most recent tool. One was the combined BTO/BFO path generation with the FFB and FL optimized for best fit with the LRC speed plan. This resulted in the “Case C” which suggested an initial path straight south after 19:41 followed by a “kink” towards a TT in the 177 – 178 degrees range after an hour or so.
With the updated tool I find a similar solution, which suggests that both the final FL and final bearing settle around the same time, just after 20:41. Before 20:41 the speed would be considerably below LRC cruise.
I’m checking this suggested path with the reverse procedure (assume LRC, FL1 before ~20:50 and FL2 after ~20:50 and a change in track from 180 degrees towards 177 – 178 degrees), by looking at resulting BTORs and BFORs. A typical issue with these paths is the relative high fuel consumption as FL2 is typically between FL330 and FL340.
Therefore, I’m considering to implement “holding” as the setting before ~20:50 to see if the entire path can be made more realistic in terms of estimated fuel consumption vs. available fuel.
A basic question I have concerns the “holding” configuration: how can the aircraft / wings produce enough lift at the relative low Mach numbers listed for given weight and altitude? So what is the characteristic difference between cruise and holding “configuration”?
@Niels
If I understand, BEBIM to Arc7/NZPG heading fits the Arcs well at about 400 knots, which I tend to credit @Nederland as the first to see that active path, which basically starts out 180 South. Recently I have been ranking several “relatively straight” active paths, and the path I call “Nederlands DogLeg” did not immediately rank as well as DrB’s 181 South CMT to 31.5 South. The dogleg version I am using suffers high BTO at Arc4 in my method, but since it is active pilot, the BFO fit could be improved with changing Timing and order of maneuvers and/or maneuvers still unresolved.
I’ll let someone handle holding vs. cruise, but cruise is near-optimum miles per gallon, whereas as I believe holding is near optimum max of duration (time in the air).
@Niels asked: how can the aircraft / wings produce enough lift at the relative low Mach numbers listed for given weight and altitude?
Level flight at low speed requires a higher lift coefficient, which is achieved with a higher angle of attack. At holding speed, endurance is maximum, i.e., fuel flow is at a minimum. This occurs near (but not equal to) the point of minimum drag. As the speed is lowered, the parasitic drag is reduced, but the lift-induced drag increases, so there is a speed at which the total drag is minimized, as you can see in this figure.
@Victor
more…ICAO is known not to critize anyone in their ivestigtions which are dedicated to fault correction. This report is six sigma beyond that. I would draw your attention to paragraph n) at the bottom of page 3.
Do you really believe there was no involved diversion plan without multiple players? Would Trump insert himself into an S&R activity? Terrorist yes, S&R no way.
https://www.icao.int/APAC/Meetings/2015%20APSARTF3/WP05%20ICAO%20Brief%20on%20the%20SAR%20Response%20to%20MH370.pdf
@TBill
Indeed the paths I’m looking at typically pass close to BEBIM. I found at least one that does not have a BTO issue at arc 4 (and other arcs) and gives good BFO fit (within 3 Hz for all arcs, when assuming a 152 Hz bias). I’m currently using LRC (at two different FLs). Why would you use the ~400 knots, is that needed to “curve” towards NZPG?
With LRC I find good fits assuming CTT (great circles to be checked, as well as ECON CI52 instead of LRC). Waypoints to the south I’m looking at include DOBOK and EKUTA. DOBOK I came across recently. I’m not sure it was available at the time in the 9M-MRO database.
@VictorI
Thanks a lot. Yes, changing lift coefficient through AoA makes sense.
Some questions to better understand your explanation: are the lift and drag directions you refer to defined in a local (aircraft fixed) coordinate system?
For “holding”, wouldn’t something like the drag power be minimized, i.e. the (inner)product of drag force and velocity?
@Niels
OK I see.
Right now I like to use Heading knob and change to about 170 South at BEBIM… I see you are making a more gentle heading change, so your speed may be higher. Agree with adjusting BFO bias but I am using bias drift vs. time.
@DennisW: We’ve had this discussion many times before.
For many reasons, I don’t think you can compare the expected response of the US to the observed response of Malaysia. Hishammuddin, who at that time was the head of both of Defense and Transportation, had a heavy hand in the response to the incident. He’s a politician that had a vested interest in hiding the incompetence of both the military and the civilian aviation. I’ve talked with officials that were on the ground in Kuala Lumpur after the disappearance, and there was mass confusion and poor leadership. I lean towards a sole hijacker and an ensuing cover-up of incompetence and attempts to minimize embarrassment on the world stage. Just my opinion, of course.
@DennisW: Two more points:
1. Malaysia was also caught between the interests and desires of China and the US. China was pushing for a search in the South China Sea. The US wanted to follow the primary radar data that led towards the Indian Ocean. Pressure from the US ultimately prevailed, due to the strength of the primary radar data, and later the Inmarsat data.
2. My opinions have changed over time as we have progressively learned more information and developed additional insights. I haven’t written a book with a theory that I need to defend, and I reserve the right to change my opinion if and when more facts or evidence come to light.
@Niels asked: Some questions to better understand your explanation: are the lift and drag directions you refer to defined in a local (aircraft fixed) coordinate system?
Drag is defined as parallel to the flight path relative to the air mass, and lift is perpendicular to the flight path relative to the air mass.
To first order, fuel consumption is proportional to thrust, and people often speak of thrust specific fuel consumption (TSFC). However, for a given thrust level, the fuel consumption does increase with speed. That’s why the holding speed does not correspond exactly to the point of minimum drag. If the fuel flow were proportional to the “drag power” as you suggest, there would be no fuel consumed as the engine developed thrust with no speed. On the other hand, from an energy perspective, speed must increase fuel consumption.
@Niels and @VictorI,
I too have wondered about optimal HOLD speed. It seems that it would be the minimum velocity that allows a plane to maintain a specific altitude for its weight. The “corner” of Mach vs flutter at max altitude was a small revelation to me. Perhaps there is a similar corner where there is an optimal HOLD speed and altitude for a given weight of a particular aircraft. Given that drag is dependent on weight, is that some point near the minimum of the drag chart?
@370Location said: It seems that it would be the minimum velocity that allows a plane to maintain a specific altitude for its weight.
For straight and level flight, you are describing the stall speed, which would be a condition of high lift-induced drag and high angle of attack, and would occur at a slower speed than the point of minimum drag.
As I said previously, because the fuel flow increases as the speed increases for a given thrust level, the point of minimum fuel flow (the holding speed) occurs at a slightly slower speed than the point of minimum drag.
There is an excellent reference from Boeing that describes all these relationships in great deal for transport aircraft. If you are interested in learning more, I suggest you obtain “Jet Transport Performance Methods” by Walt Blake.
@Victor
Like most of the techies, you don’t really have an oplnion. Saying the captain acted alone begs the question – alone to do what? Commit murder and suicide? (No note) Embarrass the government? (No note) Struggling to overcome an aircraft problem?
@DennisW
Your attack on Victor’s position is inconsistent with the engineering focus of this blog. There are other blogs that consider the speculations.
That does not mean that a complete scenario might not include consideration of the actions of individuals aboard the plane. However, such actions need to be viewed with respect to the objective technical evidence.
For the first part of the flight (until the incident) we do not have much of a dispute. Between that turn and 18:22 the continued analysis of the data has at least resulted in a consensus that the plane flew a particular path.
Subsequent to 18:22 the currently available data appears to be too sparse to reach a definitive conclusion, and so some speculative cases underlie the studies discussed here.
Since we do not KNOW what actually happened, the objective is to postulate scenarios apparently consistent with the available data.
If you can conclusively state the reasons for the human actions that appear needed in this incident, please do so. Otherwise we should all be open to new interpretations of the data and further technical insights.
If I thought that a specific motivation were to be determinative, I would certainly state it.
@Sid Bennett
I do not regard my post as an attack on Victor’s “position”.
@Neils, 370 Location, Victor. Re drag, power vs speed and weight in 1g level flight, this might help:
https://www.theairlinepilots.com/forum/viewtopic.php?t=369#:~:text=There%20is%20an%20EAS%20for,endurance)%20in%20a%20jet%20aircraft.
Jet Transport Performance Methods D6-1420
Author: Walt Blake
Publisher: Boeing
Language: English
Pages: 742
File: PDF, 9.41 MB
https://b-ok.global/book/3703593/d39eb0?regionChanged=&redirect=756505
@DennisW. About the relevance of the “ICAO” report. What you refer to was a regional secretarial paper that joined others working papers, including from Malaysia and Australia.
I do not think that what you quote is evidence of political malfeasance or conspiracy. The problem was that the Malaysian SAR body was not properly set up, was undermanned and consequently was not seen by the Government as either authoritative or competent to manage a search on this scale, or its ramifications.
Take a look at the presentation by a regional ICAO officer on 19th July 2016 below. Quote, “all Malaysian SAR personnel were also air traffic controllers, and many SAR trained officers were assigned non-operational tasks, such as briefing the next of kin)”, “inadequate RCC facilities at Kuala Lumpur”, need for, “the establishment of a legal framework to support the roles and responsibilities of SAR experts to handle various SAR missions” and, “providing authority and empowerment to SAR agencies and therefore SAR Mission Coordinators is necessary to effectively coordinate SAR responses through State legislative Acts.”
https://www.icao.int/ESAF/Documents/meetings/2016/Regional%20%20and%20Inter-Regional%20Seminar%20and%20Wkshp%20on%20SAR%2019-22%20July%202016/English/Asia%20Pacific%20SAR%20Plan%202016.pdf#search=mh370
The intervention by others, including politicians, can be explained by a mix of this “insertion” (as you put it) of themselves in SAR activities, their normal involvement in providing search resources including internationally, interdepartmental organisation (allocating responsibilities/decision making) and the evident need for copious international press briefings.
An earlier (January 2015) Malaysian paper, presented at the same meeting as was the regional secretariat’s you refer to, had related how sparse trained SAR personnel of the Malaysian RCC were elsewhere at 2.25c. and d. and indicated at its para 2.29 that there is no proper framework or recognition of the part the SAR personnel should play.
https://www.icao.int/APAC/Meetings/2015%20APSARTF3/WP06%20MH370%20SAR%20Operations%20and%20Lessons%20Learnt%20(Malaysia).pdf#search=mh370
The outcome of the meeting at which the secretariat’s and Malaysia’s papers were presented (and one from Australia) is here:
https://www.icao.int/APAC/Meetings/2015%20APSARTF3/FINAL%20REPORT%20APSARTF3.pdf#search=mh370
The ICAO response was a plan for correcting the deficiencies disclosed, including specifying how SAR organisations should be set up:
https://www.icao.int/APAC/Documents/edocs/Asia%20Pacific%20SAR%20Plan%20V2.0.pdf
This appears to be drawn from a draft prepared by the regional office and to be the basis for the regional officer’s presentation above.
For those interested in other ICAO papers about MH370, there was a paper presented by Australia to an August 2014 regional meeting and from which the report mentioned above for the January 2015 meeting was drawn. Next I will post the URL for the 2015 version: hopefully the separation will save this post from getting jammed. It enlarges on the earlier paper mainly at paras 2.30-2.32. (A further Australian paper was taken at an ICAO meeting in Beijing in September, 2014.)
I will post also a broader working paper presented by Malaysia in February, 2015 to an ICAO meeting in Montreal; and another by Australia to the same. Finally, there is the record of a high level ICAO speech of March 2015 on the general topic.
Not that this list is exhaustive.
See the above:
https://www.icao.int/APAC/Meetings/2015%20APSARTF3/WP14%20MH370%20SAR%20Response%20JRCC%20(Australia).pdf#search=mh370
https://www.icao.int/Meetings/HLSC2015/Documents/WP/wp084_en.pdf#search=mh370
https://www.icao.int/Meetings/HLSC2015/Documents/IP/ip019_en.pdf
https://www.icao.int/Documents/secretary-general/rbenjamin/20150319_ASEAN-Aviation-Summit.pdf#search=mh370
The first above baulks.
Second try works before posting. Again:
https://www.icao.int/APAC/Meetings/2015%20APSARTF3/WP14%20MH370%20SAR%20Response%20JRCC%20(Australia).pdf#search=mh370
Still no go!
But copying and pasting the whole does it.
@David
Thorough collection David, thx. At the end of the day it will always be difficult to separate incompetence from misdirection. For sure there was plenty of the former.
I think we can agree that the delay in the aerial search in the Pacific was unfortunate, and perhaps the single biggest reason that most of the debris dispersed and escaped detection.
@DennisW
The new gov’t/PM in MY might be more receptive to new search compared to Mahathir, but a long time has passed. I have not heard any inklings of the new PM’s MH370 search policy leanings.
@Bill
I am not hopeful.
@David: I don’t believe the airlinepilots reference is correct when it states that maximum fuel endurance occurs at the minimum drag speed. That would be true if the fuel flow depended only on thrust and not on speed. Because for a given fuel flow, thrust decreases with speed, the lowest fuel flow occurs at a speed lower than the minimum drag speed.
This can be clearly seen in figures 32-21 and 32-22 found in the Boeing reference for which @ventus45 kindly supplied a download link.
@VictorI, MH370Location, David, ventus45
Thank you for feedback and sharing info regarding my question on “holding” vs. cruise settings. Understanding the combination of aircraft aerodynamics and engine characteristics on a detailed level will need quite some study.
Usually, I’m studying systems around a million times smaller in size. To give an example regarding engines, I have been looking at “energetics” of electrostatic micromotors quite a lot. Rotor dimensions are around 100 micrometers or even below.
@Victor. “Because for a given fuel flow, thrust decreases with speed, the lowest fuel flow occurs at a speed lower than the minimum drag speed.”
I agree that equating minimum drag speed with minimum fuel flow is an approximation; and for the high by-pass turbofan at high altitude, a loose one.
However the Boeing book at 14.4 under “velocity effect on thrust” discusses two opposing influences. Qualitatively you will see that the slope of thrust versus speed can be either way, depending on which of the velocity and ram effects prevail. I suggest which does might vary with air density, ie be altitude related.
But in the general case it is likely also that there could be another major influence, though I have not done the sums. Propulsive efficiency (see 13.7) is greatly influenced by by-pass ratio and so the crossover of slope for a turbojet (at one extreme) will be different from the high by-pass turbofan.
His Figure 32.22 example, at FL 350, is where minimum drag (and stall speed) are approaching cruise speed. Accepting that figure is right qualitatively at high altitude and for a high by-pass turbo fan, that but does not mean to me that minimum fuel consumption speed will always be less than that of minimum drag, for example in a hold at low altitude with lower by-pass engines.
Not helping much, his graph there has a couple of weaknesses. Firstly it overstates the mass of the aircraft by 20,000 lb – see the contrary description alongside. Figure 32-1c shows the description to be correct, not the graph.
Secondly the ordinate is described as “total thrust”. This is undefined and is unmentioned in the index. What is that? Does it include that to overcome nacelle drag? Presumably it does not include any intake drag or thrust lost to ancillaries and bleed, both mentioned elsewhere?
That aside, the book is of great value, so thank you, @Ventus45, Walt Blake and Boeing, plus engine contributors, for that. For example at 14.5 it notes how cruise performance is based on the average engine, while take-off performance relates to the minimum engine standards at release. Then at 14.7 there are the comments on fuel heating value variation with volume and density (with the dependence of that on temperature mentioned at 13.7).
Yet in that graph and elsewhere use of the word thrust is imprecise. The index says it is defined at 13.1 though that consists of just a general description. At the two dot points at 14.4 “thrust” and “net thrust” are used as if synonomous. “Installed net thrust” is defined at 14.5 and 14.15 defines “generalised” thrust but again these do not help with the “total thrust” meaning.
Even so, in summary, as I read it minimum fuel flow air speed is indeed substantially less than minimum drag speed at FL350 though that may not be the case at low altitude and is not necessarily that for all jet aircraft even at high altitude.
@Niels. Not too sure that Reynolds numbers are relevant there, or Navier-Stokes.
@Victor. My para 6 second sentence includes, “Firstly it overstates the mass of the aircraft by 20,000 lb…..”, but ‘overstates’ there should read ‘understates’.
@David said: I suggest which does might vary with air density, ie be altitude related.
The ram effect is due to the increase in density at the inlet to the engine due its moving through air. The fractional increase in density should solely be a function of Mach number. Since for a given IAS, the Mach number is higher at higher altitudes, for a given IAS, the ram effect should also be more important at higher altitudes.
@VictorI, @Niels,@David, @ventus45,
The Blake book and other links are a fascinating read. Much appreciated.
The discussion has left me wondering if there might be a practical way to get optimal hold speed. Since it’s going to be for a specific altitude, it would seem that a pilot or FMC might start at a safe estimated hold speed and then reduce throttle until altitude cannot be held with pitch adjustments. Or pick a lower throttle and increase when pitch won’t do. Dynamically, it would be adjusting pitch with minimum throttle to hold altitude as weight and conditions change. I don’t think that would risk a stall if done slowly.
I think the lowest safe altitude (which might exclude ground effect) would also optimize hold if a plane needed to fully maximize endurance over open ocean.
A question prompted by the Annex 13 discussion relates to jurisdiction.
Australia took on responsibility during the early phases because they were the base for the searches, but we are clearly beyond that.
My candidate site is some 36 Nm from the Java coast. That’s outside territorial (12) and conditional (24 Nm) waters but inside the exclusive economic zone (200 Nm), so not on the high seas. A Java port would be the obvious base for searches there.
What responsibility might Indonesia take (or disavow) beyond negotiating permissions for a search within their zone?
@370Location: The best holding speed is available via a screen in the FMS. Maintaining that speed would be easily accomplished with the autopilot and autothrottle engaged. I don’t see a reason to fly below holding speed. For a B777-200ER at around 200 MT, the fuel flow is minimized at holding speed at around 20-25,000 ft. The fuel flow and holding speed are tabulated versus altitude and weight in the FCOM.
@David: Previously, I said: Because for a given fuel flow, thrust decreases with speed, the lowest fuel flow occurs at a speed lower than the minimum drag speed.
You noted: However the Boeing book at 14.4 under “velocity effect on thrust” discusses two opposing influences. Qualitatively you will see that the slope of thrust versus speed can be either way, depending on which of the velocity and ram effects prevail.
There is an important distinction between those statements. Yes, the ram effect increases the thrust, but as the air flowrate increases, so the does the fuel flow. For a given fuel flow, the thrust should decrease with speed, and the holding speed should be less than the minimum drag speed.
@Victor said: “For a B777-200ER at around 200 MT”
@David
@Victor
Victor is correct; in theory the speed for maximum endurance (ie minimum fuel consumption) is slightly less than the speed for minimum drag, as outlined in Boeing’s ‘Jet Transport Performance Methods’. The ram effect is Mach dependent and the reversal or ‘combined effect’ shown in Figure 14-3 of the Boeing reference occurs at high Mach numbers, well above the maximum speed of typical airline aircraft. In any case, the increased mass flow caused by the ram effect increases fuel flow, as Victor also mentioned. The figures in the following link show the relationship between thrust and SFC at various altitudes and speeds for small and large turbofans (Roskam & Lan, Airplane Aerodynamics and Performance): Thrust vs SFC
However, as with most things aeronautical, the derivation of the recommended holding speeds is not quite so simple in practice. In Boeing aircraft, the recommended holding speed schedule is the higher of the maximum endurance speed and the manoeuvring speed for the selected flap setting. Mach effects start to reduce the aircraft’s manoeuvre capability above 20,000 ft. Consequently, the holding speed is increased above 20,000 ft to ensure that a 1.3g manoeuvre capability to low speed buffet is maintained. The FCOM tables show that the holding speeds at 20,000 ft and below are limited by the flaps up manoeuvring speed at weights below about 250,000 kg, while those above are limited by the 1.3g manoeuvre capability. In other words, the recommended holding speeds are higher than the theoretical speeds for minimum fuel flow.
@David
@Victor
The second last sentence of my previous post should read: “…while those above 20,000 ft are limited by the 1.3g manoeuvre capability.”
@Andrew: Thank you for reminding us that the holding speed may be greater than the speed that maximizes endurance due to margin requirements.
Estate of Philip Wood is filing lawsuit in the Supreme Court of USA.
Disagreeing with lower court decision about forum non conveniens.
https://www.reuters.com/article/legal-us-otc-forum/flight-mh370-plaintiff-wants-scotus-to-review-forum-doctrine-claiming-disarray-below-idUSKCN24Z2HI
@Victor, Andrew. One of my two speculations was that the slope of thrust vs speed might alter with altitude and might reverse at low level. Victor, you have argued in principle that that would not be the case and Andrew has confirmed your view that the ram effect will increase fuel flow.
What demonstrates what you both say is Andrew’s second graph. That provides the data from which the slope of the thrust-to-Mach relationship at sea level and to low speeds can be extracted, in the manner of the Boeing Figure 32-21. I have compared that slope with that at high altitude, which also can be derived from Andrew’s second graph.
The sea level outcome has the (much) greater slope and is in the same direction. In other words with decreasing altitude, for a turbofan at least, the gap between minimum drag speed and minimum fuel flow increases markedly, not decreases or reverses, more than confirming what you both have said.
My second speculation was that the much lower propulsive efficiency of a turbojet might make it different. I have been unable to establish that either way from a book I have on the subject from pre-fan times – not because the subject isn’t covered but because I do not understand it. I will post these turbojet pages should you be curious.
In the MH370 context that issue is of course academic though it might bear on the genesis of the post by K Haroon that I posted earlier and which underlies this discussion. He refers just to “jet aircraft”.
Also academic there remain a couple of other loose ends, to me anyway. Andrew you say, “The ram effect is Mach dependent and the reversal or ‘combined effect’ shown in Figure 14-3 of the Boeing reference occurs at high Mach numbers”. Yet Boeing’s Figure 14-3 illustrates it at take-off. Possibly that has something to do with the thrust levers being set and the resulting fuel flow. The Boeing book at page 14-9 says that EPR is the “primary thrust setting parameter for …..Rolls Royce engines”.
The other loose end is the labelling of Figures 32-21 & 22 ordinates as ‘total thrust’ where “thrust” or “net thrust” – used elsewhere – would do. “Total thrust” is akin to “gross thrust” and well could be construed as that of the exhaust/fan stream, so not including intake drag. That would alter the graphs’ character and this does look to be a mislabelling.
But maybe that is enough on this.
@David
RE: ‘In the MH370 context that issue is of course academic though it might bear on the genesis of the post by K Haroon that I posted earlier and which underlies this discussion. He refers just to “jet aircraft”.’
Most basic aircraft performance textbooks equate maximum endurance with minimum drag. It’s a starting point for determining the theoretical speed for maximum endurance, but it doesn’t go far enough because the TSFC also varies with speed, as discussed. In any case, there are other factors such as buffet margin that affect the recommended holding speeds, as also discussed.
RE: ‘Also academic there remain a couple of other loose ends, to me anyway. Andrew you say, “The ram effect is Mach dependent and the reversal or ‘combined effect’ shown in Figure 14-3 of the Boeing reference occurs at high Mach numbers”. Yet Boeing’s Figure 14-3 illustrates it at take-off.’
Ram effect starts to occur as soon as the speed begins to increase, but the effect is very small at low Mach numbers and becomes increasingly significant as the aircraft accelerates. By ‘reversal’ I meant that part of the ‘combined effect’ graph where the ram effect is sufficient to overcome the velocity effect, resulting in a thrust increase with a further increase in speed.
RE: ‘The other loose end is the labelling of Figures 32-21 & 22 ordinates as ‘total thrust’ where “thrust” or “net thrust” – used elsewhere – would do.’
I suspect ‘total thrust’ simply means the total net thrust produced by the aircraft’s engines, because the green curves are ‘thrust required’ (ie drag). The fuel flow graphs, however, show fuel flow per engine.
@Andrew. Thanks for those thoughts.
@Andrew, @David: Another advantage of operating at a higher speed than the minimum drag speed is the improved controllability of speed. If operating at a speed less than the minimum drag speed, and the autopilot is holding altitude, a disturbance which causes the speed to drop has to be counteracted by an increase in thrust due to the increase in drag. If the thrust response is not sufficiently fast and strong, there will be a speed excursion (deceleration), and the likely outcome to recover will be a descent.
@Andrew, @David: I seem to remember Andrew remarking at some point that B777 pilots that have flown at high altitudes and “behind the drag curve” had to descend to regain control.
@CanisMR: It’s hard to know what the legal strategy is for pursuing this in US courts. Based on what we know today, a suit against Boeing would be very difficult to win on the merits of the case. It’s also possible that more facts could surface, or that a jury might feel differently, or the real goal is to settle out of court. The negative publicity Boeing received from the B737 Max accidents might have re-energized the MH370 case.
@Victor
@David
RE: ‘I seem to remember Andrew remarking at some point that B777 pilots that have flown at high altitudes and “behind the drag curve” had to descend to regain control.’
Yes, older versions of the aircraft are thrust limited at high altitude and the speed band between MMS and MMO is relatively small. I’m aware of several incidents where pilots have had to descend when the speed reduced during turbulence and there was insufficient thrust to accelerate in level flight. Our recommendation was to ensure the aircraft did not go below the recommended holding speed when operating above optimum altitude.
@All,
After 2 months of not posting, I thought I would take a small break from the MH370 Drift Analysis to say how much I appreciate all the contributions here and read them all, even if I do not always respond.
@DennisW: For the record I agree with Victor, that ZS appears to have acted alone. In my view, ZS was motivated by a deep dissatisfaction with the corruption in Malaysia. ZS was clearly against the then government and wanted to bring it down. He was actively working with the opposition movement, but frustrated by the lack of progress in achieving a change in government. At the same time, ZS was unhappy in his marriage and showing signs of depression. ZS was the soldier, who fought his battle silently.
Now back to the Drift Analysis, which gets more and more interesting as time goes on and we dig deeper into the data, kindly supported by David Griffin.
@Richard,
I am glad to hear from you and to know that the work goes on. Keep safe and keep drifting….
@Richard
Glad to hear you are still engaged. 😀
@Victor. I had not seen the site below, hosted in Australia by ‘Grant’ and kept amended.
Among other things, at “Captain Zaharie Shah” – “Hostile takeover or suicide mission?” it offers a rationale for the Malaysian investigation’s position that intervention by a third party by no means can be ruled out, murder-suicide by the captain being a lot less likely.
The scenario envisaged is that the Mk25 simulator disk was nobbled, expertly and simply.
https://www.mh370wiki.net/wiki/Main_Page
Did I miss discussion of this?
@David: I was not aware of the site. I skimmed some of it, and didn’t find it particularly useful. To save some time, which statements do you believe are correct and helpful?
@David
Thank you.
The aim of the website: “created to collate information”.
The gathered data/references seems pretty comprehensive, and an ongoing project.
@ventus45
A delayed thank you for your link of July 31, 2020 at 8:10 pm to Walt Blake’s Boeing Jet Transport Performance Methods document.
As mentioned before I have been working on paths with a kink, inspired on the best fit path which I found using both interpolated BTO and BFO curves (“Case C”). I now managed to implement Holding Mach and FF before the kink and LRC Mach and FF after the kink. I can get a good fit with the BTO and BFO data if I choose the holding and LRC flight level the same, at FL340. The track before the kink is 180 deg and after the kink I now have 177.7 deg. The timing of the kink can be chosen / varied and in this example I put it at 20:51. This path passes very close to ISBIX (at around 19:56) and close to BEBIM (at around 21:24). The required fuel at 19:41 results in an estimated total weight of 201.55 tonnes. The estimated 00:19 latitude is around S33.5 deg, at 19:41 it would be around N2.2 deg.
Next, I will take a closer look at a suitable pre-19:41 path, including the possibility of a long holding setting near typical cruise FL (assuming an early turn south and hardly any descent).
Also, I will explore the consequences of variation in the timing of the kink / change in speed setting. For example, putting it after 20:41 as I’ve done now results in a rather large BFO error at 20:41 (though well within 7 Hz limit).
@Victor. The site’s references, time-lines, background and explanations, with its broad collection of information and sources will be useful to some I think, particularly those late to the scene.
I for one was unaware of the extent of the early Chinese public and diplomatic reaction to the handling of the accident described in the media articles he references. Similarly as to sources of material I had not thought of the National Library of Australia, for example, as being one (or if I did I have forgotten).
Novel to me also is the mention of an ACARS upload of MH371’s flight plan to MH370. He says that one possible purpose of that apparently was to show the way home. However, being subsequent to MH370’s scheduled arrival in Beijing that upload might have been intended for its next flight?
As to the RMP’s forensic investigation I was unaware also of the outside expertise utilised in that. He quotes, ‘On 19 March 2014 the New Straits Times quoted the Home Minister, Datuk Seri Ahmad Zahid Hamidi:- “The police had invited several Boeing 777 operators and also those who were experts in flight simulators, as well as Information Technology (IT) professionals to assist in the probe,” he told a press conference, near here, this afternoon.’
Besides, I think the discussion about that investigation and some of the terminology is useful to many. An example:
https://www.mh370wiki.net/wiki/Volume_Shadow_Information_(VSI)_file
But in seeking what are “useful and correct” statements from the site, I think you mean information directly useful to finding the wreckage.
The main opinion he offers is as to the likelihood I mentioned of third party involvement in the cause of the crash. Your BRVA analysis depends on the packs being off in the leg due south, implying a murder/suicide.
Hypotheses such as those of @DennisW and @370Location can be aligned more easily with late manoeuvring. To that extent Grant’s opinion can be germane and, if correct, useful.
I believe that a key support to that analysis is whether the psychologist’s opinion that @Richard Godfrey has quoted (as later have I) is sound.
Grant’s hypothesis in turn depends on whether the surreptitious alteration to the captain’s Mk 25 disk is feasible. But even assuming Grant has the computing skills to sustain the scenario he does, there remains a weakness in it. How would an intruder aiming to make that alteration have any idea in advance that there was a suitable entry in that drive to alter?
Even if Grant meant those specifics to be a “for instance” I find it difficult to see how the SIO points would come to be there – and as of that early date – by forgery.
All the same, I do think that what he puts in the following quote does reduce the relevance of those southern points to the pre-planned suicide hypothesis.
About that he says, “There are two parts to this question:-
• If Zaharie was not suicidal why would he use his flight simulator to plot two points so far south?, and
• If Zaharie was suicidal why would he bother?’
As to Anwar Ibrahim’s jailing being a contributor, he poses, “Would Zaharie have planned a suicide flight in anticipation of a sequence of events that had not occurred?”. Again that is a reasonable question I think.
Even so my opinion is that the captain’s suicide/murder remains the more likely cause, that being based on your BRVA route likelihood, its dependence on the packs being off in the leg south (thereby inducing extreme cold so being consistent with earlier suicide) and the criminal psychologist’s opinion.
(Note that while also it is consistent with the final descent, lack of an ELT signal from a liferaft and the 18:25 log-on, these need not be inconsistent with the third-party hypothesis.)
I hope others will add comment.
@George G. I agree.
@David said: But in seeking what are “useful and correct” statements from the site, I think you mean information directly useful to finding the wreckage.
I meant additional information that helps us to understand any aspect of this disappearance. His simulator analysis, for instance, has errors, which is why I asked which information do you believe is useful.
You asked If Zaharie was suicidal why would he bother?
I don’t think we have a good answer to this. FSX would not be the best tool for planning the diversion to the SIO. That said, it could have been used for creating the flight path and practicing the diversion.
As I’ve said before, if Zaharie did not participate in the diversion, the fragments of the recovered flight files, proven to be related to the same simulated flight, and showing a path up the Malacca Strait and ending with fuel exhaustion in the SIO, would be an extraordinary coincidence. Or, the evidence was fabricated and Zaharie was framed, which I believe is unlikely.
@Victor. Understood thank you. “….the fragments of the recovered flight files, proven to be related to the same simulated flight….” Therein lies the difference. I think his assessment may be out of date.
@CanisMagnusRufus
That is interesting about the Philip Wood estate legal attempts. The article you cite is seemingly silent on why the Malaysian court case did not progress, which was originally planned to take place June_2019. The flaw in the US court case seems to be the assumption of mechanical failure, which just about nobody believes. However, in the case of the apparent Silk Air pilot suicide, the U.S. courts/jury did find the jack-screw manufacturer partially liable, I believe even though the jack-screw was somehow miraculously recovered, and seemed to be in good shape.
TBill wrote “in the case of the apparent Silk Air pilot suicide, the U.S. courts/jury did find the jack-screw manufacturer partially liable”
The case heard in the California state court exploited the previous issues with the 737’s rudder PCU, not the horizontal stabilizer jack screw, to successfully argue with expert opinion that ‘metallurgical anomalies’ observed within the Silk Air rudder PCU were causal.
The NTSB and NTSC accident investigation reports were not permitted as evidence in the case.
CanisMagnusRufus,
The action filed by estate of Philip Wood with the US Supremem Court is technically a petition, asking that the dismissal of its lawsuit against Boeing previously granted by the D.C. district court be reversed. You can find the petition, along with the previous rulings, here:
https://www.supremecourt.gov/search.aspx?filename=/docket/docketfiles/html/public/20-98.html
I have not read the petition in depth yet. The Supreme Court is under to obligation to grant it (which, even if granted, would only lead the court to review the case and hold a hearing, not necessarily actually grant the reversal.)
@ All – Philipines govt update on debris found in East Samar beach in Philipines can be found in below link. It has not been defined as aircraft debris nor source confirmed.
https://www.pna.gov.ph/articles/1111677
https://mb.com.ph/2020/08/09/mysterious-pieces-of-debris-recovered-in-eastern-samar/
@ST. Looks like ex-rocket, east Asian. Found on two beaches.
https://cebudailynews.inquirer.net/331812/in-photos-aircraft-debris-found-in-eastern-samar-town
http://isumat.com/mga-parte-hin-eroplano-nakit-an-gihapon-ha-guiuan-e-samar/
@David
That looks like Chinese characters marked on the interior of one of the pieces.
If I had to take a punt I’d say that we’re looking at the payload fairing for the Tianwen-1 Mars rover from the recent Long March-5 launch out of the Wenchang Space Launch Center in south China’s Hainan Province.
@David – Thanks for the links.
USAF spy plane, flying over S.China Sea, caught shadowing commercial aircraft, mistakenly identified as commercial by Chinese military.
https://www.scmp.com/news/china/military/article/3096857/us-spy-planes-south-china-sea-creating-risk-civilian-aircraft
Some quotes:
Cases of mistaken identity have led to passenger planes being shot down in the past…
US military has several types of reconnaissance aircraft developed on commercial aeroplane platforms, and they usually follow civil aviation flights as cover when approaching China’s airspace,…
US has reportedly stepped up its reconnaissance activities near the southern Chinese coast in recent weeks, with a night operation by an E-8C plane on August 5 prompting Chinese Defence Minister Wei Fenghe to initiate a 90-minute phone call with his American counterpart Mark Esper…
Using civil aircraft as cover is a common operation for the Americans and their close ally Israel. But the South China Sea is one of the world’s busiest international airspaces, which may put civil aircraft at risk…
The night operation conducted by US aircraft in the South China Sea aimed at spying on the PLA’s recent weapon and troop deployments, because military mobilisations are usually arranged for the night….
After reading VI’s post about MH370’s ‘turn’ at IGARI towards the next waypoint, and noting that the transponder switched off at exactly the same time, I became convinced that ZS was rendezvousing with a military aircraft doing surveillance over the S. China Sea.
After reading the article above, any remaining doubts have been erased.
@Mick Gilbert. Yes, something of an aside but from the below, third photo down, half the nose cone on one beach and part of casing under that separated with it (from a film of the launch, that was at 2:56 after launch).
https://www.space.com/china-mars-mission-tianwen-1-details.html
Should read, “…that separated with it, on the other…”
@CanisMR: For the sake of discussion, let’s assume MH370 was used as cover for a military flight over the South China Sea. Why the turnback to Malaysia and the subsequent legs up the Malacca Strait and to the SIO?
@VictorI
I believe that ZS had every intention of completing the original flight plan from KL to Beijing. However, he was also complicit in aiding the surveillance on the PLA force movements by USA/Australia/UK or Malaysia. He intention was to turn off the transponder for the segment of the flight over S.China sea till he reached Sanya FIR.
Turning off the transponder & ACARS would leave the aircraft vulnerable, and so to ensure protection of the cockpit, In-Flight Security Officers (IFSO’s) were hired.
These IFSO’s then turned the tables on the pilots by taking over the aircraft under the pretence of a security threat, which required the aircraft to turn back, and after disabling everyone through cabin decompression, hijacked the aircraft and made it disappear over the SIO.
The IFSO’s were operating under the orders of both Russia, and probably China.
@CanisMagnusRufus
On the one hand, we must admit that there could possibly be a more complex conspiracy than we are aware of.
But the flight path seems like it probably had ZS name all over it. For example, consider Victor’s prior article on the flight path around Penang, which another pro-ZS pilot pointed out seems to be textbook approach. So that pilot’s theory was ZS was under duress flying with gun to his head.
https://mh370.radiantphysics.com/2019/01/12/mh370-flight-around-penang/
We cannot rule that out, but the flight path looks a whole lot more like a cunning, expert pilot planned getaway flight.
I would also cite industry consultant George Bibel who was discussed here, and he said industry informally assumes MH370 was a “criminal act”. To me criminal act means home-grown Malaysian plot, either by pilot alone or with others. Evidence for international conspiracy or hijacking by non-Malaysian outsiders is essentially non-existent, has to be considered less likely speculation. Which is OK to pursue speculation, but I like to first say the most likely cause is pilot diversion, with or without assistance from others, probably Malaysians if others.
PS- I note the lack of windows on the US spy plane ( I am agreeing we do not know what was going on in the airways (eg by Kate Tee). We only know the commercial air traffic. That could explain some of the many eye witness reports of other aircraft. But I assume NTSB et al on the joint team knew more than we do, and I am satisfied PM Razak was pressured by them say what really happened as best the data shows (deliberate diversion). I am not thinking the NTSB was involved in a clandestine cover-up.
@CanisMR: I think you are saying that the IFSOs quickly commandeered the plane after passing IGARI and then either forced the pilots to fly the route terminating in the SIO, or were able to expertly aviate and navigate on their own. Neither scenario seems likely. Not to mention the extraordinary coincidence of the simulator data, which on its face, implies pre-planning by the captain.
@VictorI
there is a difference between being suicidal, and taking suicidal risks.
Clearly, if it’s true that ZS turned off the transponder & ACARS to aid in surveillance operations, thus exposing his aircraft to danger, he is taking suicidal risks with the safety of himself and passengers.
But it is a calculated risk, taken by an experienced pilot, flying a familiar route. He would probably never have taken into consideration the so-called ‘insider’ threat posed by IFSO’s hired to protect him.
In an interview with Canadian media, an RCMP Sky Marshal said that the main role of an IFSO was to ‘retake control’ of the hijacked aircraft. It’s the reason why IFSO’s rarely get involved in subduing unruly passengers, because it’s not a priority for them.
How could IFSO’s retake control of the aircraft if they didn’t possess rudimentary knowledge of aviating and navigating?
@CanisMR: It would take many hours of specialized training and require a particular aptitude for IFSOs to have the expertise to navigate and aviate an airliner, especially in the way that we believe MH370 was configured, reconfigured, and flown. Your hypothesis also does not explain the simulator data.
In any event, you say you have no doubts that your theory is correct, so now that you have explained it, I won’t try to persuade you otherwise. Thank you for sharing.
@CanisMagnusRufus
You stated “ But it is a calculated risk, taken by an experienced pilot, flying a familiar route.“
Can you please explain, how a route into the Southern Indian Ocean to the 7th Arc is a “familiar route”?
@Richard
I believe ZS was intending to fly his aircraft as per flightplan from KL to Beijing (this is the famliar route I referenced), but upon reaching IGARI he turned off his transponder & ACARS. He would be rendezvousing with an ISR aircraft from allied militaries (US/Australia/Singapore/Malaysia etc) that would then spoof MH370’s transponder and overfly S.China Sea, conducting surveillance on PLA ops. ZS would then turn the transponder back on as he approached Sanya FIR, while the ISR aircraft that was shadowing MH370 would break off from formation and continue on its own path.
What evidence do I have for this?
1. HH’s interviewwith Jonah Fisher of BBC, when asked about the cost of the S&R operations (at 3:13), without discussing $, starts talking about Ukraine, Middle East, and ‘cost of patrolling these rocks in the S.China sea’.
2. VI’s blogpost titled ‘Insights from New MH370 Tracking Data’
3. the SCMP article cited above about ISR aircraft passing as commercial aircraft
4. The insistence of the Chinese on searching the SCS in the first week of incident, and bringing PLAAN ships to complete the search in the area
5. ZS self-perception as a ‘soldier toiling in obscurity’ as evidenced by the poem he quoted.
6. Christine Negroni reported that MAS was having difficulties with plane following in S.China sea, and reported it to HH in 2013
7. French NOK Ghyslain W was investigating SITA’s records of previous flights this aircraft in the region.
8. Ongoing tension between China and other countries in the SCS, China ramping up island building activity in the SCS in the aftermath of MH370, and militarizing these outposts
@VictorI
We shouldn’t confuse the job title with the credentials/qualifications.
I would expect an Aviation Analyst on CNN to have a professional background in the same field, and would be somewhat surprised if I found out he had a Nuclear Engineering degree.
The typical IFSO is ex-military with good marksmanship skills. However, special occasions call for special IFSO’s with special skills. MAS doesn’t know the background of the IFSO’s they hire, they simply trust the service provider to hire the right people for the right job.
If certain IFSO’s were expertly trained in aviating and navigating the world’s most popular widebody aircraft type, it should not be a surprise. If these IFSO’s also happen to have trained extensively to protect the Sochi Olympics which took place in Feb 2014, and the Special Olympics in Mar 2014, that should also not come as a surprise.
@Authors (Bobby, Richard, Victor, Andrew)
I’m working on an scenario based on FL340 after 19:41 (Holding till after 20:41, followed by LRC). In the light of this I would like to ask what would be approx. the difference in available fuel at 19:41 if the proposed descent was to a more fuel efficient FL (200?) instead of FL100. Can I calculate the difference from the Holding FF table?
Here’s a good video that summarizes the findings of the NTSB regarding the Atlas Air 3591 crash.
https://www.youtube.com/watch?v=uEWXYizNKf0
Thanks Victor – sobering stuff and some very interesting points.
@Niels,
A descent and traverse at FL200 instead of FL100 would save fuel. You need to calculate the fuel consumption difference during three periods. First, the descent would end several minutes sooner, so during this period the fuel flow would be Holding at FL200 instead of idle. That costs extra fuel, but more is saved subsequently. Second, during the traverse, the fuel flow would be Holding at FL200 instead of Holding at FL100. You can look that up in a Boeing table. Third, the climb would start later, so a considerable fuel savings would occur during the third period, when the fuel flow would be Holding at FL200 instead of the much higher maximum continuous thrust fuel flow between FL100 and FL200. It’s been a while since I looked at this, but I recall limiting the descent to FL200 was inconsistent with MEFE at
004:17:30. I believe the descent was to FL100 because that is more consistent with evading radar, with MEFE time, and with Kate Tee’s observations.
@DrB,
“and with Kate Tee’s observations”
Which version of Ms Tee’s observations? Her original posts described the Aaza Dana sailing northwards during her observation over the stern.
A much later post describes how the aircraft was also seen by Guy Nazarin, an additional crewmember on the yacht during the voyage to Phuket. Ms Tee’s description of Mr Nazarin portrays him as someone with credible, even professional, knowledge of aviation.
The contents of the linked blog post are, again, contradictory: Mr Nazarin did see the aircraft, “I plainly asked him why it was glowing like that. His response was that he didn’t know, he had never seen anything like it before.“; Mr Nazarin didn’t see the aircraft, “told us that although he didn’t recall seeing the plane himself, he did recall me talking about a strange military plane (he was specific about that)“.
In common with the reports originating Kudahuvadhoo, it is reasonable to conclude that an aircraft was sighted (I am confident that the Kudahuvadhoo sighting is resolved). However, unlike Kudahuvadhoo where many individuals contributed with a credible record of date and time, the alleged Aaza Dana sighting involves many contradictions. The voyage record from Aaza Dana’s GPS tracker describes the yacht’s path through the “Six Degree Channel” and across the Andaman Sea. Prior to 1915UTC 2014-03-07 the Aaza Dana was sailing on a northward course, parallel to the estimated track of 9M-MRO up to that time.
If 9M-MRO was making a southbound track and Aaza Dana a northward track there is a striking contradiction in sighting an aircraft crossing over the stern of the yacht.
Concerning radar and any consideration about the TNI-AU long range air defence network. The air defence network concerns protection of national territory and enforcement of an Air Defence Identification Zone, less so the FIR boundaries. No Indonesian ADIZ existed over northern Sumatra in 2014.
While the northern boundary of the Jakarta/WIIF FIR runs along the 5º line of latitude, the ID territorial boundary with India/Andaman & Nicobar Islands follows a line drawn at approx 45º (SW to NE) through the Six Degree Channel. That is, if 9M-MRO was following a track towards Car Nicobar/IGOGU, and then south, it would be tracking away from Indonesian territory.
Any speculation that 9M-MRO’s route was taken with prior consideration to avoid radar surveillance needs to weigh, not only the presence of the TNI-AU air defence radars, but the absence of any declared ADIZ over Sumatra, that ID AIPs described only civil SSR and ADS-B surveillance over in the region, the WIIF FIR boundary, and the ID-IN territorial boundary.
@Don Thompson, DrB
“Her original posts described the Aaza Dana sailing northwards during her observation over the stern” and:
“Prior to 1915UTC 2014-03-07 the Aaza Dana was sailing on a northward course, parallel to the estimated track of 9M-MRO up to that time.”
I have two points there for discussion:
– Wasn’t Kate’s reporting suggesting they were sailing close to eastward at the time of the sighting? See for example:
https://www.cruisersforum.com/forums/f108/i-think-i-saw-mh370-127132-5.html
https://saucysailoress.wordpress.com/2014/05/31/i-think-i-saw-flight-mh370/
– Are we really sure about the time base of the GPS recording?
Niels,
There was previously controversy concerning the TZ of the track.
The track data I have to hand was provided by Marc Horn, I researched the data format used by the logger software and used ‘gpsbabel’ to extract the log to KML and CSV formats. The file format states time stamps are recorded as GMT. User software applies local time zone as appropriate.
The yacht was tracking north bound until approx 1915UTC.
The blog post of May 31st includes:
“And I thought I saw a […] plane cross behind our stern from port to starboard”
UGIB paper, fig 47 (18:52UTC thru 18:54UTC), shows 9M-MRO’s predicted position to the west of Aaza Dana as the aircraft and yacht follow opposing tracks: 9M-MRO southbound, Aaza Dana northbound. The track log shows Aaza Dana abeam the predicted aircraft path, the aircraft does not cross astern.
@Don Thompson,
Kate Tee was an experienced mariner. That night she was on deck observing the stars and learning new constellations. The sky was clear. She certainly knew Polaris and knew North without having to check a compass. She saw a plane coming toward her from due North. To quote Blaine Gibson’s account: “ At approximately 19:10 UTC Kate saw an orange speck about due north. At first she thought it looked like Mars. She watched it for 5 or 10 minutes as It approached her slowly on a due north to south course, fearing it might be a missile. As it approached she could tell it was a low flying plane that appeared to be descending.”
In my opinion she could not have been mistaken about the initial north to south course, because the plane was directly beneath Polaris and approaching her. I am not aware of any mention of the initial sighting being made over the stern. That may have occurred later after the aircraft had passed by.
It is also likely that she saw MH370 turn 90 degrees due west about 7 minutes after closest approach. Per Gibson: “ Upon reaching them the plane turned mostly west (a little south of west).“ Also: “ When she went below to switch on the engine it had made its turn and was traveling south of west. At later brief observations it appeared to be traveling more southerly, but definitely west of south, which leads her to believe it made a small turn again.“
I believe the next turn occurred to due South at 6NFIRWEST circa 19:10, and she may have seen that turn as well.
Eyewitness accounts tend to change over time, especially after a witness has been presented with leading questions, like “Did you see such and such? “ This happened on several occasions to Kate Tee, so it’s not surprising that there are some inconsistencies in her statements over time. However, her account of a light approaching her from the North that turned out to be an aircraft was made initially and prior to cross examination. I consider it to be the most reliable portion of her account.
@Niels,
The UTC times quoted by Don and given on our paper are reliably correct and do not depend on any conversion to a local time zone.
@DrB wrote “Eyewitness accounts tend to change over time, especially after a witness has been presented with leading questions, like “Did you see such and such?”
Indeed, precisely why I focussed only on the two initial written accounts, at the cruiser forum and Ms Tee’s blog, and filtered objective statements from the accounts. Gibson’s meeting with Ms Tee & Mr Horn took place a year after the event.
@Neils
To be more concise on the extraction of data from the track log. A GDB file was provided by Marc Horn, I recorded a hash for the file upon receipt.
While Garmin’s GDB file format is proprietary, Herbert Oppmann had kindly published his reverse engineered definition of the GDB format. Time and date associated with tracks and waypoints is stored in (Unix/POSIX) Epoch format, i.e., seconds since 00:00:00 UTC on 1 January 1970 UTC.
Using Herr Oppman’s description for the GDB format I determined that the internal file metadata showed it as conforming to MapSource GDB format v1.8 and had been created by Garmin MapSource 6.16.2.
The voyage log to Phuket was recorded as 7432 GPS derived position
& time entries.
@Don Thompson, DrB
Many thanks for explaining and confirming the time base for the recorded GPS data.
In original posting May 31st the GPS recorded track (and highlighted portion) is included which suggests the easterly course at the time of sighting.
https://www.cruisersforum.com/forums/f108/i-think-i-saw-mh370-127132.html
It also mentioned:”And I thought I saw a burning plane cross behind our stern from port to starboard; which would have been approximately North to South. It was about half the height of other flights which I had been gazing at during that part of the passage”
This “half the height” was later specified/estimated as between 10,000 and 20,000 feet.
@Niels,
The segment of Aaza Dana’s track that is consistent with a description in which a “plane cross[es] behind our stern from port to starboard; which would have been approximately North to South”” begins at 2014-03-07 19:15:45Z, per the GPS log entry index #6416. That is the first log position after 2014-03-07T13:30:45Z where the yacht’s track is eastward.
Note that the legible Garmin MapSource screenshot included at the 2014-05-31 blog post includes an inset view of ‘Track Properties’. The index references (#6445-#6451) in the inset refer to only six log entries beginning at 2014-03-07T21:35:17Z. These times and positions appear to have no relevance to the description of the observation.
@Don Thompson
“The segment of Aaza Dana’s track that is consistent with a description in which a “plane cross[es] behind our stern from port to starboard; which would have been approximately North to South”” begins at 2014-03-07 19:15:45Z, per the GPS log entry index #6416. That is the first log position after 2014-03-07T13:30:45Z where the yacht’s track is eastward”
I noticed and agree. I’m checking some of my path calculations. So far it seems that such northerly position at around 19:15 – 19:20 is difficult to reconcile with the typical straight path scenarios (19:41 onward) based on BTO/BFO data.
While it was important that she reported it, of course we don’t know if the aircraft seen by Kate Tee was 9M-MRO.
Chinese family members met at the Malaysian embassy in Beijing to request a re-start of the search for MH370.
https://www.facebook.com/MH370Families/
@Niels, @Don Thompson: We authors had a lengthy discussion about whether to include Kate Tee’s witness report of a sighting in the paper. In the end, we decided to include her sighting and how it might relate to our best estimate of the path. However, we opted to not allow her report to influence our best estimate of the path because we cannot be sure of what she saw.
@Victor, DrB
I was still pondering about @Victor’s last comment, and @DrB’s initial comment to me after my question regarding FL200 vs. FL100. Did the consideration of Kate Tee’s reported sighting not (slightly) influence the range of scenario’s considered for the 18:22 – 19:41 interval? This is important in relation with the estimates of available fuel at 19:41 and would impact the fuel probability graph.
In the end, the discussion about the eye witness report underlines how little we know for sure about the 18:28 – 19:41 interval. Even the “hard data” such as the 18:39 BFOs can be interpreted in different ways, leading to the infamous uncertainty in estimates of the time and location of a final turn towards the south. It is even possible that after an initial descend, a turn to the north was made and only later a mainly southerly course settled. This kind of circling could also have occurred later towards 19:41. Similarly, there could have possibly been multiple FL changes. Of course this is all nothing new, however remains important to be re-emphasized in the light of estimated fuel consumption in the 18:28 – 19:41 interval.
In the end, and to keep things a bit simple, the key question is imo if an upper and lower limit for the consumed fuel for the interval can be estimated; the lower limit perhaps being both the easiest and the most relevant for the overall probability analysis.
@Niels: We would not claim that the path we proposed is the only path possible between 18:28 and 19:41. Rather, it fits that satellite data and also satisfies the additional criteria that there was no circling and no part of the path that tracked towards the east. Others may choose different criteria and generate other paths.
@VictorI
Also following your criteria there can be other options for the 18:28 – 19:41 interval than your proposed path, which at 19:41 have a latitude slightly further south and would have slightly more fuel available (for example based on a descent to FL200 instead of FL100). It would be interesting to check how/if these can be connected to high probability post-19:41 paths at slightly lower FLs than your proposed path.
An interesting article from Mar 2014 in THE DIPLOMAT.
“China’s National Priorities in Hunt for MH370”
A standoff with the Philippines appeared more important for China’s Coast Guard than a search for survivors.
What’s striking is that most of these ships were sent from far away when vessels much closer to the search site were not used. Throughout the whole period immediately after the disappearance of the plane, the China Coast Guard had several ships on duty in the Spratly islands, only half the distance from the initial search area as the mainland. However only one of them was used: 3411. Instead, the Coast Guard deployed its largest vessel, the Haixun 31, from Sanya. The Haixun 31 is far larger and more capable than the ships that were closer to the scene but its response time was much slower: it arrived in the search area on Tuesday afternoon. It would appear that the China Coast Guard chose to prioritize something more important than life and death: territory.
Throughout the search for MH370, at least five China Coast Guard ships were blockading features in the Spratly Islands: three near Scarborough Shoal off the coast of the Philippines island of Luzon and two around the Second Thomas Shoal.
….. On March 9, while other Chinese government ships were making their way to the supposed crash site of MH370, two China Coast Guard ships were preventing two Philippines ships from reaching the reef. According to the Chinese, the ships were carrying construction materials intended to reinforce the marine’s position on the Shoal.
The timing seems significant. March 30 is the deadline for the Philippines’ government to submit its evidence to the international Arbitral Tribunal hearing a case that could, in effect, rule China’s U-shaped-line claim in the South China Sea incompatible with international law.
…We now know that there was no crash site in the South China Sea. But what if there had been? What if, by some miracle, a group of survivors had been clinging to a life raft in the waters between Malaysia and Vietnam? That two-day delay in reaching the search area could have been the difference between life and death. China’s Coast Guard appears to believe that grabbing territory is more important than that.
https://thediplomat.com/2014/03/chinas-national-priorities-in-hunt-for-mh370/
@CanisMR: A standoff with the Philippines appeared more important for China’s Coast Guard than a search for survivors…That two-day delay in reaching the search area could have been the difference between life and death. China’s Coast Guard appears to believe that grabbing territory is more important than that.
Sounds about right.
@Don Thompson, @Niels,
I have also investigated the “Aaza Dana” GPS track in forensic detail, as you both have.
Victor has correctly stated that we had a lengthy discussion as authors, whether to include Kate Tee’s sighting or not.
You have both mentioned the issues with eye witness reports and I agree with your views.
Victor has also pointed out, that the FMT path we proposed is not unique. There are certainly other FMT routes, that can be proposed, but they are few, in my opinion.
I would point out, that it took us a long time to find any path that matched all the data, both before and after the FMT.
It is difficult to find a FMT path, that matches, both before and after, the satellite data, the aircraft performance data, the fuel data, the weather data, … not to mention … possible radar avoidance, possible land overfly avoidance, possible traffic avoidance, possible pilot’s objectives and preferences, …
When you finally find a possible fit …
When Aaza Dana’s GPS data also fits …
Then you wonder, whether Kate Tee’s sighting might also fit, despite all the misgivings.
When the altitude of an approaching aircraft is only determined by the height in relation to the yardarm, then as an old sailor, I have to laugh. A sailor will say, when the sun is over the yardarm, then it is time for a drink.
@Richard
I’ll drink to that!
@Sid
“Sun over yardarm” occurs too early in the day for me to start drinking.
@Richard
I agree it is not so easy to find a path that fits all that you mention and that progresses west and south, though small variations like through FLs are of course possible. To me the most interesting variations are those that lead slightly further south at 19:41 with slightly more fuel available.
Regarding the yardarm: I have spent many hours on the water, however I’m not very familiar with sailing traditions and technicalities. I wonder, those on these square rigged boats with many yards stacked, they would then have very joyful days.
Did any of you ever contact Kate Tee directly, and quiz her, specifically, on the position of the object she saw, not just relative to the boat, but relative to the star bckground, ie, elevation, particularly ?
I seem to remember reading that she had been learning a “constellation per night”. It might be worth persuing this line of inquiry in detail.
If she could provide such details, it would be a trivial matter to determine the azimuth and elevation of the stars in those constellations from “Aaza Dana” at various times and positions off her GPS data.
From that, you could then refine the plausibilty of the candidate paths you have for 9M-MRO.
@ventus45
I had, like others, exchanged numerous emails with Kate Tee and her circle.
She and others kindly provided all their data, their analysis and group correspondence.
I also analysed the stars to be seen on that night at that location.
I believe she saw MH370, despite all our misgivings and apparent or actual contradictions.
@DennisW
You are misinterpreting Old English.
“Over the yardarm” would these days be translated “On the yardarm”.
We are talking about Sunset not Sunrise.
@Richard
Re: “Over the yardarm” would these days be translated “On the yardarm”.
We are talking about Sunset not Sunrise.
Are you sure about that, Richard? The Royal Australian Navy might have adopted a different interpretation of that expression because on the occasion I was on a RAN base “the sun being over the yardarm” was always construed as being late morning.
@Mick
Late morning is my take on it as well.
@MickG, @DennisW,
No comment on the alcohol consumption of the Australian Navy.
@Richard
Yes, that is wise, although I will say my UK working colleagues were mostly of the “wake and bake” variety. A fun crew to be sure.
(tangential?) News item from Mar 7 2014
Merely hours before the disappearance of MH370, a possible terrorism threat to a commercial flight between Brussels and Vienna was declared by German authorities acting on a tip from Belgian police. After the aircraft landed in Vienna, it was isolated, and police SWAT teams boarded and searched the aircraft. Nothing suspicious was found, but curiously, the newly appointed PM of Ukraine was onboard, on his way back to Kiev from Brussels.
Flying back to Kiev via Vienna from the Brussels summit last night, Yatseniuk’s plane was grounded in Vienna and boarded by anti-terrorist police units. Everyone was taken off the plane, according to the Vienna papers this morning.
German air traffic control had received a warning there was a ‘terrorist’ on board. The Germans passed the warning on to the Austrians. When the plane was searched, after being parked in a distant corner of the airport, there was no sign of anything suspicious.
It did emerge, however, that the Ukrainian prime minister was on board. He caught his connecting flight Kiev an hour later, said Vienna’s Kurier newspaper. “Russian secret service circles are assumed to have been pulling the strings behind this terrorism false alarm,” said the paper, quoting Vienna police sources. All passengers were questioned. None of them noticed anything suspicious, the paper said.
https://www.theguardian.com/world/2014/mar/07/ukraine-crisis-putin-russia-crimea-us-eu-sanctions-live-updates
NOTE: this also happened mere hours before the start of the Sochi Paralympics games
Here’s an article that will interest some here:
U.S. Spy Plane Impersonates Malaysian Aircraft, Apparently to Fool China
https://www.popularmechanics.com/military/aviation/a33970936/us-spy-plane-impersonates-malaysian-aircraft/
This involves an RC-135W spoofing the ICAO ID of the Mode S transponder while surveilling Chinese islands in the South China Sea.
@ VictorI
Very interesting article! To understand the geostrategic importance of the South China Sea to China here’s an article on a French think tank website (article is in English):
https://www.geostrategia.fr/the-south-china-sea-chinas-next-nuclear-playground/
ICBM capable nuclear submarines are part of the so-called nuclear ‘traid.’ The current Chinese SSBN’s are noisy, and the ICBM’s on board don’t have the range to reach CONUS.
Until it acquires better ICBM’s and SSBN’s, to project credible nuclear deterrence, China needs the South China Sea to allow it’s 4 SSBN’s to move undetected and unmolested from their base in Hainan and reach the Pacific ocean.
Kate Tee believes the pilot suicide narrative is disinformation from the CIA. In her most recent blog post, she links to reports she believes are most helpful:
https://saucysailoress.wordpress.com/2020/08/19/mh370-interesting-links/
@CanusMagnusRufus
Why would it be a surprise, or even argued, that the South China Sea is of strategic importance to China?
For China, the South China Sea is as the Gulf of Mexico/Caribbean is to the USA.
The USAF, USMC, and USN operate aircraft from many territories around the SCS. Contemporary imagery from many sources show P-8A Poseidons, P-3C Orions and other types parked at the former Clarke AFB in the Phillipines, Changi and Paya Lebar Air bases in SG, and RMAF Labuan, Sabah
Also, any suggestion that a specific terrorist threat must be taken seriously. I don’t have numbers, just lived experience, that hoaxes can be as disruptive as an actual attack.
A few months back, I spotted a USAF C-130J actively transmitting dual identities not far from my location.
The ADS-B tranmission provided the ‘correct’ ICAO ID for the aircraft whereas the SSR response (from which the MLAT position was derived) carried the ‘bogus’ ICAO ID.
It’s not an uncommon observation, ADS-B appears to be regarded as the ‘optional’ transmission when in operational conditions. C-130s transit through nearby RAF Aldergrove (BFS/EGAA) and C-17s through Glasgow-Prestwick (PIK/EGPK) with some regularity and on occasion the dual ID is observed.
The C-130J is equipped with a combined IFF, ADS-B, civil SSR transponder.
Concerning Kate Tee’s latest post … because one always employs !!CAPITAL EMPHASIS!! when calling into question a particular narrative.
Also, it’s a particular style to support one’s opinion with myriad references to other published sources (reader will find TL;DR), some of which are relevant to the point, some of which have an air of credibility, and at the same time, don’t.
I believe this style relates to confirmation bias.
@Don Thompson: What I found interesting is the use of a Malaysian ICAO ID for a US military plane. It does make me wonder if there are military surveillance operations coordinated with civilian aircraft.
@Victor Iannello.
I took some time to look at what has been reported and what can be observed of these surveillance a/c movements in the South China Sea area.
At least four Twitter users spend quite some time following military movements and reporting their observations: @AircraftSpots, @MIL_Radar, @eos40is, @CivMilAir.
There’s quite a range of aircraft types used and individual airframes appear to be rotated in and out, from the US, frequently. As I write. RC-135W/#AE01CD operating as ‘SNOOP55’ is enroute into Yokata from Kadena followed by a KC-135R.
Considering that military aircraft must comply with civil air traffic management in the vicinity of their bases/controlled airspace, the surveillance aircraft are openly displayed on trackers while departing from and arriving into their forward operating bases such as Kadena AFB, Okinawa. Once within the lateral boundaries of en-route airspace, and below FL290/typically, they may adopt their ‘clandestine’ ID.
If the surveillance aircraft were to fly through FIRs/ADIZs without flight plan cover (supported by a clandestine ID), e.g. a flight plan describing an ad-hoc civilian ferry flight, it’d be quickly identified as an unauthorized intruder and possibly attract an air intercept from PLA-AF aircraft. An ad-hoc flight plan providing cover for the clandestine activity gives a greater chance for the surveillance activity to be successful.
IIRC, earlier this summer, a USAF E-8C ‘JSTARS’ mission was the subject of a CN-US diplomatic spat after its sortie along the coastline of China during some PLA exercises.
While the RC-135W ‘Rivet Joint’ #AE01CE mission, discussed above, used a Malaysian assigned ICAO hex code, #750547, this code was higher in the allocation sequence than any yet assigned to a MY aircraft. Some Air Asia and Malindo aircraft have been assigned codes in the 7504xx range.
I suspect that ICAO codes from any allocation to SE Asian registration authority may be used for clandestine cover – MY, VN, KH, LA, PH, SG, ID, TH. Perhaps less complex to just ‘borrow’ than to ask! It certainly would be possible to ‘join the dots’ between the overt IDs of surveillance aircraft and the corresponding covert IDs, access to a comprehensive archive such as OpenSky Network would help greatly, and some time.
Further, I’d be surprised if the Chinese authorities/think-tanks are not monitoring ADS-B and SSR transmissions in the area of all US airbases and any temporary deployment airfields for overt departures and arrivals, then connecting the appearance, en-route, of ad-hoc movements. One of the Twitter users above also reports on unidentified CN aircraft, perhaps the game is played by both sides?
@Don Thompson: Considering that in these cases it is not difficult to connect the dots between a military flight with proper ID and a surveillance flight with altered ID, what is to be gained?
@Victor Iannello,
“what is to be gained?”
A good question! A moderate degree of obfuscation of intent or perhaps the practice is simply a long standing operational procedure that no longer has much practical benefit.
While this recent report concerning the RC-135W and the MY hex code, and the earlier E-8C incident, have gained some media attention it would appear that such flights are very regular. If covert flights solely exploited a particular country’s ICAO hex allocations for SSR ID, that could be misconstrued as the involvement of that country.
@Don Thompson: Perhaps mild obfuscation is a decoy to hide deeper obfuscation. After all, we really don’t know what occurred during the interval between the connected dots.
@Don Thompson
@Victor
“While this recent report concerning the RC-135W and the MY hex code, and the earlier E-8C incident, have gained some media attention it would appear that such flights are very regular.”
The US and other nations have been surveilling the China coast for many years. You might recall that about 20 years ago a USN EP-3E was forced to land on Hainan Island after colliding with a Chinese J8 fighter during an intercept over the South China Sea. The amount of activity over the SCS has increased markedly since China began building military facilities in the disputed areas. Chinese air defence operators are often heard challenging US military aircraft and ships on the VHF guard frequency (121.5 MHz).
“Considering that military aircraft must comply with civil air traffic management in the vicinity of their bases/controlled airspace…”
Hong Kong ATC has a big problem with unidentified aircraft, believed to be military, transiting through its airspace. The aircraft squawk their altitude, but are not identified and do not respond to calls from ATC. I had an incident a number of years ago, while climbing out of Hong Kong on the way to Singapore. We were advised by ATC that there was unidentified traffic nearby, maintaining an altitude that we would climb through to reach our cruise level. We levelled off at a lower altitude and subsequently spotted a US RC-135 fly overhead. I’m told that Chinese military aircraft also transit the airspace without ATC identification.
@Andrew: In the case you reference, the transponder was activated in Mode C with a fake squawk number? I suppose that meets the minimum requirements for safety in busy airspace. Out of curiosity, was the RC-135 above the airport’s airspace? Above FL180?
@Andrew /VictorI
Just finished reading Richard Quest’s book about MH370. He flew with FO Hamid from HK to KL on board a B777 2 wks prior. Here’s a quote…
Cockpit access rules in parts of the world other than the US are frquently more accomodating, even today. Airlines and regulators will give permission for cockpit filming if you ask in advance and they obviously know who you are and what you’re about. MAS was keen to pull out all the stops to make this visit go extremely well and it seemed everyone was prepared to do whatever was necessary.
1. without sufficient security guarantees, would an airline’s insurer allow cockpit access for visitors on a regularly scheduled commercial flight?
2. would the insurer have required IFSO’s to be present when CNN was filming inside the flight from HK to KL?
3. does the phrase ‘everyone was prepared to do whatever was necessary’ suggest that MAS (or even Turner Broadcasting) hired extra security for this flight?
@Victor
I assume the ‘intruder’ was squawking an unassigned code. ATC had the aircraft’s altitude, but no other information. The incident occurred in radar controlled airspace, about 80-100 NM south of Hong Kong, at FL250-ish.
@CanisMagnusRufus
I do not know if MAS or its insurers required extra security for the flight in question.
@Andrew: That’s fascinating! So, the military surveillance aircraft was in Class A airspace with no flight plan and squawking an unassigned code. Until you have made visual contact, or it was detected by TCAS, it would seem dangerous to trust the altitude.
@Andrew. This places a new light on Boeing’s knowledge as to reaction times to be expected on an MCAS runaway.
I think it increases their liability markedly.
https://aviationweek.com/air-transport/aircraft-propulsion/boeing-aware-pilot-response-issues-during-max-certification?elq2=532fa5983416496b819393f103135230
@David
I agree. The Final Committee Report and other documents can be found here:
Boeing 737 MAX Investigation
This report, COVID-19 and more production problems for the B787 add up to a world of hurt for Boeing. I’m glad I’m not a shareholder!
@Andrew
It would take a bit of courage to buy in right now, however, the shares are undervalued by 40% on a discounted cash flow basis. 😀
@Don Thompson/VictorI
Blaine Gibson, in an interview with Mick Rooney (see video at 0:38), claims that Don Thompson has identified a ‘private’ B777 that flew into Male, in the Maldives on Mar 8 2020.
https://www.youtube.com/watch?v=Z6pDVTuiqpE
If this is true, Florence de Changy’s claim that it was a Dash-8 that the villagers of Kudahuvadhu saw on the morning of Mar 8 is false. Is there any more info about this ‘private’ B777?
@CanisMR: Don has found a B777 flight that could have been what was seen in the Maldives on March 8, 2020. I hope he has the time to provide more details.
@Victor
The above Mick Rooney/Blaine Gibson interview starts slow, but gets quite powerful after about 1:05 or so. Blaine has become one of the best MH370 communicators and strategy developers, similar to how he originally worked with DrP to successfully find some of the early debris.
Starting about 1:08 Blaine gives his next search strategy which I directionally fully support. In short he recommended 34S + 32S + Broken Ridge + misc rechecks.
I am getting much weaker on Xmas but I would like to hear (eg; from Blaine) some counter-argument of the Xmas-advocates’ claim that the barnacle evidence essentially excludes the southern search area.
@CanisMR
Thanks for posting, and thanks to DonT for trying to help explain to the public why one of the key eyewitness sightings was an aircraft other than MH370.
@CanisMR
Would you have a link to the Le Monde article in which the “explanation” by Florence de Changy was published. I’ve never believed this “Dash-8” story; there are some details I would like to recheck before commenting in more detail. It has been a while ago I looked into this story, however I clearly remember my conclusion.
@Neils
She wrote up an article in English (see link). There’s a picture of the Dash-8 in question.
https://www.scmp.com/magazines/post-magazine/article/1830548/could-plane-spotted-maldivian-islanders-really-be-mh370
@CanisMR
As I understand it, the premise of FdC’s book is that 9M-MRO crashed in the South China Sea. Thus it was important, so as to sustain that assertion, that any other theories for the loss of the aircraft should be discredited. Routes flown by Dash-8s to FVM and GAN (using airway R329), as operated on morning of the 8th Mar, lie some distance east of Kudahuvadhoo. At any altitude, a Dash-8 at a distance of 15ni or more is unremarkable. Also, the Kudahuvadhoo islanders described an aircraft flying, generally, southbound.
During the period of interest only one Dash-8 operated a southbound leg, MLE-FVM, on a MLE-FVM-GAN-MLE roundtrip (MLE ATD 06:08 local). Typically, the early morning domestic flights are inbound to Male so as to deliver passengers connecting with departing international scheduled flights (e.g. FZ, QR, UL, EK, SU).
The flight, DQA 149, quoted in the above linked SCMP article was operating northbound, from KDM-TMF-MLE, departure TMF at 0645, arrival at MLE at 0723. A normal routing would pass the latitude of Kudahuvadhoo at approx 7am but 20mi east, and flying northbound.
A member of the NoK community kindly forwarded me extensive records sourced from the Maldives authorities. These records detailed a non-scheduled, privately operated, B777-200ER landing at Male at 0835 local time. This aircraft was operating a service into MLE and onwards to PEK, presumably associated with then Saudi Crown Prince Salman’s diplomatic and economic tour which involved visits to Pakistan, Japan, the Maldives, India, and China during Feb and Mar 2014. While I write ‘presumably’, public resources show the same 777 in Japan during the period of the Japan visit. Note that this B777 is not part of the Saudi government/royal flight that directly supported Crown Prince Salman’s entourage (comprising a 747SP, an A340, and a G-V).
It hasn’t been possible to acquire an SSR/ADS-B recorded track for this B777-200ER on 8th March however it’s notable that the records to hand show that ATC transfer from ‘traffic’ to ‘tower’ took place 52 minutes before its actual time of arrival whereas other inbound movements logged only 10-15 minutes of tower comms before arrival. This indicates that the aircraft was in the tower controlled airspace for a considerably longer period than normal (no delays were evident for any arrivals, and ramp parking space was available even with one entire bay blocked by Salman’s B747SP, A340 and G-V).
Certainly the question remains as to why a B777 would make a low overflight of the Dhaalu atoll and Kudahuvadhoo, or perhaps the interest was Faafu Atoll that lies just north of Dhaalu.
However, it is a fact that a B777-200ER operated in Maldives airspace on the morning of March 8th, 2014. That B777-200ER was not 9M-MRO.
Developments for Ocean Infinity’s Armada unmanned surface fleet moving with pace. Vessel constructor publishes an update.
To the best of my knowledge, gathered from public sources, these GMV 21m vessels will initially be deployed to operate MBES, RoVs and towed underwater vehicles but not AUVs.
Don Thompson said: However, it is a fact that a B777-200ER operated in Maldives airspace on the morning of March 8th, 2014. That B777-200ER was not 9M-MRO.
That is by far the best explanation we have for the airliner sighting in the Maldives. Thank you for your persistence in solving another part of the MH370 mystery.
@Don Thompson, CanisMR
I agree that the Dash-8 flight DQA149 was operating northbound; that was what I also found back in 2015, and I think it was also concluded by Blaine Gibson as is documented in his Aug. 2016 report. I have a flightradar snapshot possibly showing DQA149, at 01:00 UTC. We have to check the flight times; I thought it was scheduled to depart around 05:20 local time.
Would you know the aircraft registration code for this privately operated B777 you now introduce as possible explanation? -> what would it look like (painting/colors)?
@Niels
Photo of specific aircraft.
A web search for this airframe will turn up a report concerning its disposal as a ground test article for a ballistics research project. I am reliably informed that the contract of sale for this purpose was not completed.
FWIW, the planespotters.net website shows that HZ-AKF has been stored at Kansas City since Sep 2019, registered N771CL.
@Andrew,
Thanks for that update, I hadn’t checked back at Planespotterrs for a while.
@Don Thompson
Thanks for sharing the photo. There is also this video of HZ-AKF landing at Geneva airport.
https://youtube.com/watch?v=2woauvplp4U
What do you think of the appearance of this aircraft in the light of the eyewitness reports / were you for example able to discuss this with Blaine Gibson?
@Niels
The number of Kudahuvadhoo residents who reported seeing an aircraft on the morning of the 8th Mar would suggest that they, indeed, sighted an aircraft.
Several were confident that they would reliably recognise the types operating domestic services between the islands, the Twin Otter float planes and the Dash-8 turboprops.
I have talked at length with Blaine Gibson.
The FdC reported notion that a Dash-8 was ‘blown’ miles off course is risible.
For some time I’d explored the possibility that a private aircraft operating into Gan/VRMG, or even the civil operated AMC ‘East Coast rotator’ service into FJDG, may have been the object of the sighting. The winter vacation season sees privately operated B737, A319/32x, & B757 aircraft visit Gan. Finally, with some assistance, I gained access to a complete log of flights in the Maldives FIR for 7th-9th March 2014 (the ‘rotator’ FJDG service operated only on the 7th March).
Contact is underway with the party understood to be responsible for the a/c log book so as to confirm the a/c off-block time on departure for Male on 8th March. With the ‘diversion’ required to overfly Kuvahuvadhoo, I expect the flight leg to Male to be an hour, or more, longer than typical. I’m not confident that we can get any relevant flight tracking data at this point in time.
@Don Thompson
Perhaps we could play a flight simulation video of the B777, and any other candidate aircraft to the eyewitnesses, and see which one they identify as being closest to the aircraft they saw that day.
The latest version of MS Flight Simulator is impressing many people, and Bellingcat has a nice article about the research potential of this software.
https://www.bellingcat.com/resources/case-studies/2020/08/24/cleared-for-takeoff-exploring-microsoft-flight-simulator-2020s-research-potential/
Microsoft Flight Simulator 2020 (MFS2020) launched last week, promising players the ability to fly anywhere on the planet thanks to the integration of several technologies. The game pulls satellite images from Bing Maps, and populates them with objects (such as trees and buildings) using the Microsoft Azure cloud network. The game “knows” whether an object needs to be rendered using an artificial intelligence machine learning algorithm from Blackshark.ai.
The results are impressive, life-like visuals of anywhere on Earth, from cities and small towns to natural wonders and everything in between. The game’s ability to render objects and places is so impressive that it got us wondering — could we use this as a tool for open source investigations?
The addition of each aircraft’s unique livery, will help trigger the recollection of the eyewitnesses, and provide confirmation.
Perhaps Blaine (with a TV crew in tow) could hop over to the Maldives and interview the eyewitnesses?
@CMR
The latest release of MSFS might be better retitled MS Global Visualisator. AI and ML: not sure that’s needed, there’s plenty of digital feature data available to inform where a forest, sand dune, etc, can be found to be rendered. I like Bellingcat’s use of the word ‘game’.
It’s likely that Kudahuvadhoovians have had so many photographs of aircraft passed in front of their eyes I doubt any objectivity remains.
Blaine Gibson was accompanied on his visit to Kudahuvadhoo by a German journalist. The journalist wrote his account at Zeit Online
A guy on Twitter is using MSFS 2020 and he advises me so far FS9/FSX seems more accurate as far as flying. I already hook my FS9/FSX into Google Earth so I can fly over Kuala Lumpur at 1000-ft if I want to fly down the roads. I can only look down, and not forward however, that would be cool.
@TBill: MSFS2020 is a resource hog. At a minimum you need an Intel i5-4460 CPU along with a Radeon RX 570 or NVIDIA GTX 770 GPU, 2GB of VRAM, 8GB of RAM, a 150GB hard drive and a 5Mbps connection. Recommended hardware is Intel i7-9800X CPUs paired with high-end Nvidia RTX 2080 GPU with at least 8GB of VRAM, 32GB of RAM, a 150GB SSD and a 50Mbps connection. I have purchased MSFS2020, but until I get a machine with a more powerful graphics card, it doesn’t work well.
If you are interested in seeing scenery from cruise altitudes, there is no need to install MSFS. Google Earth does fine. You simply create a path and then “Play Tour”. You can set the altitude and camera tilt angle so that the view is similar to the forward view from a cockpit. More details can be found online. It’s a good way of practicing pilotage with visual references before an actual cross-country flight.
@Don Thompson
If possible, determining total flight time from SA to landing at Male would indeed be a good way to proceed.
I’ll check some of the old flightradar snapshots of the area I collected back in 2014. Actually, I’m curious to know how long global tracking data is maintained in their databases.
@TBill et al..
my suggestion in using MSFS is to look at the aircraft including original livery from the perspective of the observer on the ground. It allows one to input the time, location, height, heading, speed, bank angle etc. so gives the user the ability to control for shadows etc.
@VictorI/Don Thompson,
Although Blaine Gibson is very articulate, and has done great service in retrieving debris from the east African coast, what I find quite strange is his insistence on the ‘uncontrolled’ dive for the end of flight scenarios. In literally every single interview he has given, he never fails to mention it, and always provides his own debris finds as supporting evidence. The french NoK Ghislain Wattrelos has expressed reservations about him, and JW also doubts the provenance of the BG’s debris finds.
Xavier Tytelman has a very nice video (french) briefly summarizing the debris finds.
https://www.youtube.com/watch?v=1ruFWW-q5Z0
What’s remarkable is that the debris found by BG support the ‘uncontrolled dive’ scenario, whereas without these pieces, the debris doesn’t reveal much about end of flight scenarios. Here are the 3 pieces that I’m referring to:
– no step – supports flutter and hence uncontrolled dive
– burnt floor cover – supports fire inside cabin
– seat back cover – supports break up of the cabin
@CanisMR: One of the most persuasive pieces of evidence that contra-indicates the theory that there was a controlled ditching with flaps extended are the witness marks on the recovered flap, as analyzed by the ATSB. Blaine was not associated with this find.
I’ve directly interacted with Blaine enough over the years to be quite certain that his intentions to help solve the mystery are sincere. As for the two doubters you cite, one only needs to look at the theories they are promoting to understand that their judgment should be questioned.
…if I recall correctly, in the above interview, Blaine does not support fire inside cabin. Blaine did suggest that when the debris was first found, but I believe he accepts the analysis that the burn mark was made later after the debris washed up.
Blaine does believe violent crash theory due to the cabin debris he found/seat video frame. But also the internal bulkhead panel which was *not* found by Blaine and also indicates break-up. Personally I am not as sure as Blaine that it had to be such a violent break-up, but a fuselage break up is indicated.
Just lately, I am hearing some people say the NO STEP supports flutter theory. But I do not think I’ve heard Blaine say that himself. The hypoxia/accident theory people like the flutter theory because they do not like the intentional pilot ditch story.
@Victor
The ragged edges on the flaperon were either the result of flutter or sea impact. I’ve not heard an expert opinion about which. Why do you suppose that is?
I agree that HZ-AKF is most likely what the Kudahuvadhoo witnesses saw
@CanisMagnusRufus
Re: ‘… burnt floor cover …‘
What burnt floor cover?! Are you talking about Item 24, the discoloured composite panel recovered from near Sainte Luce, Madagascar in February 2016?
@Victor. “One of the most persuasive pieces of evidence that contra-indicates the theory that there was a controlled ditching with flaps extended are the witness marks on the recovered flap, as analyzed by the ATSB.”
I agree though I think this all remains inconclusive still.
The external witness marks on the recovered part of the right outer flap was evidence to the ATSB that it was retracted when it separated, those being from a collision with the flaperon.
Two problems with that are that there was other external damage to the flaperon that should have led to corresponding damage to the flap in this collision had the flaperon been housed still, but yet didn’t. The second is that the joint damage evident indicated the chords of the two were misaligned, the flaperon being higher. The ATSB maintains that also the flaperon was housed at its separation. The height difference is hard to explain if they were both housed when ostensibly they collided, even were the flaperon at its trailing-edge-up limit.
Also, the separation of the trailing edges of the right outer flap, adjacent flaperon and the left outer flap do provide some intuitive support for that having occurred when both were deployed during a controlled ditching, as you know.
The internal witness marks to the flap are consistent with it being housed at the time of that damage and it is hard to see how that was not coincident with separation.
Even so as I remember it Larry Vance is of the opinion that its trailing edge separated in a ditching, the flap remainder collapsing from extended to housed, the internal damage following at its separation. I do not agree with him though that a successful controlled ditching was likely: there are other considerations such as whether the flap support structure could collapse like that.
Even so I think it possible that this could have been an unsuccessful ditching.
If so that would not rule out intent and a pilot.
To me the more conclusive evidence might lie in the damage to the fuselage internal items. Most unfortunate it is that Malaysia in its investigation did not see to damage assessments of these and selected external components including the right engine vortex generator and parts of panels.
The only comprehensive damage assessment done was on the flaperon but even that has not been revisited (nor to my knowledge has that even been sought) since the above ATSB assessment was formulated, flaperon drift experiments by CSIRO were conducted and closing panels from above the flaperons were recovered.
@DennisW. The French opinion, after detailed and expert examination of the flaperon trailing edge frayed skins, is that the trailing edge broke off by being bent upwards when deployed. I believe their overall assessment is now outdated but not in that part of it.
However they then concluded that this was consistent with it being dragged through water. Some weaknesses with that are that they did not consider the effect on wake of the engine, directly ahead if still there, or its pylon if not; or possible impact with engine cowls, flap housings and engine, or indeed overstress (as distinct from flutter) in high G at speed, e.g. in a spiral.
The baseplate of the vortex generator has been in the hands of Malaysian authorities for a year now, but they have not yet published any analysis of it at all.
@Dennis asked: The ragged edges on the flaperon were either the result of flutter or sea impact. I’ve not heard an expert opinion about which. Why do you suppose that is?
Looking at the flaperon alone, I think it is inconclusive. Complicating that is the flaperon has only been examined by the French (with a Boeing representative verifying that it came from 9M-MRO). Many of us conclude there was likely no attempt to ditch, but we reach that conclusion by considering additional evidence.
I’m not sure it really matters. The impact distance from the 7th arc is independent from whether or not there was a controlled, flaps-down ditching.
…that gives me a lot of “latitude”
@David said: I agree [that one of the most persuasive pieces of evidence that contra-indicates the theory that there was a controlled ditching with flaps extended are the witness marks on the recovered flap, as analyzed by the ATSB] though I think this all remains inconclusive still.
Thank you for the insights you provided in your comment. The ATSB obviously feels more strongly that the flaps were retracted.
As an aside, I am not sensing any desire to conduct an underwater search in the upcoming season. That probably means it will be a long time, i.e., years, before another search occurs.
@Victor. Do you know what OI’s lead time is? How many months in advance of “vessel on site” do they need to make that go/no-go decision?
@paul smithson: My guess is no less than a couple of months, but there are many factors, including the position and availability of the designated vessel. There might be others here that can provide a more precise estimate.
@VictorI
You said: “The impact distance from the 7th arc is independent from whether or not there was a controlled, flaps-down ditching.”
Can you elaborate? An uncontrolled descent is believed to result in a crash site close to the 7th arc, while a controlled ditching (e.g. a glide) should add a considerable distance.
Perhaps I misunderstand.
@Sid Bennett: What I mean is a long, straight glide doesn’t have to end with a controlled flaps-down ditching, and a controlled flaps-down ditching doesn’t have to be preceded by a long, straight glide. In much the same spirit, a 0.7g downward acceleration (as suggested by the two final BFO values) doesn’t guarantee there was not a subsequent long, straight glide.
@VictorI
I quite agree. We are on the same page with this.
@Victor/Sid
Said another way, we have no idea where the aircraft entered the water. OI, or any other party, would be foolish to initiate a search.
Frankly, I think the search for the aircraft is over.
@DennisW (and for the information of others here – who are not Australians)
Subject: Cold Cases.
This week, saw the partial conclsion, of one of the worst episodes in our criminal legal history.
Back in the mid 1990’s – three young women – were abducted – raped – and murdered – in the space of nine months – from the same late nite entertainment precinct – in Western Australia.
The fear that was created by the “unsolvability” of these cases was palpable – and as a result – it changed the way people lived their lives.
Only the second and third women were found – the first remains unfound.
Over the years, over seven hundred police officers and forensic experts have worked on the case(s).
It has taken more than two decades, but finally, the killer was found, and he was finally convicted on two counts of murder – only days ago.
The judge said that he could not convict him of the first, but that “the preponderence of evidence” strongly suggested that he killed that woman too. The “MO” as you yanks call it – was the same in all three cases.
The first girl is still missing as I said.
The search continues.
Similar to what Blaine Gibson feels in the above interview, I would currently bracket the aircraft between the current 180-S 34-S LNAV and DrB’s prior 181-S CMH path to 31.5-S. With active pilot possibly going beyond Arc7, if we just say some derivative of 180-S, true or magnetic, it is still a very wide search region.
I am not without hope, but we need to shake loose info Malaysia is sitting on, maybe get debris studied by Boeing or something like that. It is one thing to keep data secret, but work on it (like NTSB/FBI) but to just sit on data with no analysis says a lot about Malaysia’s handling (they must essentially know what happened and are sweeping it under the carpet for reasons of national pride, etc).
My bet is still on 39.6S (say 39.5-39.9). Someone tell me where to lay my wager.
@Paul
Byron Bailey wants to bet his house on that area. So far he has no takers.
Byron’s house lies a bit further south.
I’d put the farm on 39.5-39.9 🙂
Correction – if I have Byron’s house correct, I think it is -39.167 88.300 (39 10S, 88 18E). Which represents “glide beyond” the 7th arc more or less over the original IG/DSTG hotspot. Fugro deep tow sonar came within 4.5NM of this spot.
I’m not quite sure where exactly Simon Hardy’s preferred spot is. Or Mike Keane’s as I couldn’t find a definitive geo-reference for either.
@Paul Smithson.
Re positions for Hardy Bailey Keane
https://auntypru.com/forum/showthread.php?tid=24&pid=9973#pid9973
https://auntypru.com/forum/attachment.php?aid=431
As some will be aware, in September 2017 an engine fan separated from an Airbus A380 when over Greenland. The BEA final report into that has been published this month. Of interest to some, one conclusion is, “The cold dwell fatigue phenomenon brought to light by this accident was taken into account neither in the engine certification nor in the engine design.”
But also, preceding that final were two other reports into the location and recovery of a large chunk of the fan, some 21 months after its separation. That was from under 4m of snow in a remote area with bad weather, hidden crevices and a risk of polar bears.
While not of direct bearing to the finding of MH370 sunken wreckage I suggest these location and recovery accounts, while lengthy, might be worth a skim to some who are unaware of them and can spare the time. They relate a tale of persistence, innovation and a diverse range of skills.
At the below click on ‘Technical Reports’:
https://www.bea.aero/en/investigation-reports/notified-events/detail/event/accident-to-the-airbus-a380-registered-f-hpje-and-operated-by-air-france-on-30092017-en-route-over/
@DennisW
I do not subscribe to your conclusion that the search is over. New data and new insights continue to become available.
That,for example, a glide scenario is considered more seriously now points to the deficiencies in the resource allocation for the previous searches.
@Sid
The reason the glide is considered more seriously now is because the wreckage has not been found in searches near the arc. It is not based on a new theory of the flight. Previous searches were correctly made in areas close to the arc. There were not deficiencies in resource allocation.
I cannot think of any new data or insights that have come to light except in the Bayesian sense of the wreckage not being found in the area searched.
@DennisW
In my mind, the main “new” technical insights are-
(1) Lack of finding MH370 near Arc7 in prior searches (as you say)
(2) OI found Argentine sub in prior searched area (contradicting Item-1)
(3) DrB et al models (fuel/path )
Several potential new insights from 2020 (not yet consensus)
(a) UGIB report makes the most cohesive argument to date for the passive pilot case, with fuel exhaustion at Arc7
(b) Tony Abbott disclosure that Malaysia privately thought it was likely pilot suicide, and also, to my ears, Abbott gave his endorsement to consider active pilot with glide
(c) France efforts to meet with Boeing, which indirectly yielded Boeing rep coming onto this site and saying why he thought it might be water ditching on the flaperon…unresolved
Items (b) and (c) to me are outcome of international disagreement with Malaysian SIR report (by Mahathir admin) which tried to back-track on pijacking to exonerate pilot
So there has been some progress on trying to get information that Malaysia has been sitting on, due to Malaysia’s lack of good faith efforts on MH370 post-Razak. Current Malaysian politics are a unsteady but potentially less obstructive re: MH370 post-Mahathir.
@TBill.
The search outcome (null result) is new data.
UGIB estimate of Allen variance (expecting 2Hz drift per hour) is new insight – or at least a quantification of what @DennisW has have been banging on about. The important consequence of this is that, IMHO, BFO should be entirely disregarded for the purpose of path probability determination.
I think we also have new/better insight on drift – particularly as a result of the serial D Griffin papers. But to my interpretation, the take home here is that the aircraft more likely ended in a portion of the arc with ocean surface current anomaly (westerly flow) based on non-find of debris in Australia as a hard data point. Dr Griffin is also clear that the debris arrival pattern on western IO shores is essentially useless for distinguishing latitude.
I recall that Dr B mentioned that new analysis of the Griffin dataset has provided even greater precision and confidence [on terminus latitude] than before. That seems to conflict with Griffin’s own commentary so I’m still awaiting the new DrB secondary analysis with interest.
Re BFO comment above – entirely disregarded except that a) 1840 certainly signifies southerly course, unless their was coincidental altitude change going on; b) 001929-001937 signifies steep descent, from which recovery is (a priori) highly improbable.
*there
@paul smithson
Yes. We have no data from which latitude can be derived. That is why I think it makes the most sense to continue the search Northward to at least 20S while maintaining the same search width. (Based on the terminal BFO values.)
The Godfrey drift analytics are very good IMO, and suggest latitudes above 20S are unlikely.
@DennisW. Why north and not south? BFO does not preclude it. Drift does not preclude it. 1840 BFO supports it. The only major challenge is fuel feasibility and even that is surmountable.
@paul smithson
South cannot be eliminated. I agree with that conlcusion. As you say, the 1840 BFO strongly indicates a Southern path.
Fuel feasibility is an issue, and perhaps it can be overcome. I prefer a Northern search continuation based on the weak supposition that the PIC was not suicidal, and wanted to keep the Cocos as a last resort option.
@DennisW. I’m not sure why you feel that Godfrey’s drift analysis supports 20S. Can you expand on what you find persuasive? His analysis was based on fairly crude (granularity) mean ocean surface current. Not a current/wind model of conditions prevailing during the period in question.
@paul smithson
The Godfrey analytics do not support 20S as anything but a Northern upper bound. Drift analytics (and fuel consumption) are not something I have personally tried to analyze. I regard both as having questionable value except as constraints not as terminal location specifiers.
The UGIB paper depended strongly on an interpretation of the Griffin data that precluded an azimuth greater than 186, but DrB, I recall, intended to analyze some new data from Griffin that might modify that conclusion. I have not seen the results as yet.
As for fuel, I believe that DrB has acknowledged that paths exist at, for example, 186TT and 41kft that will reach the 7th arc.
I have been making desultory efforts to redo my analysis for turns earlier than 18:40 to see if azimuths greater than 186 are plausible using the set of constraints:
turn at or before 18:40, FL 41kft, LRC and TT (rhumb line).
I continue to feel that the path until the FMT was by waypoint navigation, but now realize that continuing to a waypoint at ISBIX results in a discontinuity and the balance of the evidence is that it would default to a CMH path, which I understand does not fit. That is, a GCP after 18:40 is unlikely.
With respect to those advocating a much more northerly route, the number of assumptions regarding pilot actions necessary makes the range of outcomes so diverse as to discourage any additional search. So, it is not that it is totally out of the question, but that the resultant search proposal would be so poorly supported by objective evidence that a new search would no be undertaken.
There is still more jawboning and computation to do, as well as the reduction in uncertainty regarding some of the reported observations resulting from data obtained by Don T and others.
Finally, while there is merit in the comment that the BFO data is less sensitive to path and that there are diurnal components that may not be compensated fully, the BFO data is important in that many paths are precluded by the BFO data, thus reducing the solution space. In particular, the data at 18:40, which has never itself been doubted, partitions the solutions into two likely scenarios: one in which the path is likely all at high altitude, and the other requiring some sort of descent in progress at 1840 (e.g. UGIB)
I am dashing this off between bouts of actual work, so forgive any inadvertent gaffs. They are entirely unintentional….
@sid, there is ample opportunity for excellent BTO path-fit from earlier turns. In fact the earlier turns have better BTOR RMS (<19) than later ones. I have previously provided examples with initial bearing 190-191. TT and great circle offer good BTO fit, the former terminating further north. To terminate on 7th arc beyond the limit of the searched area (39.5S) you need initial bearing 190.4 or greater. A turn with 15 degree AOB starting at 1830 and ending 1833 will get you onto a trajectory in that vicinity. Speed required is M0.84 at FL340. With mainstream fuel and end-of-flight assumptions, there's nowhere near enought fuel to get you to 7th arc. Fuel exhaustion is predicted somewhere around 23:45.
@PaulS
Not to be argumentative, but to highlight philosophical difference, BFO is about the only thing I look at for path. Of course BTO has to be met reasonably well as a prerequisite. I agree wholeheartedly that BFO drift is the key question, and my feeling is that drift points to 30-32_S Arc7 crossing. I am willing to submit to Inmarsat expert opinion on that issue.
As far as paths to 38-39_S which have excellent BFO fits to Arc5, I currently see that as a false fit due to BFO drift. I also think probably there was an active pilot, and also feel the home simulator data probably points to 30-32_S, and DrP drift opinion is 32_S. I also submit 180_S derivative (either Magnetic or True) with active pilot possibly brackets the search. But that is still a humongous search area if worst case scenario of residual fuel remaining at Arc7 and long glide, and much of the search area may be unsearchable, which means we are hosed, or we have to search the edges BR for quite some distance.
I can see 20_S if there was a course change, but that contradicts drift and home sim studies.
@paul smithson
I believe I understand you points. The solution depends highly on the the underlying modeling constraints. While the “best” fit may occur at a GCP and FMT 18:40, this may be modified when flying TT rather than GCP. Also, the consideration of fuel consumption can be imposed by requiring the path to be on the 6th arc at 00:11. I did not do this as strongly in my studies of years ago.This is a very important constraint based on a BTO data point that has never been disputed.
I will try and re-do my analysis by this weekend.
@TBill
As a BFO maven, you know that I have a much different view of the “BFO drift” than UGIB and @airsealandman. There is no doubt that it is real, but it has a deterministic character in that I believe it is related to satellite temperature variations. This has been thoroughly debated in this forum and I do not wish to raise it again.
The BTO data is sound and the type of error in the BFO data is not sufficient to invalidate the result: PROVIDING that one adopts the stance that the path flown was a “simple” one.
“to highlight philosophical difference, BFO is about the only thing I look at for path. Of course BTO has to be met reasonably well as a prerequisite.”
That certainly is a philosophical difference between us! I have a high level of distrust of the BFO at finer-scale (a few Hz) while trusting it at next higher order of magnitude.
@Sid Bennett said: There is no doubt that it is real, but it has a deterministic character in that I believe it is related to satellite temperature variations. This has been thoroughly debated in this forum and I do not wish to raise it again.
There is nothing to debate. Because the frequency deviation of the reference signal from Burum as received at Perth was measured, we can separate out the combined effect of satellite oscillator drift and EAFC without needing the details of either. As this term is included in the BFO formulation, it has zero effect on path reconstructions.
I understand some of the doubts about usefulness of BFO for LEP restriction based on fig. 45 of the “UGIB” paper. If I interpret the graphs correctly, one could easily get a frequency shift of about 2 Hz for an 1 hour interval and of about 4 – 5 Hz for a 3 hour interval due to oscillator drift.
What I see in my calculations is that for a straight path (CTT 180 deg) and typical cruise conditions (LRC, FL 350) the calculated D (compensated Doppler) vs. expected D (polynomial fit to the data measured based on FFB = 150 Hz) matches very well for the last 2 -3 hours of the flight, in particular if I choose the initial (19:41) position such as to minimize BTO errors:
https://www.dropbox.com/s/klikxp13sfk49l2/LRC%20FL350%20CTT180%20deg.pdf?dl=0
We have seen this before for FL390 and constant M=0.84:
https://mh370.radiantphysics.com/2020/03/09/new-report-released-for-mh370-search/#comment-28510
I think it is important to take a closer look at all of this before throwing out the BFO data completely.
@Niels
I don’t think anyone is suggesting “tossing the BFO data out”. It should simply not be used aggressivey as a path constraint. Its value in determining the path was South, and concluded with a rapid descent is quite useful.
I mentioned the other day that even the “fuel problem” for far south paths might be overcome. Allow me to posit for your expert critique an alternative scenario to the mainstream for fuel endurance and end-of-flight assumptions. I’d be interested to hear if you think it is feasible.
Sequence of events: R engine flameout, APU turned on (by pilot) per SOP. L engine goes to max thrust until it also flames out some ?8 minutes later. APU still running, A/P still engaged and remains so until APU runs out of fuel and SDU drops offline. APU fuel line is re-filled (DC fuel pump) by further small amount of residual “inaccessible” fuel that is picked up as aircraft attitude progressively abnormal (pitch up). APU re-start (whether auto-restart or manual) brings about the SDU power-up and the final logon.
There are several details of this scenario that I would like to clarify further. But in principle, is it feasible? If 30lbs residual fuel acessible to APU at normal flight attitude (per Boeing/ATSB) plus another 15lbs in the line (30.5m length, 1.5cm inner diameter for 2.5cm/1 inch outer diameter) that gives you runtime of 20:44 at published APU fuel flow rate (loaded).
Under the scenario described, that APU runtime would push back your second (L) flame-out to around 23:58 and first (R) flame out to 23:50.
A/P control after loss of both engines gives you straight and controlled flight that gets you from Arc6 to Arc7 at reasonable speed (albeit slowing) and with a little extra BTO gained through loss of altitude.
Final loss of control consistent with final BFOs occurs very quickly after APU goes down because aircraft has already slowed down so much and is closer to loss of control. More consistent with the final BFO/extreme descent timing in relation to power-cycle timing than mainstream end of flight assumptions.
Initial speed/altitude in my scenario is M0.84/FL340.
I was rereading Ashton et al. and it is not fully clear to me how they deal with satellite temperature effects. They suggest that by combining figs. 10 and 11 it is properly taken care of. Which would imply that all temperature influences are contained in fig. 11. However, if I compare figs. 11 and 12 I don’t see how that’s the case. So why do we only see part of the eclipse effect back in fig. 11, and what about some of the other large frequency variations we see in fig.12 ?
@PaulS
On your scenario, not sure if the active pilot could restart the APU after it went out. However, even in the base case fuel exhaustion scenario (A/P goes off first then APU auto-start) we do not have a definitive explanation for a steep descent developing passively (normally expecting a gentler circling descent). You are keeping A/P on which will allow aircraft to trim to level straight flight…that is the long glide scenario unless active pilot decided to dive into the water intentionally.
If we have an active pilot at the end of the flight, then we do not really need to invoke a passive reason that SATCOM rebooted. Maybe the pilot was fiddling with the L/R bus power settings at Arc7. Also if active, the pilot is not stuck up at FL350, he could descend and slow down at Arc5, saving some fuel, although that would cause the Arc7 crossing point to move a little easterly. There could also be more fuel if the pilot had different power settings than the base case assumptions (eg; if power/A/P is off at IGARI indicating manual flight for some unknown period).
@DrB/VictorI/Richard
Would you have a table or graph with the dF_AFC+dF_sat values that you used to obtain fig. 43 in your paper? For example a value at each whole hour would be enough for me to do some further analysis.
@Niels
Here is my attempt to use the Inmarsat data. See:
https://www.dropbox.com/s/r6116cju52lfo3g/research%20note%20feb20.pdf?dl=0
@VictorI et al. assert that this effect is compensated by the pilot frequency measurement. But I do not know where that data is published. I am not sure of the details of the data processing at the Inmarsat ground station, so I have stopped pressing the point.
As you will see, my analysis accurately represents the eclipse effect. At other times of day (much earlier) it exhibits a substantial temperature dependency, and an inferred secular drift of about 0.1deg/Hr.
When I use the BFO data in path analysis it is normalized by an estimate of the random component of measurement (2Hz) and the BTO is similarly normalized. The BFO data is less sensitive to path, but nevertheless is consistent with the BTO analysis.
We are stuck in a rut.
I have tried (recently) to test other hypotheses that I did not have the motivation to test before. Right now I am running the analysis from 18:25 with LRC at 41kft along 295T and various turn times from about 18:31 to 18:42. The objective is to determine the azimuth of a TT after a FMT to minimize the path error rss(BTOR^2+ BFOR^2).
It includes paths similar to my previous papers, but I an trying to determine the bounds on turn time and azimuth.
I have not addressed the BFO in some time and do it today reluctantly. But every time discarding the BFO comes up I put my two cents in.
Niels,
The Ashton et al. paper gives a muddled explanation of the BFO calculation, and that is a reflection of the fact that Inmarsat went through three different models of the BFO calculation between March and June of 2014. The paper sort of documents the various detours it went through before arriving at the so-called Unified Model. Along the way, it was distributing spreadsheets with various quantities calculated (equivalent to Table 9) to other members of the JIT, and probably to maintain backward compatibility as it switched models, it kept certain columns (such as the downlink Doppler) in the spreadsheet, even though they were superfluous in the Unified model.
Here is how the Unifed model works. Take the measured BFO. Subtract Figure 11. Add L_Dop from Figure 10. That’s it. This quantity is the aircraft Doppler compensation error plus the uplink L-band Doppler from the aircraft to the satellite. No more eclipse effect. No more drift in the satellite oscillator. No more downlink Doppler from the satellite to the ground station.
Figures 12 and 13 are interesting for understanding the details of the effect of temperature drift in the satellite on translation frequency and were incorporated in the prior “Eclipse 2 model”, but they are not used in the Unified model.
The above explanation comes from my distillation of information in the Ashton et al paper, the October 8, 2014 ATSB update report, the Oct 3, 2017 ATSB final report, and technical memos 25T020 and 25T023 from Miteq on the operation of the EAFC receiver used to monitor the pilot signal.
@sk999
Thanks for that! Somehow the -150 Hz bias frequency should still get into the equation, for the rest I think I get it.
Would you perhaps have a tabelized version of fig. 11 to share?
Regarding fig 12: it should not be too difficult to combine it with Doppler calculations to reproduce fig. 11. Not sure if that really gives us something though, as it might be the reverse process of how fig. 12 was actually derived..
@Sid Bennett
Fig. 11 of the Ashton paper combines info on different sat – GES Doppler components as well as sat. temperature effects.
Niels,
Yes, a bias offset is also needed. Here is a link to a tabular version of fig 11:
https://drive.google.com/file/d/0B7YQpAH4JIN5LTdHeWpDTGNSZXM/view
@sk999
Great, many thanks!
@TBill. Thanks for the response. The reason for positing this scenario is to find a way to reconcile:
– a second engine flame-out well before 00:00
– uninterrupted power supply to 00:11
– getting to the 7th arc
– power interruption to trigger the final logon
I calculate the expected run-time of the APU at ~22 minutes after the second engine goes down through a combination of the 30+ lbs of residual [tank] fuel plus 8kg of fuel in the line.
That certainly solves the requirement of uninterrupted power supply to 00:11 and A/P and hydraulics would be available throughout the unpowered glide to 00:18
Final logon could then only be explained by an APU re-start. The APU DC pump supplies fuel at 0.4kg per second so takes 20s to fill the line when fuel becomes accessible. Loss of AC power to busses should prompt auto-start but if fuel not available immediately I don’t know if the autostart routine would work with a delay in fuel availability. If not, you’d have to invoke pilot action for final APU start.
@Paul Smithson. First, about your 20:44, that being the duration that the 30 lbs of tank residual fuel (plus that in its fuel line) could power the APU after left engine failure, the ATSB in their Definition of Underwater Search Areas has put it that in a standard flight attitude of 1° pitch, “…. the APU had a maximum operating time of approximately 13 minutes and 45 seconds”.
From the 30 lbs ‘maximum’ at that pitch (which in fact includes the fuel in the line) one needs to subtract any parallel use of this during left engine relight attempts, that being supplied also by the APU DC fuel pump. As to the extent of this the ATSB comment is that when taken into account there would be enough fuel remaining still for “at least the required 2 minutes” needed for the APU to power the SDU reboot.
So from that account there would be enough for an APU run of between 2 mins and 13:45.
Also needing subtraction or addition would be any unavailable should the aircraft not remain at that pitch with the APU running. However I think it reasonable to assume that that 1° would be what they expect the aircraft to hold shortly after left engine failure.
It does not follow necessarily that the pitch increase that you expect would result in more fuel being available for a later APU restart, as you surmise. It could be less; the suction point for the APU DC fuel pump is not at the rear of the tank. Besides even were some available, how would this be sensed when it is beneath the point of measurement?
Supposing that a restart would be feasible nevertheless, you raise the issue as to whether that would require a pilot. While the spur for an auto-start would be the transfer buses remaining unpowered, I think the APU’s shut down would have been the result of speed droop at its fuel exhaustion; and thus termed “protective”. To “unlatch” that requires the APU to be selected to OFF. I imagine this would be required before it would restart, i.e. a pilot would be needed.
Even were this supposition wrong, an auto-start would be without autopilot, that having disengaged at APU shut-down commencement. While the APU was shutting down the aircraft attitude could vary, the accessibility of fuel being prejudiced thereby. That risk would be exacerbated during the 2 mins needed for a start and SDU reboot.
One final risk is that the APU pipeline might require re-priming before the APU would restart, having been emptied.
In summary, it is likely that a pilot would be required to restart the APU for the SDU reboot and that it is very possible that there would be no fuel for this; and even if available, he would be unaware of it.
But why would he want to do that anyway?
Some time back I postulated a powered descent, exchanging height for a powered range extension (like @TBill has mentioned), the difficulty being to reconcile the extended route, shifted towards the west, with the 7th arc time constraint.
I envisaged a dive from low altitude would explain the final transmissions.
In case that is of any use……
@paul smithson
Assuming I understand the scenario correctly, I don’t believe an APU re-start would be possible, because there would be no ‘residual’ fuel remaining. If the APU were already running at left engine flame-out, the APU dc fuel pump would automatically operate when the left main tank fuel was exhausted and pressure in the left engine feed manifold dropped. The APU would continue running using the ‘residual’ fuel until that was also exhausted, at which point the APU would fail and AC electrical power would be lost. The loss of power would cause the ELMS to signal an APU auto-start, but with no fuel available the auto-start would not be successful.
@David. Thanks for your thoughtful responses.
I agree that the terminology fuel “available to the APU” is ambiguous and, in principle, ought to include the fuel in the line. However, please refer to the wording in ATSB (Dec.2015) page 8 “In a standard flight attitude
(1° pitch), the difference in location between the left engine fuel inlet and the APU fuel inlet would result in approximately 30 lb of fuel being available to the APU after a left engine fuel exhaustion.” This implies fuel quantity available purely on the basis of differeces in inlet position, so must be referring to fuel in the tank.
On page 10 in the summary, instead of saying fuel “available to the APU” the wording is “a small amount of fuel (30lbs) is available to the APU fuel inlet”. This seems pretty unambiguous – it is referring to fuel in the tank. There is no mention of fuel in the line and no indication that this has been included in the 30lbs.
Your point about the suction point not being right at the back of the wing is noted. I have never seen a side elevation diagram of the tank so it is difficult to discern what effect pitch changes may have on that point being covered/uncovered. As the DC pump is designed to be able to run dry, I didn’t understand your point about fuel being sensed below the point of measurement. Does fuel need to be sensed in order to be sucked up by DC pump?
It is clear from earlier discussions that a re-light on left engine would abruptly consume any fuel that the APU DC pump had succeeded in picking up. This is a killer risk for the conventional end of flight scenario as well as my alternative scenario. So the presumption in both cases is that a relight didn’t happen.
Thanks for your commentary regarding feasibility (not) of auto-restart of the APU. Why wouldn’t a pilot try re-starting the APU if, until this point, he has been running on fuel that was beyond “zero fuel” measurement? He has just lost his autopilot, his hydraulics and most of his electrics and RAT has not yet deployed. Would you not give it a try? Is there a procedure for this scenario or are we in the realms of guesswork?
Re fuel system and relative positions of intakes, I found this schematic clearer and easier to interpret than the facsimile drawings of the fuel system. https://pbs.twimg.com/media/DCcttwbVwAAzxnH?format=jpg&name=900×900
@Andrew. Thanks for the response. Yes, my assumption is that APU would run until residual fuel was exhausted and I have estimated this time at 22mins based on tank residual fuel plus fuel in line. The only way the APU could have fuel to re-start is if the DC pump inlet had uncovered and subsequently re-covered due to pitch changes. 8kg fuel is required to fill the line and 1.5kg consumed during 90 seconds of APU operation. So it is not a very large amount of additional residual fuel that is required. The DC pump is rated at 0.4kg per second, so it also doesn’t take long to re-fill the line. No “prime” of the line is required because we are pushing not pulling and the DC pump itself is run-dry/self-priming.
Two further questions, if I may:
Can you clarify for me what condition it is that triggers the start of the APU’s DC fuel pump?
I still don’t understand why L engine doesn’t consume all of the “residual fuel” in any scenario if the main fuel supply is interconnected with the APU supply and the engine can run on suction feed. Under the conventional end of flight scenario, why doesn’t the L engine consume that residual fuel before flaming out? Because it can’t suction feed through the DC pump?
On the last point, I note this text on the specification description of the DC pump: “It provides fuel supply to the APU during start-up, utilising either a ground based DC supply or an aircraft battery supply. In the event of an in-flight engine flameout the pump has sufficient capacity to provide fuel to relight the main engine.”
https://www.eaton.com/ecm/idcplg?IdcService=GET_FILE&allowInterrupt=1&RevisionSelectionMethod=LatestReleased&noSaveAs=0&Rendition=Primary&dDocName=CT_196103
That further calls into question the issue of 30lbs residual fuel available to the APU but not to the L engine.
@paul smithson
RE: “The only way the APU could have fuel to re-start is if the DC pump inlet had uncovered and subsequently re-covered due to pitch changes.”
Ok, but if the APU is operating and AC power is available, the AP should remain engaged and the pitch should be stable, though slowly increasing as the aircraft’s speed decays.
RE: “Can you clarify for me what condition it is that triggers the start of the APU’s DC fuel pump?”
1. The APU DC fuel pump operates automatically when the APU selector is in the ON position and there is no pressure in the left engine feed manifold.
2. The APU DC fuel pump also operates automatically in the event of an APU autostart signal from the ELMS. The ELMS signals an autostart if the aircraft is airborne and AC power is lost from the left and right transfer buses.
RE: “I still don’t understand why L engine doesn’t consume all of the “residual fuel” in any scenario if the main fuel supply is interconnected with the APU supply and the engine can run on suction feed. Under the conventional end of flight scenario, why doesn’t the L engine consume that residual fuel before flaming out? Because it can’t suction feed through the DC pump?”
If the engine is running normally, it is isolated from the APU DC fuel pump supply (ie the ‘residual’ fuel) by the APU isolation check valve and the APU isolation valve. The residual fuel only becomes available after the left engine flames out, at which time the APU isolation valve opens in an attempt to restore fuel supply to the engine via the APU DC fuel pump.
@paul smithson
The APU isolation valve is not shown in the schematic you posted earlier. It can be seen in the following diagram:
https://www.avsoft.com/wp-content/uploads/2018/02/SSD-B777-2.jpg
@Andrew. “Ok, but if the APU is operating and AC power is available, the AP should remain engaged and the pitch should be stable, though slowly increasing as the aircraft’s speed decays.”
In the Boeing simulations “conventional” Cases 1,2,3,4,6,7,9 the A/P is engaged when the aircraft approaches stick-shaker and descent commences. In each instance, there is a pronounced “trip-up” and ROD goes abruptly from 0 to >4000fpm then back again to zero before settling into either stead ROD or phugoid (depending on whether second engine has already gone down).
That “trip-up” would surely imply quite marked, transient changes in pitch? In the FL350 cases it occurs at 260kt so I’m guessing that at FL340 it would occur around 250kt.
@Paul Smithson. About your, “I agree that the terminology fuel “available to the APU” is ambiguous and, in principle, ought to include the fuel in the line.”
Yes I wrote to the ATSB in early 2017 with various queries. Their answers, which I posted that March, included, “The most likely scenario is that the remaining fuel, which includes from the tanks and the lines, would have allowed the APU to be started …….”
Re, “Your point about the suction point not being right at the back of the wing is noted. I have never seen a side elevation diagram of the tank….” The diagrammatic position of the APU DC pump inlet is shown here:
https://www.dropbox.com/s/l8jzy1a8pqzy6fy/777%20fuel%20system%20components.pdf?dl=0
“I didn’t understand your point about fuel being sensed below the point of measurement.” When the fuel levels in the left tank reads zero there is residual fuel in it still. Since neither it or any remnant of it are sensed the aircraft systems and pilots do not know it is there or how much and of course the quantity of that available to the APU DC fuel pump varies with aircraft attitude anyway.
“Does fuel need to be sensed in order to be sucked up by DC pump?”. No, although the pump’s delivery pressure is monitored.
@Andrew, David
Thanks both for the schematic and diagram showing the APU isolation valve and check valve. In light of the elaboration on conditions required for DC pump start and isolation valve to open, it seems to me it is equally mysterious under conventional end of flight scenario or mine why a L relight did not occur and consume residual fuel that was presumed to have been accessed by the DC pump.
One possibility is that the L engine was shut down to prevent re-light. Or even shut down before fuel exhaustion if the intent was to preserve minimal fuel for APU operation during the final descent (1 min FF for single engine inop @100 kg/min equivalent 100 mins APU operating time @1kg/min).
David, thanks for sharing/highlighting the information from correspodence with ATSB that acknowledges fuel in line as well as in the tank as the basis for APU to supply powre for final logon.
@PaulS
Several options to fix your scenario, one option pilot was active and was managing fuel for his end flight scenario. There was enough fuel for APU. Pilot was manipulating controls (descent and elec panel) and either inadvertently or intentionally toggled power to the LEFT BUS.
Another other option is that there was actually more fuel due to active pilot decisions such as descent before Arc6/7, alternate power configs.
The way I try to look at it, what is the worst case scenario? How far could an active pilot have gone in theory, maximizing fuel savings and glide, and assuming the Arc7 SATCOM reboot was not complete end of fuel supply? I am actually planning to try to estimate that scenario, but 187_S heading is not currently my preferred direction of flight.
@sk999, @Niels
This is a link to a similar digitization of Fig.11 that I used in my BFO offset studies, which I compare with an analytic model (I think due to @VictorI) but whose parameters are adjusted for a best fit. Note that the time scales are correct but that the physical comparison of the two plots needs care. But it is all in the tabulation.
https://www.dropbox.com/s/lcbosy7jtims0ur/pilot%20freq%20comparison%20with%20model.xlsx?dl=0
Note that the eclipse effect is clearly shown as well as temperature effects earlier in the UT day that result in a slight distortion of the sinusoidal character of the expected pilot frequency.
@sk999
Thank you for comments on the “Unified” model. I need to go back and read (again…) the MITEQ manuals. There are sufficient loose ends for my mind to boggle.
The various models you reference are not published except by reference in the final report so we don’t know exactly what the optimization criteria were. My guess is that the effort focused on the flight period only and this is dominated by the eclipse effect.
My understanding of the “compensation” process in the MITEQ is that it is done post facto using the digitized frequency values and adjusted by a scaling coefficient.
The important point is that they are “models”: an attempt to represent physical processes by analytic representations, leaving a residual to be explained. That the temperature of the satellite and its effect on the translation oscillator “explains” the effect seen in Fig. 11 confirms that it is a deterministic effect of the temperature. In the particular case of MH370, that temperature data was published.
@Paul Smithson. Your, “….it is equally mysterious under conventional end of flight scenario or mine why a L relight did not occur and consume residual fuel that was presumed to have been accessed by the DC pump.”
If the left engine consumed all in the tank it is broadly accepted that there would be enough in the APU’s line for it to draw through (the DC pump having lost suction) and reboot the SDU for at least 2 min and, I expect, the 2 min 8 secs needed for both transmissions.
The same would apply if during the currently accepted APU auto-start sequence following engine failure, with the aircraft in steep accelerating descent evident from the final SDU transmissions, the residual fuel sloshed away and bared the DC pump suction point.
(I have speculated at length about the possibility of vapour lock preventing that if at high altitude, thereby managing to persuade myself.)
As to the left engine consuming all the fuel, @Andrew has covered that in a comprehensive paper.
To save you asking him for a copy:
https://www.dropbox.com/s/fi0jm64h0t969eo/MH370%20ENG_APU_Start%20%282%29.pdf?dl=0
@Paul Smithson. My second para, second line should read, “for it to draw through (the DC pump having lost suction), auto-starting then rebooting the SDU, taking 2 min and, I expect, another 8 secs needed for the second transmission.”
@paulsmithson
RE: ‘In the Boeing simulations “conventional” Cases 1,2,3,4,6,7,9 the A/P is engaged when the aircraft approaches stick-shaker and descent commences. In each instance, there is a pronounced “trip-up” and ROD goes abruptly from 0 to >4000fpm then back again to zero before settling into either stead ROD or phugoid (depending on whether second engine has already gone down).
That “trip-up” would surely imply quite marked, transient changes in pitch?…’
I’m not sure what you mean by ‘trip-up’, but it only takes a relatively small attitude change (5° or so) to cause a large change in the rate of descent. If AC power is available and the autopilot remains engaged, the aircraft initially maintains altitude as it decelerates due to the loss of engine thrust, and the pitch attitude slowly increases as the speed reduces. Approaching stick-shaker speed, the autopilot envelope protection lowers the nose to prevent the aircraft stalling and the aircraft starts to descend. The rate of descent initially fluctuates as the AP stabilises the aircraft just above the stick-shaker speed, but the attitude changes are fairly small. If AC power is lost and the AP disengages, all bets are off and the attitude changes can be quite extreme, depending on a host of factors.
Sid Bennett,
The Miteq technical notes are, unfortunately, about as muddled as the Ashton et al. article. However, for the BFO calculation, most of the information in them is irrelevant.
What is relevant? In note 25T020, Figure 8, the key feature to note is that, once the pilot signal (labeled A) and the aircraft terminal signal (labeled C) reach the satellite antenna, both go through the identical signal chain (labeled D, B [C Band Down Converter], and B [Demodulators]) before being digitized. [Victor has been telling you this for ages.] The digitized output of the pilot signal is Figure 11 of Ashton et al. (One can think of that as being the “BFO” of the pilot signal.) The digitized output of the aircraft terminal signal is the BFO of the aircraft signal. Whatever crud is introduced along the way (such as variations in the satellite oscillator frequency or downlink Doppler) is common to both the pilot and aircraft signals. What if you subtract the digitized “BFO” of the pilot signal from the aircraft BFO? All the crud is removed. The only remaining issue is that you have also subtracted off the uplink L band signal of the pilot signal (Burum to the satellite), which is not present in the aircraft signal. So you have to add that back in (Fig. 10, L_Dop). At that point, “Bob’s your uncle.” That is the essence of the Unified model.
The Eclipse 2 model tried to model all the individual components of the “crud”. That was a valiant effort, but in the end was completely unnecessary other than to make sure that you understand how your system works.
Ashton et al. tried to shoe-horn in a presentation of the Unified model into the framework of the Eclipse 2 model, which was completely unnecessary and led to huge confusion on the part of you (and me). In my opinion, the authors should be flogged. Or at least be forced to rewrite the paper to make it more comprehensible.
@sk999
Yes, we (you and I) have been over these BFO issues in detail. The reality is none of that is relevant. The bias drift in the aircraft oscillator can never be quantified. BFO cannot be used as an aggressive path constraint. What is the point?
DennisW
Niels and Sid Bennett are just trying to figure out how the BFO calculation is done in the first place. That is a purely algorithmic issue. My comments to them are 100% relevant to, say, calculating the BFO of MH371 on its flight from Beijing to Kuala Lumpur on the morning Of March 7, 2014.
The question of whether the BFO can be use to determine the final location of MH370 is its own topic, and totally separate from the algorithmic issues.
@David, Andrew, thank you for the excellent paper that I had not seen before. I shall read and digest carefully before commenting further.
@sk999, DennisW
Previously I was using D = dFup + dFcomp = BFO – dFbias – dFdown – (dFsat + dFafc) based on table 9 (Ashton et al.)
I now tried D = BFO – dFpilot + dFup_Burum – dFBias
Where the dFpilot comes from fig. 11 (Ashton et al). Potentially, this is slightly more accurate because adding fewer potential rounding errors. The differences turn out to be minute (max. 1 Hz at all “ping” times).
The discussion about what can be done and what cannot be done with BFO is indeed a different one; for me this is still not a closed discussion as it is for some here. In the “UGIB” paper an effort is done to quantify the potential oscillator drift. I’m trying to check this, as well as looking into the consequences for some of my approaches involving BFO.
@sk999, DennisW
Previously I was using D = dFup + dFcomp = BFO – dFbias – dFdown – (dFsat + dFafc) based on table 9 (Ashton et al.)
I now tried D = BFO – dFpilot + dFup_Burum – dFBias
Where the dFpilot comes from fig. 11 (Ashton et al).
Potentially, this is slightly more accurate because adding fewer potential rounding errors. The differences turn out to be minute (max. 1 Hz at all “ping” times).
The discussion about what can be done and what cannot be done with BFO is indeed a different one; for me this is still not a closed discussion as it is for some here. In the “UGIB” paper an effort is made to quantify the potential oscillator drift. I’m trying to check this, as well as look into the consequences for some of my approaches that involve BFO.
@sk999
Yes, your last post is spot on.
@all
The algorithm, while important, is dwarfed by the physics. Oscillator drift is neither stationary nor ergodic. Stationarity being the property that the process stats (mean, variance,…) do not change over time. Ergodicity being the property that stats of a group of measurements (an ensemble) are the same as the stats of a single measurement taken for an equivalent period of time.
The stats obtained from 7 one hour runs will all be different, and very different from the stats of a single seven hour run. BFO data can only be used safely for concluding a Southern path and a rapid terminal descent.
@David. RE “If the left engine consumed all in the tank it is broadly accepted that there would be enough in the APU’s line for it to draw through (the DC pump having lost suction) and reboot the SDU for at least 2 min and, I expect, the 2 min 8 secs needed for both transmissions.The same would apply if during the currently accepted APU auto-start sequence following engine failure, with the aircraft in steep accelerating descent evident from the final SDU transmissions, the residual fuel sloshed away and bared the DC pump suction point”
The APU line is quite a large internal diameter (about 16mm). As you will know from breaking a syphon on a hosepipe, that column of fuel drains out pretty easily if the supply end comes uncovered no matter how good the suck. I’m therefore doubtful that fuel in the line could be ‘drawn by the APU’ unless it was a downhill run – as it would be from wingtank to tail with pitch-up. Once you pitch down, I’d expect that supply to be broken, leaving only the fuel that is in the filter/lift pump on the APU that has already been captured. Is that a fair analogy? In which case pitch-down could be the precipitating factor for APU fuel-exhaustion and the incomplete logon.
@sk999
I am glad that you are troubled by the Inmarsat paper and the lack of clarity in the MITEQ manuals.
Do you agree that the BFO data in Sladen’s github listing is uncorrected for the translation oscillator drift?
I must have some mental block that prevents me from communicating my thoughts properly.
I believe that both “models” yield essentially the same result for MH370 IF the pilot tone of Fig. 11 is used to digitally correct the measured BFO. But I do not know for sure how it has been used in the analysis of the other test flights.
The point I wish to make is that it is clear that the correction using the pilot tone is directly related to the temperature of the satellite. The offset of +5Hz to -2Hz during the period leading up to the flight is real and is not due to the aircraft oscillator drift. Such variations would be expected on other days and unless we have the pilot tone data or temperature of the satellite, we cannot be sure if an error is due to the translation oscillator or the aircraft oscillator.
Moreover, by separating out the satellite motion component and the temperature component, we seem to find that there is a secular drift of about 0.1deg/h in the translation oscillator.
I can’t recall whether anyone has determined or found the Allan variance for the aircraft oscillator. I mean a direct measurement of the same or similar oscillator under controlled conditions. This cannot be determined by any measurement that involves the satcom system.
The Allan variance of an oscillator cannot be determined by a small number of unequally spaced data points.
I suppose no one has actually looked at the data and paper I posted recently.
While my path simulations show that, when normalized the the expected standard deviation of the measurement (say 2.0Hz), the BFOR is not as acutely sensitive to path azimuth in the region being discussed, but the computed cost value varies in a manner that is consistent with the BTO data for the same trial path. I have done the computation of paths as a function of turn time along the 295T azimuth and trying to present the results in a coherent form. Give me a little more time…
@Sid said: Such variations would be expected on other days and unless we have the pilot tone data or temperature of the satellite, we cannot be sure if an error is due to the translation oscillator or the aircraft oscillator.
I would be amazed if Inmarsat used a different technique, i.e., did not use the recorded pilot error, to calculate the BFO components for the other test flights. If the pilot error was not used, the reported BFO statistics for the test flights would be meaningless. Why would there be more data available for MH370 than any other flight that occurred in the same time frame?
@VictorI
from the ATSB appendix g
Perth GES Frequency Compensation: calculated by comparing calculated pilot signal Doppler variation (known frequency, location and satellite velocity/location) with its variation after Perth GES frequency compensation applied.” The mind boggles.
Reading this appendix “carefully” it seems that the correction was “scaled” from the curves. This means it was not applied in real time and was not reflected in the satcom tabulated data.
The same data was used for a “calibration flight” MH 0093 on the previous day and matched within 3Hz peak. That’s darn good. But its not clear that all of this effort was made for the other flights.
Since my model and the Unified model do not seem to differ greatly due the flight time, it is of no matter with respect to the MH370 case which
I use.
I am still looking for an Allan variance plot of a typical satcom oscillator….
Enough blathering unless someone has copies of the internal documents….
Sid Bennett,
You state: “I am glad that you are troubled by the Inmarsat paper …”
I never used the word “troubled”, which implies a doubt in the validity of the paper. I do not have any such doubt. “Annoyed” would be a better word.
You then ask, “Do you agree that the BFO data in Sladen’s github listing is uncorrected for the translation oscillator drift?”
I have never looked at the BFO data on Sladen’s github and have no idea why I would do so. (ADS-B data – yes. BFO – no.) I cannot answer your question.
You then state, “I must have some mental block that prevents me from communicating my thoughts properly.”
Agreed, but irrelevant. Soldier on!
Finally, you state, “… unless we have the pilot tone data or temperature of the satellite, we cannot be sure if an error is due to the translation oscillator or the aircraft oscillator.”
By “pilot tone data” I presume you mean Fig. 11 data or equivalent. I assume that these data exist and were available to the investigation team, just not to us. What I would really like to have are the equivalent of Fig. 11 data for the POR satellite on Mar 7, 2014.
And yes, if we do not have the pilot data, then there is no way of knowing whether any BFO error is due to satellite or aircraft.
And in local news, this https://m.facebook.com/story.php?story_fbid=2024171241047124&id=189656204498646
Locals at Cape Tribulation, Queensland, Australia, seem to think that they’ve found a piece of MH370 wreckage – a trim tab from the horizontal stabilizer.
Apart from wrong ocean, not enough barnacles, wrong colour, correct me if I’m wrong but I’m pretty sure that the B777 doesn’t have a trim tab for the horizontal stabilizer. The accompanying photograph appears to be of a B737.
Apologies, I meant elevator not horizontal stabilizer.
@Mick
The fishing rod in the second photograph helps to size it.
@George G
Yes, if it is indeed an aircraft part it’s much more likely to have come from Air Niugini flight 73 which landed short in Truk Lagoon back in September 2018.
Prof. Chari said that debris would originate somewhere in the Pacific, so the theory about air Niugini is plausible.
@Paul Smithson. About your hose analogy and that emptying very quickly, this is 100 ft of comparatively small diameter pipeline. As a bubble enters the bottom it will take time to get to the top, effectively sealed by the APU, even though the continuing APU fuel consumption will reduce the fuel length it must get through. Any line sections that are downwards to it will impede its passage. The APU engine pump at the top will be pumping (as long as it is not vapour locked) and the APU kept fuelled until the bubble arrives, rather than there being just the fuel already at the pump at aircraft pitch down.
Also, in the descent evident in the final transmissions the effective fuel head will be reduced by aircraft centripetal and longitudinal acceleration, according to an analysis I posted about the possibility of vapour lock. My conclusion was that this can overcome the 1 g effect you mention of the line head increasing as the aircraft pitches down.
Another possible contributor to the head reduction is tank pressurisation.
Despite its pressure being monitored, after baring of its inlet the DC fuel pump at the bottom will be running still I believe and so flinging back the fuel that otherwise would flow from the line’s bottom end, not that that will impede the air bubble.
Related to what you raise, before the DC fuel pump runs dry there is a risk of air bubbles being entrained in fuel vortices at the tank outlet as the fuel level lowers. There is no vapour vent fitted to this particular pump.
Incidentally you describe the pipe’s internal diameter as 16mm though @Andrew has estimated it at 10mm. A line of that diameter would hold 2½ times the fuel of the 10. Would you say where that 16mm comes from?
Hi David,
On your last point, I looked up specifications of kevlar reinforced fuel hose with outer diameter of 1″. Using this supplier’s catalogue, you can see that it is the size -12 variants that have outer diameter close to 1″. The mean internal diameter for these is 17.1mm and the smallest is 15.7mm
https://www.aircrafthose.com/resources/charts-id-od (mean ID for OD of 1” is 17.1mm, minimum 15.7mm)
I also found specs for the APU DC pump that is fitted to Boeing 777 aircraft, sub-type not specified. That is where the info on rated pump flow-rate and run-dry/self-priming characteristics comes from.
https://www.eaton.com/ecm/idcplg?IdcService=GET_FILE&allowInterrupt=1&RevisionSelectionMethod=LatestReleased&noSaveAs=0&Rendition=Primary&dDocName=CT_196103
@Mick G,
A 737 elevator balance tab seems to be a match for the part found at Cape Tribulation. While the Air Niugini P2-PXE airframe may be a source, ATSB and UK-AAIB have investigated elevator tab issues on 737s. The reports provide some detail of its construction.
I do wonder if P2-PXE was salvaged or left on the bottom of the Chuuk lagoon.
Shame that Mick Elcoate didn’t capture images of both sides of the part, it’s obvious that it was flipped over before acquiring the images posted by AOPA.
As noted above, Prof Pattiaratchi has commented that an arrival on the QLD coast would infer drift from somewhere in the Pacific Ocean.
@Don Thompson
G’day Don, thank you for those references (I had not read the UK AAIB’s report on G-EZJK). And yes, based on shape, size, apparent attachment points and reported construction it looks a lot like a B737 elevator balance tab.
I suspect that PXE is still at the bottom of Chuuk Lagoon. She sank in 90-odd feet of water and that initial aft of wing hull fracture propagated all the way around the fuselage, either as she sank or when she settled on the bottom.
@Paul Smithson. Thank you for the Eaton APU DC pump and PHT fuel hose information.
While the pump model depicted may be that of a different manufacturer or variant it has the same delivery flow.
As you indicate the 777-200 APU fuel line is rubber and Kevlar but those PHT hoses include wire braiding except one with a “high tensile fiber”; but that is for low pressure air. The wire braided are suitable for hydraulic pressures though that might be overkill since the pump delivery is at 24 psi (Eaton’s a little more). But the overall wall thickness is of interest.
@David – yes, I couldn’t find a fuel hose example that sounded exactly comparable but I thought these OD/ID serve anyway as indicative of inner diameter of a 1″ line.
Still on the BFORs and OCXO drift:
@DrB
I was reading sections 7.4 and 7.5 in the 7 March 2020 paper.
In section 7.4, regarding the MH16 data, fig. 40 it is stated:
“That means that OCXO drift is detectable but does not double the BFOR noise even at four hour separation. Drift occurs but it is not overwhelming the other noise sources”
In section 7.5, based on the MH371 data, figs. 43, 45, 46 suggest that OXCO drift can start to dominate the other BFO error sources only after about 2 hour time difference.
Could you help me understand this apparent difference in the results?
@sk999
I remember you have analyzed the MH371 BFO data as well. Could you perhaps (re)share the link to the relevant paper?
Niels,
Here’s the link to the index of all my reports and tables:
https://docs.google.com/document/d/14hleZyx1pUPL44yaeHKt6jnSQ3DbgRq2zibbKkFLq2c/edit?pref=2&pli=1#
I wrote a report on the Amsterdam flight around Mar 2018 and on MH371 around June 2017.
@Niels
Could you help me understand this apparent difference in the results?
The statisitics of oscillator drift are not stationary.
@DennisW – Niels is referring to difference in results (DrB and sk999) for the same dataset (MH371).
@Paul Smithson
Both (apparent) inconsitencies would need an explanation: between the MH16 and MH371 datasets, and for MH371 the difference between sk’s and the UGIB analysis.
I’m hoping @DrB or one of the other authors can help here.
@DennisW
It appears to me that your bias has little drift
@BFO afficionados. I can’t help being struck by the qualitative similarity between the BFO residuals pattern predicted by my preferred paths (aka southern paths associated with early FMT and best BTO fit) and the “pilot frequency error” from Ashton et al fig 11 (as digitised on aqqa.org). Why/how could there be any relationship? See link for comparison.
https://tinyurl.com/yyweuvxs
@Dennis
Can you give me some examples of real world stationary process that might have some relevance to this discussion?
@Sid
Just about everything we ordinarily model has stationary statistics – rolling dice, playing cards, the distribution of height among 100 randomly sampled American males,…
@DennisW
I understood we are getting taller over the centuries.
Perhaps you are aware that the randomization of cards by shufflers in a casino is only good enough to defeat card counters in games like blackjack. It is the perception that shuffling results in no player having an advantage. The game is then played with the presumption that the deck is randomly distributed for all deals. (Of course we ignore such things as “tells” in poker or bridge….)
Radioactive decay is often said to be an example, but this is a non-sequitur as the term “decay” denotes a long term reduction on the average rate.
So everything we do is an approximation to a real-world process. The question is: Is it good enough to use to compare alternatives?
@sk999
My apologies for not replying to your post of 5 Oct. Your comments are understood and appreciated.
I particularly appreciate the mention of the POR satellite for the Japan flight (Totally overlooked it.) But the eclipse would have occurred earlier in the UT day and not within the flight time frame. Whatever the diurnal temperature variation of the translation oscillator that is still a factor.
@paul smithson: The likelihood that Inmarsat incorrectly calculated the BFO is near zero, which is what you are implying.
For completeness, I have redone my studies under the constraint that the flight is LRC TT at 41kft and that the plane is at the 6th arc at 00:11.
https://www.dropbox.com/s/evxcbj4fcqmt916/Addendum%201%209oct20.docx?dl=0
There is no significant change in the overall result, you may find some insights.
@Niels,
The statistics of the random BFO read noise are stationary. Thus they are the same for different flights. As Dennis said, the OCXO drift is not stationary, so that component of the BFO residuals will vary from flight to flight.
@DrB
That the OCXO drift varies from flight to flight is clear. The question is if you represent it in the form of fig. 40 , 45, 46 do we learn something about the characteristics of the OCXO. It seems by looking at the two “realizations” that we have at hand, and if I read your answer, the figs. 40, 45 and 46 are then rather meaningless regarding the drift component shown there. A follow-up question is, how much data should we need to get a clearer picture?
@Niels,
The figures you referenced are not “meaningless” as you suggest. They serve to confirm Inmarsat’s and DSTG’s independent findings based on their analyses of a large number of previous 9M-MRO flights. They also demonstrate the answer to your question of how much more data do we need to get a clearer picture. The answer is none. We already have three independent analyses which consistently demonstrate that the error in calculating BFOs during a typical flight duration is +/- 7 Hz.
@DrB
Then, for example, how do you explain fig. 5.4 in “Bayesian Methods…” (The “Mumbai – KL” flight data)?
To progress and make optimal use of the BFO data, in my opinion we know far too little about the OCXO frequency stability, and it would be necessary to go through the BFO data and analysis of significantly more flights than we now have available; or as Sid Bennett suggested, look for other ways to get data on the type of OCXO used.
@PaulS
I am interested in your comment, but it is not in my language. What I like to talk about is “measured actual BFO” vs. “normalized” BFO corrected back to SATCOM start-up at 1825 (to take any drift out).
So I think it looks a little like this below:
Arc/Act BFO/Norm BFO
Arc2 111 110
Arc3 141 139
Arc4 168 166
Arc5 204 201
2314 218 214
Arc6 252 248
So if you accept my adjusted numbers, I think we are talking easterly 30-32_South unless I have my +- signs mixed up.
@sk999. Can I check that I have this right regarding Figure 11 of Ashton et al.
– If there was no diurnal temperature variation, eclipse or other perturbation of the satellite oscillator;
– If the GES was located at “Perth-north” rather than “real Perth”
Then AFC ought to perfectly strip out the doppler variation in the Burum-satellite-Perth (north) chain and the error ought to be zero.
Using that fig.11 error we can strip out the satellite oscillator perturbation and the satellite-Perth compound frequency error. But if we are to apply this as a correction to the aircraft-satellite-Perth chain rather than the Burum-satellite-Perth chain, we can’t use it “as is” but have to take out the Burum-satellite element.
I didn’t see mention of removal of the Burum-satellite element in your explanation of how to use the pilot frequency error for simplified BFO calculations.
@Paul
The Doppler associated with Barum to the satellite is in the trivial and obvious category. Do you really think Ashton et.al. overlooked it or screwed it up? I did not even bother to review the paper.
@paul smithson, @DennisW: The ATSB report from June 2014 has a table showing the values for the sum of the EAFC and the satellite offset. This is the same as shown in the figure from the Ashton et al. paper, except the C-band (downlink) Doppler shift is also included in Ashton. That means the L-band (uplink) Doppler shift has already been subtracted. The data from Ashton is a bit easier to use because it’s not necessary to add back the C-band Doppler shift when calculating the BFO values for MH370.
In any event, the Doppler shift from Burum to the satellite has already been subtracted from the pilot error signal for the data presented in both the ATSB report and the Ashton paper.
Paul Smithson,
I will only respond to the last paragraph of your recent post.
The term “L_Dop” in Figure 10, which I referred to in my previous explanation, is, indeed, the Burum-satellite element.
Having said that, the penultimate paragraph of your recent post, whilst somewhat inartfully stated, nevertheless would appear to articulate the logic behind the calculation quite well. I think you’ve got it.
All the analysis and associated number-crunching to arrive at LEP 34.234S 93.778E, yet there is imagery showing possible wreckage of MH370 over 500 nautical miles south, IVO 43.402S 95.914E – is there an explanation for this discrepancy? Please review this issue before recommending a new, revised undersea search area.
@sk999, @victor – thanks, both.
@DennisW “Do you really think Ashton et.al. overlooked it or screwed it up?” No, I don’t – not something that obvious. But it seems to me entirely possible that there is something amiss somewhere when:
– you have a noise pattern that seems to be very well behaved most of the time and then wanders out of the park
– you have systematic anomalies of untraceable origin noted by DSTG (not the random walk expected of your beloved Allan variance)
– in the case of the accident flight, you have curve optima for BTO and BFO that are obviously divergent.
I don’t know what that something might be and I am highly unlikely to find it if it does exist since many greater minds with subject area expertise have been over it relentlessly. That doesn’t remove my suspicion that something is wrong somewhere.
@Andrew. Your paper on left engine relight possibilities and consequences analyses two cases; a relight with the engine fuel consumption reaching 10,500 lb/hr or 4,760 kg/hr, at climb thrust, and another reaching something less, 6,600 lb/hr or 3,000 kg/hr. Since the left tank will be dry except for some residual fuel the APU DC pump can access, it is that pump that you visualise as providing the fuel in these.
As I understand it though, the pump’s normal purpose in this function is to provide the left engine temporarily with some fuel following a double flame-out and a consequent loss of the engine’s main (boost) pumps as engine-generated AC power fails. Normally, with fuel in the left tank, a boost pump would take over once AC power was restored, an engine relight using the DC fuel pump having realised that.
Thus that pump nominally delivers only 3,150 lb/hr, or 1,430 kg/hr, i.e. much less than the flow rates of your cases. After a relight as per your Case 1 formulae but with the engine consumption limited to that supply, the engine would accelerate just for 3.6 secs, whence it would hang at low speed for 22 secs, fuel supply constrained, until that supply was exhausted.
That said though, on October 6th @Paul Smithson posted an Eaton Boeing 777 APU DC fuel pump delivery graph. Extrapolating that to a very low delivery pressure, the 3,150 lb/hr above could rise to some 4,750 lb/hr, 2,160 kg/hr, depending on engine fuel demand. That might be seen as a better estimate as to where the engine would stabilise.
Even so, with the engine throttle setting at climb thrust as you indicate, I believe the engine will attempt to draw fuel well beyond that limit. The likely consequence is that a negative pressure in its fuel manifold will suck air through the tank gravity feed or the boost pump inlets, both being uncovered. When that embolism reaches the engine it will flame out again.
Summarising, I think the APU DC pump delivery limitations will limit the likelihood of much thrust resulting from a relight even more than in your Cases. That applies too in a relight attempt at lower altitudes, with a higher probability of success, and quite likely irrespective of the quantity of residual fuel that may be available.
Incidentally, a mystery to me is why the ADU DC pump delivery is at a nominal 24 psi while the boost pumps deliver at 12. They both can supply the engines and APU and through the same lines. I assume that to be irrelevant to MH370 accident analysis.
@Stuart asked: All the analysis and associated number-crunching to arrive at LEP 34.234S 93.778E, yet there is imagery showing possible wreckage of MH370 over 500 nautical miles south, IVO 43.402S 95.914E – is there an explanation for this discrepancy
That imagery does not show wreckage from MH370, as it does not match any of the available data (e.g., radar, BTO, BFO, fuel models, drift models).
IF you are that confident of the calculated BTO BFO fuel models drift models and radar (what type, where monitored and by whom of the AOR southern Indian Ocean) …
Before new search assets are deployed, why not enlist USN resources – MAD-capable long endurance aircraft to locate denser components i.e. turbine(s) of missing MH370 777? As long as there aren’t issues with USN undersea OPSEC, this could be an efficient search strategy, particularly in areas that have been dismissed as unlikely wrt your above reply.
@Stuart,
Magnetic Anomaly Detection does not work well on aircraft debris. A sunken vessel is a much better target, and even that is far from reliable. My thesis advisor at Stanford, was involved with a satellite experiment to differentiate inertial mass from gravitational mass using elegant magnetic sensors. I told him the only known use for magnetism was sticking things to your refrigerator.
@Stuart: I am not against parties conducting searches they believe might be fruitful. On the other hand, my recommendations will be based on what I believe is the strongest evidence we have. I don’t consider the satellite images near 45S to be strong evidence because we can’t positively associate the artefacts with MH370.
If you don’t believe the satellite data is strong evidence, why do you even consider the terminus to be in the SIO? Assuming you trust the military radar data, the last point we have is in the Malacca Strait at 18:22z. Without using the satellite data, the plane could have impacted anywhere within a radius of about 2800 NM of that last radar point.
@Victor,
There will be no more searching without a source of funding. There is none. Malaysia is happy to walk away from the episode. Australian taxpayers have no enthusiam. Boeing does not regard the incident as an aircraft failure. It is OVER. No motivation whatever.
For our part, as analysts, we have failed. Our recommended areas were searched without success. We can collectively hang our heads in shame. Not to say it has not been fun.
Thank you. Thank Duncan.
Dennis, wrt to magnetic detection, MAD technology has been effectively utilized to locate and track undersea vessels. Whether or not this technology is sufficiently sensitive to detect a detached turbine engine, operating from either a low-flying aircraft or autonomous undersea terrain-following drone, is the question – perhaps someone reading has expertise in this field?
Victor, I do believe in the BTO and BFO data which suggests the plane flew on a southerly heading until exhausting fuel supply, terminating in a hypoxic spiral. The LEP you suggested indicates this occurred IVO 34.234S 93.778E. The satellite images IVO 43.402S 95.914E do show possible wreckage of MH370 – I looked at these and other images as soon as they were available, within days of 08 March 2014. I would have liked to have viewed archival images of this area for comparison, to determine what if any level of wreckage was normally present adrift, but there wasn’t any imagery collected in this area previously. The size and apparent drift of the unknown objects I did see were consistent with those of a large commercial aircraft. Ideally, surface vessels should have searched this area promptly; inclement weather precluded this effort. Now we’re left with little to no evidence other than possible wreckage washing ashore on the western edge of the Indian Ocean Gyre.
@David
RE: “Even so, with the engine throttle setting at climb thrust as you indicate, I believe the engine will attempt to draw fuel well beyond that limit. The likely consequence is that a negative pressure in its fuel manifold will suck air through the tank gravity feed or the boost pump inlets, both being uncovered. When that embolism reaches the engine it will flame out again.”
That might well be true. Around the time I wrote the paper there was some discussion about the possibility of an engine relight using the residual fuel in the left main tank. The paper included a somewhat crude analysis of the fuel quantity that would be required to support such a relight. I think we can agree that even if a relight did occur, it is unlikely the engine produced a significant amount of thrust before it again flamed out.
@Stuart
Re: ‘MAD technology has been effectively utilized to locate and track undersea vessels.‘
Not so much these days. There’s a reason that the US Navy did not require the P-8 Poseidon to be fitted with MAD. These days it is just not worth the weight penalty fitting a sensor with very limited detection and even more limited localisation capabilities.
@Stuart: I’m sorry, but I really don’t understand your comment. The location S43.4,E95.9 is about 475 NM from the 7th arc. Yet, you believe the debris from MH370 reached this position within a couple of days of the impact. That would imply you don’t believe in the validity of the BTO data, because surely the debris did not drift that distance over the course of a couple of days.
@Niels,
You asked: “Then, for example, how do you explain fig. 5.4 in “Bayesian Methods…” (The “Mumbai – KL” flight data)?”
Figure 5.4 shows a transient deviation in BFO residual which lasted only half an hour. I think it is highly unlikely to have been caused by OCXO frequency drift, because of the short time scale. It is more likely to be caused by incorrect values of the aircraft position/speed/track/ROC. DSTG said there was a “geographical dependency”. Unfortunately, despite repeated requests, DSTG did not make any of their data available to outsiders.
@DrB
You said – Unfortunately, despite repeated requests, DSTG did not make any of their data available to outsiders.
I personally requested it several times – very disappointing. I categorize it as possibly the most valuable data we have not been given. I have no idea why. There is nothing the least bit sensitive about it.
@DennisW: My understanding is the NTSB shared the flight data with the ATSB, and it is the NTSB that is not allowing that data to be shared with the public. The NTSB told me that historical flight data may be used by one airline to gain a competitive advantage over another, and so it is not shared. That seems silly in this era of public ADS-B receivers, but that’s the explanation I received. Of course, it is Inmarsat that has the pilot error data.
@DennisW
On the plus side, there is other information available that we do not yet have, that might help longer term search. Malaysia’s attempt, since Mahathir, to sweep MH370 under the carpet, and the passage of time, to some extent gives other entities (Boeing, OZ, USA etc) more freedom to share what data they do know, but were keeping quiet.
@DennisW
You stated: “For our part, as analysts, we have failed. Our recommended areas were searched without success.”
I disagree! As analysts, we have not failed!
Governments have failed!
Ocean Infinity has made a proposal to the Malaysian Government, that has been politely ignored.
Our recommended search area has only been searched to a small extent!!
It gets worse for your negative opinion …
We are still on the case and the recommended search area is getting even smaller.
Ocean Infinity could find MH370, within 2 weeks with their current technology.
@Richard,
Yes, there are many points of view on the subject. My viewpoint, as usual, tends to be binary. I am skeptical of your “two weeks” assertion. I too hope the underwater search gets extended, but I don’t think it is likely to happen.
@Victor
I produced an annotated GEOINT product that showed unidentified objects adrift IVO 43.402S 95.914E on 21 March 2014. This annotated image was classified SECRET/REL FVEY but later reviewed and released, and can be viewed today. Apparently a request was made through the USFOIA by Paul Smithson and granted.
The objects shown adrift, if from MH370, would have been exposed to approx 12 days of ocean and atmospheric conditions. According to established current/drift patterns in that area of the Southern Indian Ocean, these U/I objects were probably moving NNE. At the date of the image, the U/I objects were >500NM S of the LEP established via the BTO BFO analysis/calculations. Perhaps a weather event/storm of several days could have caused this seemingly large discrepancy (calculated LEP vs geocoordinates of U/I objects adrift). AMSA tracked these and other U/I objects but later removed them from their search, yet 777 debris determined to belong to MH370 has been washing ashore at the western boundary of the Indian Ocean Gyre. This mystery is far from being solved and certainly merits further study.
@Stuart: Can you please point us to the GEOINT product that you created? Are you affiliated with a government agency?
@Richard,
You have to look at reality here.
If I walked up to a random NorCal person and asked them what they thought about MH370, they would look at me as if I had just fallen out of a tree.
Likewise in Malaysia and Australia. The subject is out of the public consciousness.
Governments respond to the issues concerning their constituents at the time. MH370 is no longer one of them.
Even if it were, what is the point? Locating the aircraft will bring a sense of closure to the small number of people involved, but it will not likely provide any other info. The FDR will show the aircraft was flown to where it was found.
How much will any responsible government official pay for that? Our interest is distorted by the effort we have put in. No one else can possibly share that.
@Andrew. “Around the time I wrote the paper there was some discussion about the possibility of an engine relight using the residual fuel in the left main tank.”
That was 30 lb, 13.6 kg. Excluding the fuel the line, if of @Paul Smithson’s 16mm i.d., 2.3 kg would remain after accelerating to the APU DC fuel pump limit. That allows for the small amount of tank fuel used in that time by the APU.
That tank fuel remainder would power the hung engine for up to 4 secs before again flaming out. After that, there would be insufficient for another start and acceleration.
The context of all this is of course the timing of the final transmissions following fuel exhaustion too closely to be consistent with the Boeing final descent simulations. Those excluded relights.
But as to whether one limited in thrust by APU DC fuel pump delivery, and time by fuel quantity, could deliver the yaw/roll impulse needed, I have had second thoughts. These were prompted by a re-read of a passage of your paper’s 10.1 ‘Discussion’. You describe one of Mike Exner’s level D airline simulations that had a descent rate compatible with the final transmissions. Contrary to Boeings’ though, that was too early.
In that relight an intermediate thrust setting was held for 7 seconds. Your comment was that, “perhaps the onset of the high and increasing rate of descent might be delayed if the engine restarted and then flamed out immediately after reaching the intermediate thrust setting.”
In other words if that level D simulation should be valid, relights of low impulse such as that very limited by DC pump fuel flow and by duration, conceivably would fill the bill after all.
@Stuart
Along your line of thought, I would like to see a worst-case scenario map of the furthest possible that MH370 with active pilot could have flown from Arc7, assuming we know the correct amount of fuel loaded, and allowing fuel models could be 1-2% off.
However, I am not currently an advocate of south-westerly flight direction, and in that direction, there is less potential to get really far from Arc7, because the fuel must be getting low. Around 20-30 South, the is too much fuel aboard for Arc7 to be end-of-fuel, so if Arc7 was not fuel exhaustion, there could be room to run there.
@DennisW,
@Richard
Dennis, you have put into words (and polite ones) that which was my initial response when I read “Ocean Infinity has made a proposal to the Malaysian Government, that has been politely ignored.”.
The response was internal. I never even formed words, but they might have been along the lines of (say): “to be expected”.
And then, Dennis, you have gently explained the reality as both you and I see it. Sadly.
Personally, I can only see the aircraft remains being found in our lifetimes if someone with the resources sees “mileage” in demonstrating their technology for the purpose.
On a more practical note, just how long might the FDR (even the CVR) remain in a readable condition ?
Dear George, Dear Dennis,
I am not trying to market the demise of MH370, nor market Ocean Infinity’s latest technology.
In the case of MH370, reality is not defined in Northern California, Malaysia or Australia.
Reality is defined in the Southern Indian Ocean.
Please wait until you see our next paper on the MH370 Drift Analysis.
You will see, the paper defines a great opportunity for Ocean Infinity to demonstrate their latest technology.
It is irresistible.
It is that simple.
Are we about to be persuaded that a 1.5 year trans oceanic drift is going to tell us where mh370 must lie?
@Richard,
I have great repsect for your analytics as well Victor’s and DrB’s. That is not the point. The point is illustrated by simple decision theory – how much would the Malaysian or Australian Parliamint pay a clairvoyant to know exactly where the wreckage of MH370 is located (add to that the cost of retrieval)? Not very much, if anything, IMO. There is nothing for them to gain but a vague sense of closure.
Of course, you are not a clairvoyant, and we have all seen this movie a few times before. It has yet to have a happy ending.
I was always careful about spending money on R&D, but there was a tax break involved, and it looked good on the balance sheet. There are no tax breaks for governments. They can only grant them, not use them. Competing demands for funds are numerous (in this era of COVID-19 especially).
I simply do not see a new search getting funded.
@Richard,
Reality is defined in NorCal. Silicon Valley in particular. My boss (CEO of the company) would call me with a typical message that he just had a “conversation” with a very unhappy customer in Frankfurt, “get on an airplane tomorrow and go fix it”. “I do not want another call like that”.
Of course I did. Cost me a marraige in the process, but being a coin operated person, I did not mind that at all. Follow the money.
@DennisW. Irrespective of cost/benefit, were the evidence as “credible” as prompted the Malaysian reward offer of the previous OI search, that set a precedent.
Also, even without that, OI has some incentive to try again, as unfinished business. Wreckage discovery would put it in the headlines.
Were it found the Malaysian government would be bound to take the lead on what next and control and arrange funding for that.
Supposing there was some recovery, the investigation would need to be re-opened.
Two questions for a bit of context:
1. Apart from the most recent recommendation, has any of the IG nominated search areas ever not been searched?
2. Has any drift study produced subsequent to an IG search recommendation ever contradicted/eliminated the recommendation?
@David,
OI no longer needs a major discovery to put it in the “headlines. Their technolgy is well acknowedged.
The Malaysian government does not want to be “bound” to a take a lead on anything related to MH370.
I regard it as unlikely that anything found in the wreckage would motivate a “reopening” of the investigation.
Simply put. It is over.
@David,
It is always about cost/benefit. That is the way the world works.
@Richard,
Hello, excuse, when can we see your next paper on the MH370 Drift Analysis?
@DennisW. Thanks, though I prefer to leave what I said stand.
Pressures, perceived responsibilities and achievement can trump money.
Even values, as the contributions here attest.
Were the wreckage located I doubt Malaysia could just ignore that. Who otherwise would decide whether it should be disturbed and if so what parts identified should be recovered and investigated?
@George asked “On a more practical note, just how long might the FDR (even the CVR) remain in a readable condition ?”
The topic has previously been discussed, see comments to earlier post.
@Richard
Hello, excuse,
When can we see your next paper on the MH370 Drift Analysis?
@David,
You are probably right. I have a tendency to dwell on how things can go wrong (not in accord with my preferred outcome).
@Don
Thx. I knew we kicked the storage issue around a bit, but my memory decays a lot faster than SSFD.
@David said: Pressures, perceived responsibilities and achievement can trump money.
Even values, as the contributions here attest.
Well said. The decision to search will not be based on money alone, although of course it is an important factor. That said, I’m not seeing a lot of movement towards a search.
@DennisW, Victor. Thank you
@Don
Thanks.
And I see why you linked to a paper/post and not a single comment post.
My memory and file/search capabilities may be limited (somewhat akin to DennisW’s comment above).
Thanking you that yours are not.
An edited Part-Extract from Dennis’s Comment#5678 of August 4, 2017 at 2:46 pm” helps put it into perspective :-
“Yeah, I tried a historical perspective, and decided that since 9M-MRO was delivered in 2002 I would use that as a baseline for component pedigree.”
and
“I think the conclusion is that it makes no difference relative to data recovery. We should be good regardless.”
In summary, we are two decades gone into the likely life of the DFDR but should have decades left provided due care, skill, patience and persistence are used in any attempt at recovery of data from the devices.
Again, thank you.
@Richard,
I have not pestered you regarding the drift analysis and will not do so now. I know that when you have completed the paper you will post it. I will leave it to your judgment as to whether any prior review would be helpful.
Clearly the Ocean Infinity technology has greatly improved an particularly with respect to the technology used in the original search.
I will not re-hash the long story of a collective loss of confidence in the original IG recommendation, but almost every one one of the subsequent proposals requires a plurality of additional path assumptions, some of which involve magical thinking.
The original search was premised on an un-piloted end game where the plane impacted close to the 7th arc. This was based on a false premise that the pilots had no control over the flight after some “incident”. Who believes that now?
What has not been searched is the area that can be reached by a glide from the 7th arc. There is no evidence against it. But the practicality of a glide only became evident after the initial official search strategy was determined.
The UBIG paper discussed glide scenarios and recommended search areas. My belief is if the glide scenario is to be explored, the most likely area is with respect to the initial IG/ATSB search area. Note that the UBIG and IG glide search areas have a small area of overlap.
@Sid, piloted or unpiloted, the final BFO indicates that impact occured very close to the 7th arc. The most promising section of the 7th arc that has not so far been searched lies to the south. This also aligns with the the strongest clues in the satellite data evidence, namely turn south completed before 1840 and best fit to BTO achieved by a straight and fast flight path. In my view, a glide beyond 7th arc is hopelessly unlikely as a hypothesis. Moreover, the resulting search area recommendation is so non-specific that the prospects of mobilising a search on that basis are nil.
@paul smithson
I agree with you on the path concept, but not the angle. I have put my spread sheets and studies on line for people to look at. But all I get is generalized pushback.
Look at my papers and please explain where I am wrong. The studies do not extend past the 7th arc, so the end game is not an issue.
Re the glide:
On this blog, I and others have posted empirical evidence (actual flight incidents) that confirm that un-powered recovery to a landing can be achieved with similar aircraft after a very steep descent. This is not speculation.may The newer search technology may indeed render the search feasible. We should let Ocean Infinity judge.
So, lets try to resolve our differences on the flight path after the turn as a first step.
@sid. I have previously pointed out that a superior path fit is obtained for an FMT at ends at 18:33:20 (starts 18:30:20). Fl340, M0.840. Ends just beyond the searched zone, between latitude 39.5 and 39.9 depending on your assumption regarding arc1 latitude at 18:28:15. I prefer this to your path solutions for several reasons. Best BTO fit. Round number Mach. End zone not searched.
@paul smithson
Thanks for the reply. LRC @41kft is M0.0.84 to M0.839.
I will take a look at your path. Do you include the BFO?
@Paul/Sid,
Path estimation based on satellite data is a nebulous proposition. Always has been, and will continue (forever) to be. The Inmarsat logs are not GPS. Any terminus on the 7th arc below 20S is easily digested. The 20S upper bound is based on Richard’s drift analytics, which are still the best I have seen, and not on satellite data.
@DennisW. So it is if you are only fitting from Arc2 and don’t care how it got there, or whereabouts Arc2 was crossed. However, the “first generation” solutions (IG, DSTG) were anchored by the need to connect with the pre-FMT portion. This requirement produces the unique solution spectrum down south. As UGIB has amply demonstrated, if you want to reconcile termini much further north with path to radar LKP and Arc1, you need to “fiddle and diddle” to kill time between Arc 1 and Arc2.
@Sid. Start at 18:33:20 at Long 95.2107 Lat 6.8994. Great circle path with initial bearing 190.540, FL340, M0.8401. Wind and temperature fields for FL340 interpolated over time and space. Crosses arc 7 (BTO=18390 at 35000ft geometric h) at 39.55S. I get BTO errors (arc2-6): 6,12,11,-37,17. I need to check BFO residuals again to be sure what “eclipse effect” I had included or not.
@Sid, btw I cannot understand how your LRC FL410 can be fast enough to fit, especially with speed decaying later in the flight.
@Paul,
Therein lies the problem. The satellite data does not preclude “fiddleing and diddling” or anything else for that matter. You want to exclude those possibilties based on your “gut feeling”?
Plotting a path based on the satellite data is a fool’s errand, and I am very good at it. Don’t try to convince me that you are being “scientific”.
@Paul
Anyone with anoounce of common sense would continue the search North from 25S.
@DennisW
I don’t know whether I necessarily meet your selection criteria but I certainly support a continuation of the search north of the last area covered. And widen the swathe to 30 nm either side of the arc.
@DennisW “The satellite data does not preclude “fiddleing and diddling” or anything else for that matter.”
Fast and straight is best fit to BTOs 2-6. Why assume that fast and straight happened from Arc 2 but not before? Particularly when 1840 BFO strongly supports early turn and backward extrapolation of “straight and fast” joins you up seamlessly to a single early turn? In fact you can try and fit as much fiddling and diddling in there as you like but – as DSTG found – you don’t get a superior solution. Why are folks so reluctant to believe that the early consensus was essentially correct, only to be misled by the BFO and fuel assumptions?
“Because that end-zone has already been searched, without result” I hear you blurt. Wrong.
I would urge you and anyone else who has discounted the far south possibility to consult DSTG figure 10.3 that shows the probability distribution of paths with/without BFO. Without BFO, there is a bimodal peak, the higher one at 39-40S and the other at 37S. I have reproduced a zoomed version with overlaid latitude scale, for ease of reference.
https://docs.google.com/document/d/1LjSd4F-8lt3Fx8gJ_vVftipyRnyFcUVqWYec9jKhys0/edit?usp=sharing
In short, the peak of the DSTG’s pdf predicted by best BTO path fit has not been searched. The reason the “fried egg” ended up at 38S was to combine minimum normalised BFO and BTO errors.
@DennisW. As for your “common sense” comment, perhaps a diagram will help you.
https://tinyurl.com/yynuy566
@PaulS
I am not sure if “fast and straight is best fit to BTOs 2-6” but the proviso would be passive flight.
Also if DSTG removed their Bayesian model requirement(priority to simple paths) of passive straight flight with FMT near end of radar, we would obviously have a less constrained result. Not to mention DSTG use of raw BFO without drift is probably the key factor that makes passive straight flight look a reasonable assumption.
So many II’s (Independent Investigators) in OZ like 38-South we need DSTG to reassess their analysis so we can rule 38 South in or out. Tony Abbott suggested consideration of active flight paths, so let’s have DSTG or ASTB act on the suggestion.
(Paul you are not in OZ but “close”)
@tbill, 38S has effectively been excluded by the search. I’m talking about the next bit south which, it turns out, was the best fit of all for BTO.
@paul smithson: Although I appreciate what you are doing, it will be difficult to show that there is sufficient fuel to reach 39.55S at FL340 and M0.84.
@VictorI. There clearly isn’t enough fuel to get there if we assume that fuel must last until 00:17:30 and that zero fuel is available below fuel quantity indication system =0. Both of those assumptions are open to question.
Latter point is not just semantics. Code of federal regulations Sec25.1337 “Each fuel quantity indicator must be calibrated to read “zero” during level flight when the quantity of fuel remaining in the tank is equal to the unusable fuel supply determined under Sec. 25.959.”
“Sec. 25.959 Unusable fuel supply. The unusable fuel quantity for each fuel tank and its fuel system components must be established at not less than the quantity at which the first evidence of engine malfunction occurs under the most adverse fuel feed condition for all intended operations and flight maneuvers involving fuel feeding from that tank.”
It looks as if the left tank suction points are all located close to lowest point (in normal pitch/roll) at the inboard end of the wing. What happens when the plane banks in a long, slow, go-around?
There must be “unusable fuel” (ie below FQIS=0) that is accessible at more normal aircraft attitude than “most adverse fuel feed condition”. There is also fuel in the manifolds, lines and engines. The question is how much.
@Paul
Thx.
I had forgotten about DSTG Book Figure 10.3.
Fuel analytics are not given much consideration by the DSTG (or me, for that matter). We both operate with an unconstrained (infinite) fuel assumption model. One has to believe that the most informed estimate of fuel constraints would be obtained from the manufacturer, and that Boeing reviewed the DTSG work before it was made public.
@paul smithson
Thank you for providing specific starting parameters. I will try it.
@DennisW. Please refer Table 3 and 4 of Appendix 1.6E of Safety Investigation Report for the “boeing performance analysis”. This analysis provided estimated range and endurance for various FL TAS/Mach combinations, assuming ISA delta zero and no tailwind. No mention was made of accounting for “unusable and trapped” fuel. To give an idea of level of diligence applied to that analysis, Table 4 also includes two obvious errors (of corresponding Mach/TAS). It also assumed FL300 M0.865 for half and hour during the peninsular transit and consumed, in the process, about 1T more fuel than estimated by our subsequent estimates of likely speeds between 1721 and 1802.
I am not suggesting that it is “easy” to find a way to reconcile -39.6 with fuel range/endurance, only that it would be wrong to assume that Boeing has looked very carefully at the outer/non-normal limits of fuel feasibility.
@paul smithson
I could not match you parameters exactly. My stating tine is 5 secs earlier and the altitude 1kft higher. However I can confirm that the path is equally as probable as my best late-FMT path. I am assuming GCP as that matches your endpoint much better than rhumb line. My intersection with the 7th arc is 39.64S.
I have not explored the solutions in the region of your solution to examine the sensitivity of the result to the initial parameters.
The following issues remain:
Was there an offset, or is it possible that we are misunderstanding the BFO just after the re-boot? Why and how was the azimuth chosen? How can the fuel consumption be rationalized?
Note that I have retained all of the previous BFO correction settings. I can improve both solutions slightly by a few Hz change in the BFO bias offset.
As for the fuel model, neither of our models includes a step-climb profile. Unless you assume no pilot input, your low starting altitude seems to invite a step climb. Can anyone estimate how much fuel would be saved?
@sid, thanks for replicating. Yes, it is great circle not true track. Step climb spoils the fit at Arc 6 (or arc5+6 if you climb earlier).
@Paul
My fuel range comment was intended to imply that if the range was questionable, Boeing would have alerted the DSTG to that fact. My assumption is that it was reviewed and passed muster.
@DennisW. The “endorsement” of fuel feasibility of DSTG’s estimate is fairly general in nature: “The Boeing analysis gave a series of ranges and time intervals for different cruise altitudes. It was noted that a constant altitude of FL350 or higher gave sufficient range to reach the region on the arc corresponding to the DST Group analysis. Applying the assumption that a series of stepclimbs had been performed during cruise, produced a range greater than that required to reach the region of interest on the arc….The performance calculations gave a maximum range that was consistent with the DST Group PDF. These two sets of results were obtained independently and it is significant that they were in general agreement.” Ref p17, MH370-Definition of underwater search areas, 3 Dec.2015, ATSB
@DennisW, @Mick Gilbert: One thing we’ll see coming out of the drift analysis is that it predicts near impossibility for any crash latitude north of Broken Ridge.
@Victor
“@DennisW, @Mick Gilbert: One thing we’ll see coming out of the drift analysis is that it predicts near impossibility for any crash latitude north of Broken Ridge.”
Victor, is that conclusion from re-analysis of data already analysed in past attempts and reviews, or does it also include additional data not previously included ?
@George G
Not giving a contract to Larry Stone (Metron) was the biggest mistake Malaysia and the ATSB made in this whole endeavor. That organization (Metron) has the pedigree (a very imortant factor to me) of finding things. I know the “scientists” on this site will disagree with me, but that is what scientists do.
@George G: David Griffin has kindly provided for the public the results from drift modeling of 80,000+ particles along the 7th arc. We (primarily Bobby and Richard, and me to a lesser degree) are using those results to create a PDF of crash latitude for each debris that provides useful information, and then combine those individual PDFs into a single, composite PDF. I’ve greatly simplified the process, as the generation of the PDF requires a great deal of processing and advanced statistical analyses of some very large data sets. This type of complicated analysis has never been applied to the data sets, so the results will be new.
That said, crash latitudes north of Broken Ridge seem very unlikely, as the debris would have arrived much earlier than what was observed. Complicating the observations is the possibility that debris was reported some time after beaching. We are using the prevalence of barnacles as an indicator that a part was not beached long before discovery.
@Victor,
The timing of beached debris has always been an issue. It makes this data very vague and unreliable. I tend to virtualy disregard it.
@Victor,
Ta.
@DennisW: We can bound uncertainties on the expected arrival time of debris. While difficult to use the drift data to pin-point the crash site, some trends are very evident. We also know that barnacles on beached debris are rapidly scavenged.
@Victor
” One thing we’ll see coming out of the drift analysis is that it predicts near impossibility for any crash latitude north of Broken Ridge.”
I tend to agree. Additionally, I have been trying to argue that the high winds below 22 South may account for the apparent straight nature of the flight path. Either the pilot used LNAV/TT all the way, or he descended/slowed to lower wind at lower altitudes. In either case we have the appearance of straight flight. Of course, the home flight sim work is suggestive of a more southern terminus also.
The above debris drift conclusion will be controversial for the Xmas Island theory, which postulates that the barnacle and debris drift evidence uniquely supports the Xmas case. I believe their main argument is the water is too cold below Xmas to allow the observed barnacle growth. So I would like to see the barnacle interpretation conflict addressed.
Barnacle Bill
@Victor
It has been awhile since I looked at the dynamics of debris deposition (along with removal and redeposition). It is an incredibly complex and stochastic process. Several studies have attempted to characterize it. One of the best ones I came across is linked below. My conclusion was that it is a pretty hopeless undertaking.
https://www.ncbi.nlm.nih.gov/pmc/articles/PMC3867434/
@DennisW: That paper deals with errors in estimating debris deposit rates using long sampling periods due to removal mechanisms such as “unbeaching”. The drift study comes at this problem from a different angle: GIVEN that a debris was reported at a particular location, what is the probability (assuming the drift model data is accurate) that a crash latitude would result in the reported date. So the absence or quantity of debris at a particular location is not used (at least on the first pass) to quantify the probability of a crash latitude.
The methodology will make more sense when the paper is available. The amount of effort that Bobby and Richard have put into developing statistically significant yet unbiased metrics is very impressive.
I was contacted by a reported from the Mirror Online to answer some questions about a new search for MH370. Here is the article:
https://www.mirror.co.uk/news/world-news/top-mh370-experts-find-crash-22835746
@Victor
Long sampling periods??
Table 1 of my linked reference study essentially tells the whole story.
An interval of 1 day between searches (7 trials) yielded a mean debris count of 772 pieces. An interval of 14 days between searches (6 trials) yielded a mean debris count of 1507 pieces. >10x longer interval, but only twice as much debris. Other table entries show a similar trend, and support the conclusion that debris is “unbeaching” faster than it is beaching. Who knows how long an aircraft fragment has been on the beach and off again (picking up fresh barnacles). There is no way to tell when a given piece of debris beached – plain and simple. In most cases the “time to beach” will actually be much shorter that one would estimate based on the time of collection.
@DennisW said: Who knows how long an aircraft fragment has been on the beach and off again (picking up fresh barnacles).
It takes months to grow barnacles to the size seen on the debris, and days for the barnacles to be scavenged after the parts are beached.
We are not looking at one piece of debris. Rather, we are looking at about a dozen pieces, looking for patterns, and deducing likely crash locations. There is nearly zero chance that the crash occurred north of 25S.
@Victor
I look forward to reviewing the new work, and will refrain from commenting further until it is published. My advance comments might give you something to consider and address.
@Victor Iannello
@DennisW
I’ll wait to read the paper when it’s released. I will be particularly interested in how the new paper specifically deals with the findings of the old (now deleted?) paper – https://mh370.radiantphysics.com/2018/07/20/godfrey-drift-model-says-mh370-might-have-crashed-further-north-on-arc/
And I’ll reiterate a question raised earlier,
Has any drift study produced subsequent to an IG search recommendation ever contradicted/eliminated the recommendation?
There seems to be this wonderful “No More Gaps” plasticity to the application of drift modelling that might make someone justifiably doubtful of its efficacy in determining, or even eliminating, search areas. But, as the Zen Master was fond of saying, ‘We’ll see.’
@Mick. +1. I do recall way back at the beginning when the very same Dr Griffin and his particles declared that the original (far south) search zone was compatible with the drift models. As DennisW would say, we have seen this movie before.
@Victor. Looks like a balanced and constructive Mirror summary to me. Maybe they will get a response from OI.
What concerns me about the reliability of drift analysis is the accuracy by which speed and direction of individual items can be attributed, these varying with time in the water and conditions. The experiments off Tasmania were brief, coastal and inshore; necessarily so at the time. But even for those sites and using some doubtful replicas, results were scattered. They were more like samples.
Modelling embraces different average drift rate groupings but for example the flaperon can flip and could stay that way for a while, altering both speed and direction mid-journey. The course of the part right flap most likely was not directly downwind. Also IMO one of the replicated items in the coastal experiments probably cartwheeled unseen downwind, even though in just moderate winds and seas.
So I am hoping that this aspect can be addressed more robustly in the new study than hitherto and of course that it does prove convincing enough, after your collective prodigious efforts.
@David
@Victor. Looks like a balanced and constructive Mirror summary to me. Maybe they will get a response from OI.
I found the comments interesting. People have run out of patience with analysts and journalists. The headline was indeed, misleading. Even my previous colleague friends have expressed the well-grounded opinion that the analytics associated with this event are embarrassing for a technically adept person to pursue, and have chastised me for it.
I am doubtful of any OI response.
@Paul Smithson. At your Oct 19th 11:17 AM, about extending range, you posted, “There is also fuel in the manifolds, lines and engines. The question is how much.”
Some specifications for an Eaton 777 boost pump are below. Its appearance and performance (35,000 lb/hr) looks to be near-enough the same as that of the -200’s (35,200 lb/hr) though with a different motor. Its outlet’s internal diameter scales at 50mm, or 2 in. I estimate the length of the fuel manifold line between it and the engine pump to be 33 ft. However air entry into the suction (gravity) feed from the tank would break engine suction before all fuel in that column reached it. The length of the line from the suction inlet to the engine would be about 30 ft.
That would offer 33 lb, or 15 kg of fuel once manifold pressure was lost ie before flame out, assuming the line i.d. to be that of the boost pump. Because that suction supply is unpressurised the manifold i.d. from that point might be larger – though since the pump delivers enough for two engines, possibly the i.d. is reduced instead at its outlet junction with the two-ways manifold. Here I assume the 2 in. manifold throughout applies.
Were the main tanks’ cross-feed open that would make no difference to the 33 lb.
This fuel will increase range to flame out but by just that little amount. That in the engine’s fuel pumps, lines, its sizable fuel/oil heat exchanger and its fuel metering unit could add some to that but once the engine low pressure pump draws air and pressurisation of fuel upstream fails, it might not reach the HP pump. Summarising, there will be a little extra fuel in lines etc but not much of a contribution to what you seek.
But aside from that, other points can be drawn.
At engine run down, with the APU DC fuel pump delivering at nil outlet pressure, (assuming that the line air would be discharged freely), ie at 4,750 lb/hr, it would take about 25 seconds to fill that line. This is roughly consistent with @Andrew’s comment in his paper that in the Exner level D simulation where relight timing was observed there was a rise of EGT 30 secs after flame out.
That though was a P & W (I think) engine. The Rolls Royce will shut itself down on dropping to 35% rpm, so I assume that would take longer than those 25 seconds though I am uncertain of that, particularly if the aircraft slows subsequently…….
However this may be overtaken anyway. Scaling the outer diameter of the Eaton APU DC fuel pump outlet whose specs you posted and, using the boost pump diagram below to ascertain a comparable wall thickness and flange width, I think the i.d. of that outlet is 20 mm. Also, whereas the APU fuel line length supposedly is 100 ft, I have looked into that and believe it to be more like 135 ft: in the fuselage it is routed forward briefly then traverses the aircraft width perpendicularly before returning to the centre line then heading aft.
Supposing the line to be of these dimensions the fuel in it will be 23 lb, or 10.5 kg. With the ATSB indicating 30 lb of residual fuel would be available to the APU that leaves insufficient in the tank for the APU DC fuel pump to refill the engine manifold, so there will be no relight attempt.
This low fuel tank quantity gels with the Boeing fuel tank diagrams, which place the APU DC fuel pump inlet close to that of the aft boost pump. So far as I can ascertain neither has a sump.Thus I have found it hard to fathom why there would be appreciable residual fuel in the tank, for that reason.
Finally, I see also from the below that the nominal (Training Manual) 12 psi of the boost pump’s delivery, oddly low when compared to the APU DC fuel pump’s 24, in fact varies with flow rate from 28 to 13. At its nominal delivery of 35,200 lb/hr it is about 16 psi.
Incidentally Eaton also has another boost pump model for the 777 with a higher flow rate, presumably that being for the later bigger GE engine.
https://www.eaton.com/ecm/idcplg%3FIdcService%3DGET_FILE%26allowInterrupt%3D1%26RevisioRevisionSelectio%3DLatestReleased%26Rendition%3DPrimary%26%26dDocName%3DCT_137710
PS Having checked the Eaton URL I see the site is now down, apparently temporarily. I will post the document on Dropbox therefore.
@David
@Victor. Looks like a balanced and constructive Mirror summary to me. Maybe they will get a response from OI.
I found the comments interesting. People have run out of patience with analysts and journalists. The headline was indeed, misleading. Even my previous colleague friends have expressed the well-grounded opinion that the analytics associated with this event are embarrassing for a technically adept person to pursue, and have chastised me for it.
I am doubtful of any OI response.
Eaton boost pump brochure:
https://www.dropbox.com/s/ng3tdzwd3empwq9/DS600-2_Type9106%20Fuel%20Boost%20Pump%20B777.pdf?dl=0
@DennisW. OI do not seem to share that embarrassment.
But if there is a response it might not be to the Mirror.
@David
@DennisW. OI do not seem to share that embarrassment.
Of course not. They are in the business of searching. Why would they question any analytics? OI has never expressed an analytical opinion. It is not in their interest (or in their domain of competency) to do so.
@Paul Smithson. In my above post I neglected to say that the extra fuel available in the manifold etc would apply to both engines, about doubling the effect on range.
Also, I will look into what the engine fuel/oil heat exchangers might hold.
Hello, sharing some info that I haven’t seen on the reports or in comments. Apologies if this has been covered.
OCXO’s , although “ovenized” can exhibit frequency drift over temperature. They can also overshoot or undershoot target temp (and frequency as a result of) if there is a sudden temperature change.
Not sure where the OCXO is situated on the aircraft, but I’d put forth there may be a correlation between OCXO offset and temperature/altitude or cabin temperature. All depends on the performance of the OCXO which should be well characterized by the manufacturer.
@David, thank you very much indeed for these estimates. I have also been searching for unusable and trapped fuel numbers from Type certification data sheets and have been able to find a figure for “unusable fuel” for 777-300ER (344lbs) and for 787 (702lbs, of which 217 lbs unusable-drainable and 485lbs trapped). So we are in the same ballpark. From these figures it would appear that if any additional fuel were accessible beyond FQIS=0 it would be very small.
@paul smithson, @Mick Gilbert, @DennisW, @David:
The authors are trying hard to develop and use a predictive methodology that is scientific, statistically meaningful, and without bias. After the paper is published, you can judge for yourselves whether that attempt was successful.
The tip of an iceberg…
https://finance.yahoo.com/news/goldman-hit-record-u-bribery-150632636.html
@DennisW. Thanks. I see that Goldman Sachs’s bribery continues.
This time to stay out of jail.
Not a recourse open to everyone.
Is it their shareholders who pay, despite this recent 1.2% price rise. Where do they come into this?
@Paul Smithson. Glad to be of help. Those ‘unusable’ figures. As a matter of interest do they define what that term means? Level flight at … pitch?
The fuel oil heat exchanger and filter fuel content would be a handful of lbs only.
https://www.dropbox.com/s/dpany5jt68cu19h/RR%20Fuel%20Oil%20Heat%20Exchanger.png?dl=0
@David
https://www.faa.gov/documentLibrary/media/Advisory_Circular/AC%2025-7C%20.pdf
P195 runout test
@David
The shareholders will not be billed directly, of course. They will certainly be affected by changes in the value of the stock. Goldman’s market cap declined by some $15B, primarily as a result of this scandal. So the collective shares are worth $15B less than they were at the start of the year. Share value went from $250/share to $205/share. I have never owned any.
My interaction with GS has not been pleasant. They represented a couple of companies my company attempted to acquire (unsucessfully). I view them as a bunch of three piece suit arrogant bastards.
Goldman has about $150B cash on hand, so they will have no trouble paying the fine. The executives took pay cuts that were largely symbolic.
The recent rise in the stock price is a result of the settlement. The downside in share price was already baked in.
@DennisW. Thanks. The shareholders effectively bailed out those responsible but without a say.
@David
My intestest, of course, has been the (I think likely) relationship between the 1MDB crime and the diversion of MH370. The scandal was well-known in Malaysia in the 2012-2013 time frame. I was never able to make a connection, but I strongly suspect it. Players at this level are very well insulated.
The most likely hijacker demand is a bank transfer which, unlike a prisoner release, can be orchestrated and verified with a few mouse clicks in real time, and is extremely difficult to reverse.
@DennisW. We might have learnt more if the criminal charges had been pursued, particularly by Malaysia, or if Low had been located.
@David
I am astonished that Jho Low is still at large, whereabouts unknown. His yaught (91.5 meters) is up for sale again. $250M? Kylie Jenner celebrated her 22nd birthday on it in August.
Just reinforces what money can buy in this age of “transparency”. I can’t buy a six pack of beer without Visa telling me about in 15 minutes. I should probably do all my business in cash – until bitcoin takes over. Then again, why should I care? I never laundered any money.
@Victor
Sorry to get the discussion “off point”. I will cut it out, but I do think a consideration of motive has value.
@DennisW. Your claim to the blame is unfair.
@David
@DennisW. Your claim to the blame is unfair.
Perhap. Unfair to whom??
@DennisW. I claim most of it.
@Paul Smithson. Unusable fuel. My thanks for the reference. So that includes the “undrainable” fuel in the fuel tank and that required for the “most adverse fuel feed condition” – that state being outlined in your reference – when compared to that in the aircraft level on the ground
My understanding then is that the fuel level of zero would be set at when the fuel drops to that needed for that “most adverse fuel feed condition”. Much of the fuel needed for the adverse condition might be available after fuel level reads zero at end-of-flight, depending on the aircraft attitude etc in the adverse condition and that at end-of-flight, the aircraft level-on-the-ground fuel being the datum for both.
Added to that would be the fuel in the manifolds etc.
Is that the way you are seeing it?
@David. Yes, “unusable” means fuel in the tanks that can’t be accessed under most adverse fuel feed condition – whether drainable or not. The fuel in manifolds and lines also not included included in fuel per FQIS because it isn’t in the tank.
So the potential “extra” fuel beyond what the measured fuel load is the portion of the “unusable” that is accessible in practice plus whatever can be accessed from manifolds/lines/engines. And I think we have established that this is “something” but likely in the order of ~200kg.
A final potential addition is fuel in the centre tank that wasn’t fully removed by scavenge, which is supposed to shut down when ‘measured’ <500lbs remaining. Some of this potentially becomes accessible when all pumps selected ON, as is apparently called for in non-normal checklist after EICAS FUEL QTY LOW alert (2000kg or less in either main tank). According to correspondence between AAL and FAA surrounding a related AD, around 200lbs of that centre tank residual fuel is expected to be accessible. So that's a further ~100kg at best.
@DennisW: The amount of money siphoned from 1MDB to Najib and his cronies is impressive by any measure. Certainly, that was part of the political dissatisfaction that the captain had for the Najib administration. And surely Najib had strong friends and enemies around the world that were either positively or negatively impacted by the money drain. What the exact relationship between 1MDB, MH370, and MH17 remains a mystery at this point, but I think there could be one.
@David,
In a number of your comments above you’ve mentioned the hydraulic oil heat exchangers located in the main fuel tanks.
In normal circumstances these heat exchangers are naturally immersed in the fuel stored in the tanks. It would seem reasonable, given there is no forced flow of fuel through the heat exchangers, that the fuel readily passes through the heat exchangers by convection and that very little fuel would be retained in the fins of an exchanger as fuel recedes below the 2175kg level stated for the L & R HYD system heat exchangers to be effective (or 3313kg of fuel required for the centre hydraulic system’s heat exchanger to be effective as it is located outboard of the R system’s unit within the R main tank).
Therefore, I conclude the contribution from the heat exchangers to unusable fuel would be negligible.
NTSB’s reports into the Asiana/HL7742 accident at SFO included the most recent weighing report for that airframe. The weighing report accounted for trapped usable (ie, that between the pumps and the engines/APU) and drainable unusable (ie, that which cannot be accessed by the fuel pumps, while a/c level).
HL7742 trapped usable qty was recorded as 37.3kg
HL7742 drainable unusable qty was recorded as 79.56kg
PaulS and I have corresponded on this subject, Paul also located a Boeing document related to the 777-300 that specified a ‘standard items allowance, unusable fuel’ as 156kg. I read this to be a planning figure whereas the HL7742 figure was a measured quantity.
My conclusion is that FQIS = 0, a dry fuel manifold, engine flame-out, and N3 speed diminished below 35% means there’s no option remaining for the engine experiencing those conditions to relight.
@Victor
Thx. I think I have paid my dues on the anaytical side of the MH370 investigation and earned the right to weigh in on the boggling array of surrounding circumstances.
> MH370 Diversion
> MH17 Shoot down
> 1 MDB Looting
> the Zahid Raza assassination in Madagascar
> Blaine Gibson death threats
> Zaharie’s relationship with Fatima Pardi
> ZS’s flight simulator and data
> The flight path itself is not readily comprehensible
Any one of the above is possiby digestible, but taken in aggregate they are overwhelming.
@DennisW: Speculation is allowed here, as long as speculation is not presented as fact and it does not dispute what we believe to be the facts.
I have not yet heard a scenario that checks all the boxes. Many people here would disagree. However, I do have a scenario that I think checks the most boxes, and I present that in the context of being the most likely. Without more evidence surfacing, I’m not sure what more we can do other than find the plane.
@Victor
The goal for me is determining the cause of the diversion. Finding the plane may not (probably won’t) shed any light on that, but I don’t know what else we can do within the limits of our resources.
I fear that those of us who are not fans of the murder-suicide explanation will be left dissappointed even after the wreckage is located.
@Paul Smithson. 300 kg is pretty substantial. My supposition that zero fuel would be set at that needed for the “most adverse fuel feed condition” was just that though I have found no confirmation. Have you?
The -200ER quantity will be apparent from FQIS calibration and checking but I have nothing on that.
@Don Thompson. The fuel oil heat exchanger I posted about is that fitted to the engine downstream of its LP pump. Diag below is from the accident report of the BA Heathrow 777-236ER, RR engine equipped, resulting from fuel restriction, 17th Jan 2008. The heat comes from engine oil.
https://www.dropbox.com/s/3u1a9llanutgmvg/777-200ER%2C%20RR%20Trent%20800%20series%20engine%20fuel%20system.png?dl=0
You will see that the flow is forced by the LP pump.
About unusable fuel, my apologies for not having read your post before responding to Paul Smithson.
@Victor
The problem with a murder-suicide scenario (which you implictly endorse) is a path paralleling the coast of Australia. A path further West would obviously greatly complicate search efforts which have to be based in Australian ports. A murder-suicide mindset would have flown further West.
While I think your work (and your collaborators) is truly excellent, it fails basic logic. The path makes no sense at any level. A path to the North, anticipating a possible Cocos bail out, makes much more sense.
@Don Thompson. Continuing. Absent any definitions you have accessed, I think the term “trapped usable” fuel that you have gleaned as an Asiana Basic Weight and Balance inclusion might be that in the tanks which cannot be drained from the aircraft when level on the ground.
As to the “drainable unusable” the FAA has an explanation of the Airworthiness Standards phrase “Unusable Fuel Supply” that @Paul Smithson posted, viz., “The unusable fuel quantity is the quantity of fuel that can be drained from the fuel tank sump with the airplane in its normal level ground attitude after a fuel tank unusable fuel test has been performed, plus the quantity remaining in the fuel tank (undrainable fuel).”
“Drainable unusable” looks to be the former. I think it consists of fuel required to meet the “most adverse fuel feed condition”, also described in the FAA explanation. While it is termed “unusable” in that context, some of it would be available when the aircraft is short of that ‘condition’.
Neither recognises the availability of fuel in the pipeline from the tank to the engine HP pump I believe, including the fuel oil heater.
Supposing fuel used to calculate nominal endurance and range is that which, used, drops indicated fuel to zero; and also that indicated tank fuel quantity does not vary appreciably with aircraft attitude, then the maximum fuel that could be available would be that plus the “drainable unusable”, plus the trapped usable, plus that in the lines etc to the HP pumps.
To this should be added or subtracted any “drainable unusable’ that results from the aircraft being other than level-on-the-ground.
Since the attitude/condition of the aircraft at right engine failure most likely will be different to that at the left the ‘drainable unusable’ can differ one to the other.
The above supposes my understanding as to how the ‘zero fuel’ level is calibrated to be correct, amongst other things…. The terminology has me cross eyed.
@Paul Smithson. The fuel that you indicate could be transferred from the centre tank might be counted as part of the recognised loading of the aircraft, it being SOP to access it at fuel-low warning. If so, it might be included as a negative mass if not accessed, ie were there no pilot – and thence would need to be subtracted from the nominal fuel load.
@Paul Smithson, Don Thompson. I see that FAR 25.1553 says that,
“§ 25.1553 Fuel quantity indicator. If the unusable fuel supply for any tank exceeds one gallon, or five percent of the tank capacity, whichever is greater, a red arc must be marked on its indicator extending from the calibrated zero reading to the lowest reading obtainable in level flight.”
“..extending from the calibrated zero reading to the lowest….” supports my penultimate paragraph above I think.
@David,
Apologies for my confusion concerning the hydraulic oil-fuel heat exchangers, within the main tanks, and the fuel-oil heat exchangers proximate to the engines.
You wrote, “I think the term “trapped usable” fuel that you have gleaned as an Asiana Basic Weight and Balance inclusion…‘
“Trapped usable” fuel is that which lies between the boost pumps and the engine combustion chamber fuel nozzles. It is termed “trapped” as is not measured by the FQIS, it’s “usable” as it can be supplied to the fuel nozzle for combustion.
Anything “unusable” is, well, unusable for any combustion and motive power. An unusable quantity maybe drainable, via the sump drain valves, or trapped. In the case of trapped unusable, that is a quantity that is typically removed from the tanks by evaporation before unprotected entry into the tank void by maintenance personnell.
Concerning the 777, can you envisage any practical procedure for establishing FQIS = zero other than defueling the tanks, while the aircraft is levelled, to a state where only unusable fuel (combination of both categories) remains?
Defuelling, pressure defuelling, is achieved by diverting all fuel via the defuel valve to the refuelling station nozzles. This is achieved by running the boost pumps while the defuel valve diverts the fuel from the engine feed manifold.
With FQIS zero level established, the minimums for regulatory purposes can be managed by the FQIS. Periodic confirmation of the FQIS reporting may be confirmed with manual procedures employing the manual measuring sticks.
Returning to the fuel-oil heat exchangers, these are not significantly large vessels. Note, also, that while the main FOHE is mounted on the core casing, it appears that the AAIB simplified diagram omits the IDG FOHE that is mounted on the engine’s accessory gearbox. I’d estimatte a static volume of maybe 5 litres, I may improve on that.
Addressing the fuel quantity necessary to ensure boost pump uptake during normal aircraft manouevres (in a case where planned reserves are depleted to minimal levels), the MAS flight planning procedures state a static element of the fuel load, ‘Company Fuel’, that is 3000kg.
@Don Thompson
Regarding the Maldives & the B777 coming from SA: would you know the arrival time at Male for this aircraft HZ-AKF? I found back some old FlightRadar screenshots; I can check if I have images from close to the arrival time.
Do you have an overview of all flights arriving at Male that morning?
Niels,
HZ-AKF actual time of arrival at VRMM was 0827.
Other flights, yes, everything. Arrivals, departures and overflights.
@Don Thompson. Thanks. I hear you as to the interpretation of what the Basic Weight and Balance fuel inclusions mean.
My endeavour has been to tie the terminology with that used by the FAA in its requirements and in its explanations of them.
I aim to respond further when I am clearer.
Re your, “Returning to the fuel-oil heat exchangers, these are not significantly large vessels.”
Of those, that heating the fuel by the engine oil and depicted in the diagram I posted will have much the largest capacity, particularly with the filter included. Being without access to the RR information I scaled the size of the equivalent GE items to get to my estimate of the fuel that the RR would contain, ie a “handful”. I was bearing in mind that in the main fuel heater, that using engine oil, of its total volume fuel occupies just that in the thin tubes and the end chambers.
The IDG’s may contribute nothing at all if downstream of the HP pump, as is the GE’s (there, both these heat exchangers are).
@Don Thompson. “handful” should read “handful of pounds”.
@Paul Smithson. About manual centre-tank scavenge at low fuel level indication I quote from the accident report into that 17 Jan 2008 BA 777-236ER accident at Heathrow:
During flight, “..as the main tank fuel quantities approached 12,200 kg, automatic scavenging of the remaining fuel within the centre fuel tank to the main fuel tanks commenced, as designed. Over a period of about half an hour the centre tank quantity indication reduced from 800 kg to zero, indicating that complete fuel scavenge took place.”
@Don Thompson
Please see:
https://www.dropbox.com/s/oymwifuc2yvw0sg/Maldives08032014.pdf?dl=0
Especially 02:43 UTC could be interesting; there is a aircraft about 500-600 km
N-NW of Male that seems to be heading there. Perhaps it is possible to match the “situations” in the screenshots with your Male records?
@Niels,
Thank you for those screen snaps. There is the possibility that HZ-AKF was not displayed by FR24. While the aircraft was operated by Saudia, it was employed on non-scheduled operations.
On first pass, I can identify some of aircraft icons. Your selected aircraft are good ‘anchors’ to the movement records.
@Don Thompson: I am not aware that FR24 does not display information for non-scheduled flights. I understand that registrations (upon request) are sometimes blocked, but non-scheduled flight info is regularly displayed. Do you have more information about this?
@Don Thompson: It looks like countries can opt to not have military, coast guard, and VIP flights not appear on FR24. This goes beyond hiding registration information for some displayed flights. I suppose this might have occurred for HZ-AKF.
@DennisW
Not to further complicate the picture, but here’s a scenario …..
The status of MH370 as being unknown/possible threat was established within hours of the pilot’s last voice transmission via SIGINT intercept. This information was quickly passed to decision-makers who determined the missing aircraft could pose a potential terrorist threat to countries in the area. Violent extremist organizations (VEO) were known to operate throughout the area, particularly further to the NE of Malaysia. A high priority was determined and appropriate resources were sent to overfly the area. Surveillance and SAR (search and rescue) flight was conducted at high altitude. Probable wreckage was observed on various imagery formats, initially located at approx 40S 92E. Analysis of imagery from multiple formats indicated the wreckage was most likely from a commercial aircraft, and with little/no commercial aircraft in the area, MH370. Without evidence that the initially perceived threat of airborne terrorism was still operational, intelligence collection assets were pulled back. Partner assets continued to monitor the situation.
@Victor,
I wrote “While the aircraft was operated by Saudia, it was employed on non-scheduled operations.”
I might have been more accurate to write “non-scheduled VIP operations“. Images hosted around the many online photo libraries show HZ-AKF at airports that are not Saudia scheduled destinations. Its interior fit was predominantly a ‘business class’ type configuration. I’m interested only in HZ-AKF’s departure time to VRMM, the services it may have been employed to undertake at other times aren’t of concern and speculation about those distract from the specific information I’d like to confirm.
While attempting to find relevant historical movement information about HZ-AKF, some search results have specifically indicated that HZ-AKF was regarded as ‘private’. Unfortunately, the non-commercial public trackers, that do not incorporate privacy filters, did not enjoy widespread coverage in Mar 2014.
@Don Thompson: It’s too bad that LiveATC coverage in Saudi Arabia is poor, as there might have been archived recordings from airport or area control center traffic. There might have been archived ADS-B data, but that data, if it ever existed, is probably purged by now.
@Stuart
I assume in your scenario that you perceive the PIC’s motive for the diversion was murder-suicide.
@Stuart: In your scenario, what intelligence was shared with Five Eyes? When was the debris discovered at 40S 92E?
@Victor
EO imagery was shared among US Australia UK New Zealand Canada (REL FVEY). Images derived from other platforms were not shared.
Debris observed IVO 40S 92E within approx 48 hours of MH370’s disappearance. So something appears to be off wrt the BTO BFO calculations placing the LEP >500 NM North, if the wreckage observed is MH370. In post event analysis the absence of any terrorist act committed since MH370’s disappearance, using the plane as the vector, appears unlikely. This is not to say that a pilot with nefarious intent didn’t redirect MH370 from its intended route; determining this can only be accomplished by locating/examining evidence.
@Stuart: Did you have the opportunity to review the images from Pleiades at -35.2,90.5 on March 23, 2014?
@Don Thompson,Victor
At least some of the flights which seemed connected to the Saudi delegation going to China were visible at FR24, one with quite remarkable call-sign, see:
https://www.dropbox.com/s/7f089x50bh53ao8/MaldivestoChina.pdf?dl=0
@Victor
I have reviewed these excerpted images/image insets that display irregularly-shaped objects adrift. I remember seeing similar EO and false-color images which indicated possible wreckage from commercial aircraft, and not shipping containers etc. as some have suggested. As an analyst, it is always best to examine the raw image so that appropriate filters/enhancements can be applied in order to fully exploit the image. Unfortunately I no longer work in this field and don’t have access to classified systems image product library(ies). Many of the images from the various phases of the MH370 search have been archived and should be available for viewing by those with appropriate clearance/need to know. However, as I experienced over a 20 year period, some images are occasionally made “not available” without explanation, likely due to being particularly sensitive/limited access, or for other unknown reasons.
@Stuart: What we know about the Pleiades images is contained in the following report from the ATSB. If you have additional insights, that would be very helpful.
https://www.atsb.gov.au/media/5773370/mh370_satellite-imagery.pdf
@Victor
I have often thought qualitatively about the size distribution of found objects from this event. For many crash scenarios there would be a large number of smaller pieces, yet the total number of pieces found is small.
Recently I read an article about the plastic pollution in the ocean including concentration in gyres. The article suggested that a significant amount of plastic refuse sinks to the bottom, weighted by organisms that grow on the floating material. (From some posts here I understand that beached debris that does not have barnacles may be older pieces that have been cleaned by scavengers etc.)
The different types of debris have different composite specific gravities depending on the construction. I would guess that a honeycomb structure would float best. As the sea growth increases, the amount of the piece above water would diminish, changing the windage. Smaller, less buoyant objects might actually sink.
I know that this would be an additional potential complication in the drift analysis, but that is not a reason to avoid mentioning the possibility.
@Sid
I worked very near Moffett Field in a previous life. Shared a fair amount of bar time with the P3 boys. Their opinion is that after a week you may as well not even look for debris (aircraft or surface vessel). Norcal waters are similar to conditions off the West coast of Australia.
I place little weight on the ability of debris (sightings or findings) to help us.
@Victor
Yes, that ATSB report is the one I reviewed and provided feedback on previously. I still think something may not be accurate with the LEP at approx 34S 93E – the ATSB report reviews imagery IVO 34S 91E from 23 March 2014, which is >400NM NNE of the debris I reported in the GEOINT product dated 21 March 2014. Neither debris sighting seems to support the LEP calculated via BTO BFO data of MH370 because of debris adrift >13 days, subject to NNE prevailing ocean current and atmospheric conditions. The distance between the two debris fields suggests the possibility that they are not from the same aircraft, perhaps not aircraft wreckage, OR did MH370 fracture into multiple sections with some pieces transmitting data to INMARSAT IVO the calculated LEP while other pieces of the plane stayed aloft and traveled further S?
@Stuart
I am a little confused.
At first you were talking debris seen at approx 43/96
Then the discussion shifted to 40/92 which is a bit closer.
Obviously there is debris all over the ocean but if there was something that authorities behind-the-scenes considered likely MH370, that could be significant. But it does not seem consistent with initial Australian sea bottom searches IVO S22/99 which is over 1000 nm away.
We do need to be open to new info which may be coming to light now, and we should probably try more FOIA requests to see if there is more willingness now by USA/OZ etc. to share the known data.
@TBill
The location approx 40S 92E is where glint (reflected MW energy, in this case from the edges of solid unidentified floating objects) was observed on SAR imagery – for background please read the scenario I provided on 26 Oct 2020 0644, and also the handling/availability of said SAR images in my post on 26 Oct 2020 1847.
@Paul Smithson
I was checking some “far south” paths, and for example M0.84 in combination with CTT189 works well with the BTO data. I found a good fit at FL390 at which the fuel consumption (as well as M) is rather close to what you would find for LRC. So no real issues regarding fuel consumption imo. If I find the time I’ll share some more details.
@Stuart,
When you state, above, “SAR imagery” are you suggesting Synthetic Aperture Radar imaging?
Now, I’ve made the connection to your efforts. Release to the public domain of the image you refer was a consequence of an FOI request by Annette Mansfield in Australia, I assisted Annette in extracting the images from the ‘packaging’ provided by the ADF. At that time, I made some connections via social media with the originating unit, the DoD contractor involved, and so on.
The released image was of poor resolution (heavily compressed & scaled to 600×800) and depicted mostly low scud cloud. Given the image annotations, I think it’s a sound deduction that the image was acquired using the Wescam MX20 onboard USN P-8A Poseidon 168429 noted by AMSA as deployed on March 21st 2014.
Previously, at this blog, there’s been discussion about what considerations drove the search to the various, separate, areas. Your image was located in an area overflown between March 20th and 27th. It’s questionable whether the full significance of the 00:19 satcom event and, so, the 7th arc was understood on 21st March. It’s my understanding that Inmarsat only completed their work concerning the BFO on Friday 21st (UK time). The detail and significance of all available evidence had not been established on Friday 21st March, communications between Malaysia and Australia (and other parties) had initially been ineffective.
@Niels “M0.84 in combination with CTT189 works well with the BTO data”. Thanks for that. At the higher altitude with ISA +0 and true track, this path will doubtless end a long way further north thank my area of interest – somewhere in the 37S vicinity, I guess? Despite being more attractive from a fuel feasibilty perspective, I don’t hold out any hope for the region 37-39S based on the extensive search of that area.
@Stuart. I reviewed availability of high resolution optical and synthetic aperture radar (TerraSAR-X) imagery on public domain catalogues https://www.intelligence-airbusds.com/geostore/ and contacted the German academics who commissioned/tasked and analysed the SAR imagery. They reported having detected nothing of interest. There was also some low-resolution SAR that, I understand, is capable of picking up fuel slicks but certainly didn’t have the resolution required to detect solid debris. Are you referring to classified imagery that isn’t included in the public catalogues?
@Don Thompson
Yes, synthetic aperture radar, typically utilized for imagery collection in situations where cloud cover precludes analysis, such as the initial phase of the MH370 search.
Regarding the EO image, I recall the raw image was most likely a National Systems classified image, mostly cloud-covered, but luckily did reveal possible crash debris, as can be seen on the released image. I think the compression that you refer to was an effort to reduce the size of the file and to enable faster transmission of the declassified GEOINT product.
As mentioned in a previous post, high altitude surveillance narrowed the search area, before any knowledge of INMARSAT data used to determine the 7th arc. In any event, the who what where when how why litany is likely to go unanswered unless appropriate authority decides to release further information.
@Paul Smithson
As you may surmise, there is a great deal of information regarding missing flight MH370 that remains classified – certainly there was/is SAR imagery relevant to the MH370 search that falls into this category. Concern over Operational Security (OPSEC), whether it is real or imagined, has prevented the review and release of information. Hopefully more requests will be made and granted. It is ONI and other’s call and they don’t appear to be in any hurry.
@Stuart.
Yes, the EO (electro-optical) image released by the ADF, into the public domain, was classified using “National Systems” criteria. ADF did not redact any marking from the image. I cannot establish when the rescaling or compression was performed but the delivered image quality rendered it useless. An example is that pixel level artefacts bleed out from (your?) annotations into the scene.
As I recall, the ADF release included a PDF document in which your IGD/500th MI BDE image had been embedded, I extracted the encapsulated image from the PDF (note to self, must relocate find that PDF, and check whether the PDF encapulated in PPM or native JPEG). Back in Nov 2017 I posted all images released by the ADF under FoI procedure to a Flickr account.
You use the opaque term “high altitude surveillance“, I assume you’re referring to “an expert assessment of commercial satellite imagery on Thursday. The images were captured by satellite. They may not be related to the aircraft. The assessment of these images was provided by the Australian Geospatial-Intelligence Organisation as a possible indication of debris south of the search area that has been the focus of the search operation. The imagery is in the vicinity of the search area defined and searched in the past two days.”
Thursday = 2014-03-20, “the past two days” would be 19th and 20th March. Per AMSA’s Media Release of 2014-03-20, 1530 AEDT.
The context is important in considering the weight one should attribute to any particular piece of information.
Is there anything that might further add to the information above, that is:
Australia accepted the task of leading a search mission over the southern Indian Ocean, aircraft were first tasked within the Australian search & rescue region on 2014-03-18
The AGIO analysed commercial satellite data.
Satellite data acquired and/or collated after China’s invocation of the Disaster’s Charter on 2014-03-11.
The AGIO analysis informed the aircraft tasking directed by AMSA’s RCC.
Malaysia was slow to act on the support offered by others in the air accident investigation domain, UK-AAIB, NTSB, BEA and normal technical representatives engaged by those organisations.
@Paul Smithson
I’ll check CTT190 and CTT191 as well (hopefully later today)
@Stuart / Don T.
I think it prudent to distinguish between radar detection and radar identification. Small vessels often use a corner reflector to enhance their radar cross section for detection in areas prone to fog. Likewise with SAR. Corner reflectors are often placed at surveyed positions to allow easy and accurate SAR image registration.
I think the detectability of small pieces of debris has little to do with the spatial “resolution” of the radar.
@paul smithson, Niels
I would like get some buy-in from DrB. on the fuel situation, if only to reduce the issues outstanding.
Can you comment on the possible interpretation of the BFO data associated with the 5 minutes post 1st arc. Could it be climb/descent as well as turn?
There is probably not enough data to be definitive.
@paul smithson
You have concentrated (as I have) on the path prior to about 00:19. Why do you exclude the possibility that there was a glide? The argument that it results in too large a search area is merely an acceptance of the current state of knowledge. Perhaps if we examined the geometries after 00:11 more dispassionately we might make some further progress.
@Paul Smithson
The key latitudes I find for M084, FL390 are the following;
CTT, lat1941, lat 0019:
189, -2.03, -38.69
190, -2.62, -39.14
191, -3.16, -39.52
Depending on air conditioning packs on / off the calculated 19:41 weight is 201.75 / 201.30 tonnes (fuel exhaustion at 00:17:30).
Perhaps the @DrB, @Richard or @Victor is willing check the calculated fuel consumption and weigh in on the feasibility considering the fuel required at 19:41?
I didn’t check if these 19:41 latitudes can be reached in a relative fuel efficient manner after an early turn south.
The BTORs look reasonable to me. The BFORs don’t look great, but cannot be used to reject these paths based on our limited knowledge of possible oscillator drift.
Imo the main argument against these southerly 00:19 latitudes would come from the drift analysis.
@Don Thompson
USN Navy P-8 aircraft and other platforms did locate possible wreckage of MH370 well south of the calculated LEP, but they probably needed guidance as to where the search should be conducted. Severe weather and dense cloud cover precluded the earliest search efforts in the Southern Indian Ocean. The ideal surveillance platform for this type of mission needed great endurance/capability to provide surveillance over large geographic areas, provide near real-time intelligence to decision-makers, possess the agility to rapidly alter flight plans, and fly above severe weather while remaining on station. There was/is an aircraft in the US inventory up to the mission: enter the dragon (lady).
@Stuart
The “dragon lady” routinely landed in Litchfield Park, Az, and stuck her nose through a wall at our Goodyear Aerospace facility. We installed side-looking radar on it. There were always a few people around from Luke AFB with scary black rifles who discouraged us from going outside and looking at the aircraft.
@stuart,
And, BTW, we all had “top secret” security clearances. We just lacked a “need to know”. Crazy shit.
The U2 Seasat Program is something I spent a lot of time on. To this day, I have no idea how it worked out.
Hi Niels,
I’m interested that your CTT paths end so far south.
My GC path Arc 2 1941 is at -2.54 Arc 7 -39.74, initial bearing 190.72 (at 1833)
I’m at FL340, M0.84 and fuel is at least half an hour short, probably more so no amount of marginal adjustment for packs off, reduced electrical load etc is going to get you there. Bobby has answered the question numerous times and is adamant that it isn’t doable. Last response I had from Richard on the same subject, his fuel numbers looked a good deal more favourable (but still not feasible) and I never understood the reason for the substantial difference between RG and BU fuel results. If their fuel models are in basic agreement there must have been a fat finger somewhere.
I think the only thing that will get you this far south on my preferred model is an idle descent or unpowered descent. That wins you +22-27 minutes in the air, but then you need to explain the final power-cycle.
For FL380, I ended up at M0.86ish to get best BTO fit. I don’t understand how you can do it at FL390 M0.84 where ISA delta will be 0. What do your BTO residuals look like?
@stuart
An introduction was made on my behalf, and I had a long conversation with two senior staff at AMSA, one who led the Rescue Coordination Centre during the MH370 search. They did state that radar was expected to be of very limited benefit in the surface search as it was accepted that any floating debris would be non-metallic, composite material.
The air operations seemed to rely heavily on Mk.1 eyeball rather than their radars.
Recalling your comments about MAD, not so far up this comment thread David referred to the BEA (French air accident investigation organisation) investigation into an engine LP fan disintegration that occurred on an Airbus A380 over Greenland. The report describing the search for the parts shed by the engine is a good read. MAD was quickly discounted, even when the targets were expected to be not more than 15-20m under the snow in Greenland.
@DennisW, responding to a couple of your posts
There are multiple reasons why the U-2 dragon lady is still flying missions today, over sixty years since it became operational. I had the good fortune to see it fly and analyze the imagery collected by the U-2 while working at Beale AFB. The U-2S is particularly ominous-looking, when configured for longer missions having multiple underwing fuel cells attached and a large tearsrop-shaped SATCOM pod fixed above the fuselage. There are some constraints wrt takeoff and landing, crosswind restrictions, and needing wheeled outboard wing support struts for takeoff and chase vehicle trim pilot assist upon landing. Thus the suitability of divert fields is more critical than P-8 aircraft. Staging out of Western Australia was likely a challenge in this respect.
There is no doubt that the classification of information and where/how /who has access is complicated. I’ve worked in SCIFs that required TS/SCI clearance to enter and had additional special program need-to-know access controlled spaces within. The only progress I know of regarding classified information access is that the clearance process no longer requires periodic reinvestigation at five years but instead runs continuously as long as one behaves according to “the rules”.
The SAR images from the initial MH370 search were difficult to analyze due to the rough sea state that caused diffused reflection. There were bright returns/glint indicating mostly irregularly shaped solid objects floating in the ocean. I didn’t see starlike “twinkles” (multi-bounce returns) that I would commonly see when looking at land-based objects and surface vessels. Very unexpectedly, in the earliest phase of the search I did observe streaks indicative of rapidly moving object(s) occurring between the SAR collection platform and the ocean surface several days before aircraft and/or surface vessels had entered the search area.
@Stuart
Very unexpectedly, in the earliest phase of the search I did observe streaks indicative of rapidly moving object(s) occurring between the SAR collection platform and the ocean surface several days before aircraft and/or surface vessels had entered the search area.
Please expand on, and illuminate that most fascinating remark.
Are you suggesting, that someone was (perhaps) already “looking” down there “between” 8Mar and 15Mar 2014 ?
@Niels
Can you clarify where you start you path? Is it at 19:41 and, if so, what prior path are you assuming?
@ventus45: I think @Stuart is saying he observed streaks that appeared to be created by craft travelling “abnormally fast”…
@Stuart: Have you observed streaks of this nature before? Have others?
“I did observe streaks indicative of rapidly moving object(s) occurring between the SAR collection platform and the ocean surface several days before aircraft and/or surface vessels had entered the search area.”
That’ll be those pesky aliens again.
https://www.youtube.com/watch?v=PkPn-YMp9vI
The streaks observed on SAR imagery are indicative of fast-moving objects, also occasionally of processing errors. Most notably, these streaks have been observed on SAR images of areas with military activity in the Middle Eastern countries Iraq Iran Afghanistan with subsequent visual sightings by ground personnel corroborating rapidly moving aircraft of unknown origin.
Paul Smithson’s humorous comment about “That’ll be those pesky aliens again” (referring to the unknown craft observation and attempted intercept by USN F/A18 pilot CDR David Fravor and other pilots) might explain the streaks seen on SAR images. I don’t think unknown entities had any role in the MH370 disappearance, other than possibly conducting surveillance. Perhaps said entities are observing our patterns of behavior: routine flights of pilot-controlled aircraft experience failure and plunge into the ocean; aircraft appearing under control, yet flown into buildings, causing mass destruction and casualties; ultimately why outwardly similar-appearing creatures are continually engaged in hostile acts against one another. Any visitor would wisely consider us to be a threat and avoid contact, yet allowing themselves to be seen occasionally is probably not coincidental.
I have for some time held the view that the search based on the Inmarstat work was somehow flawed and that the routing after last mil ident continued West and not South.
I have not seen any commentary about the erratic flight profile after the IGARI turn. Surely if it was intended to make the aircraft vanish then why draw attention to oneself. For what reason would an experienced pilot have flown the aircraft in such an erratic manner, especially by a highly experienced and competent pilot. I` d say whoever it was, he/she did not fit that category. It would seem the aircraft was flown rather badly. It remained on a Westerly course towards the African coast and terminating well short of making land fall there.
Simply a hijack scenario that did not succeed for the perpetrator(s).
@Tony: There is a misconception that the military radar data demonstrates a high bank turn. Some of us here have shown that the military data points from the SIR, when azimuth error is introduced, are not inconsistent with a turn using the HDG SEL mode of autopilot.
There is no evidence that the Inmarsat data, and our interpretations, are wrong. The same techniques were used with success on other test flights.
@Paul Smithson
Please follow the link to see the BTORs for CTT189 – CTT191
https://www.dropbox.com/s/muuzj6jjlol4z1t/ResultsCTT189_191.pdf?dl=0
(orange column “BTOR_path”)
The table also shows dT_ISA; I typically find +2 – +3 K for FL390
I’m not sure why you need about M0.86. What is your track towards 00:19?
@Sid Bennett
Currently I typically start path calculations 1800 s after 18:22:12 (for many years I use this strange time base where t = 0s corresponds with 18:22:12).
For fuel estimates before 19:41 I rely on the tables given by Ulich et al. for different possible scenario’s in the 18:22 – 19:41 time interval.
For the “far south” paths it might be interesting to explore a scenario where there is a single turn in the 18:30 – 18:35 interval towards a fixed CTT, M0.84 setting, with a TT close to 190 deg and FL close to 390.
@Niels. Thanks for responding and sharing your numbers. I don’t have time this weekend to study them in detail and ascertain the key differences. You are achieving fit with substantially lower GS, so I can only conclude that for given azimuth you must be starting further south on Arc2. I note that your BTO residuals are also quite a bit bigger, for RMS 37 (arc2-6) compared to ~19 for my preferred paths, which all commence at a simulated end-of-FMT at 18:33:20 +/- 5s. The GC path tracks increasingly W as it proceeds, so the track is at about +3 degrees by the time you reach 0019 (193.9) compared to initial azimuth at 1833 (190.7).
@Paul, Neils, UGIB,…
Your preferred paths after the FMT all endorse the murder-suicide scenario. None of you actually admit to that, but there is no other possible conclusion. I cannot warm to that, so I don’t. There was much fuel and many options still available at 18:40.
@DennisW
I find this a strange accusation. I don’t see how exploring a certain path based on the data would “endorse” this specific scenario.
Furthermore: I don’t have a prefered path. I’m exploring paths mostly focusing between S31 and S36 (00:19) based on what I see in the sat data as well as what we learn from the drift analysis. Some of these paths have a kink; some have not.
I think I have been rather consistent in refraining from speculating about specific scenario’s. And not only for ethical reasons: speculating about what happened on board MH370 imo will not help us to locate the wreckage. Perhaps even at the contrary: It will easily lead to tunnel vision.
Hi Dennis. Like Neils, I don’t impute a motive but I have to agree that a motive needs to be explained if the plane was deliberately piloted to oblivion. For a long time I clung to the notion that there might be an “innocent” explanation – like a route discontinuity after an attempted approach to Banda Aceh. However, the BTO path fits from such a scenario simply aren’t good enough for any control/navigation mode.
I have belatedly reached the conclusion that others did a long time ago, that the path was most likely “straight”, which also implies deliberate navigation. Between the two nav options, I prefer LNAV to TT because of the niche use case of the latter. At the conclusion of my route modelling efforts I realised that the predicted route corresponded with IGEBO-RUNUT, in which case the former might have been used to assure clearance of the Sumatra landmass. It certainly appears that the turn was timed to occur immediately after passing the NW extent of Sumatra.
I find it very difficult to ascribe murder-suicide to Z based on what we know of his character. The only hypothesis I have heard that made any sense to me was a psychotic crisis, brought on by chronic concealed dependence on powerful painkillers associated with the historic back injury.
@Tony
I would say there are two competing visions at IGARI: (1) autopilot per Victor above, and (2) most/all power was off, so it was manual flight. If it is was the latter, I would suspect one of the reasons might be to at a least temporarily depower the black boxes. Another reason might be to allow sharp turn, to fool the radar operators, and other maneuvers.
Satellite data looks good to me…I am not an aerospace expert but I have worked with lab data all my life. I feel like I am working with good quality experimental data. If I suspected it was questionable data, I would not have much interest in working with the data.
@Niels
I find this a strange accusation. I don’t see how exploring a certain path based on the data would “endorse” this specific scenario.
How can a path nearly straight South with no opportunity to land the aircraft be ascribed to anything but a murder-suicide scenario? Give me any other plausible explanation. You are clinging to the early “Duncan days” where it was verboten to consider motive at all.
I think I have been rather consistent in refraining from speculating about specific scenario’s.
Yes, that is my point. You don’t have to speculate. Your path selections say it very clearly.
@DennisW
I’m sorry but I don’t join the speculations, to fill in for your lack of imagination. If the data suggest no human input after a certain moment in time: Imo this tells us very little about the possible sequence of events on board, as well as who is responsible.
In my main work I follow as much as possible a data driven approach by combining BTO and BFO, where some of the paths generated show maneuvering as late as around 21:00. I don’t care if that is “old school” or not.
@Niels
On 19 Oct, I posted my agreement with @paul smithson regarding a track beginning at about 190.5T at 18:33. But, I doubted that, according to current fuel models, that there was enough fuel for this track to be feasible. It appears to be about 500kg short.
I do not see how you can use DrB’s fuel model prior to 19:41 as it has some climbs and descents, and a different track length than a straight path.
@DennisW
My conclusions are based on conformance to the satellite data and current fuel model and not on any”motive”. The only scenario I had a hard time with from almost the beginning was the on board accident. A Modive may be useful in hypothesizing a flight plan after00:11.
@paul smithson said: I find it very difficult to ascribe murder-suicide to Z based on what we know of his character.
There is nothing that we know about the captain that would conclusively point to his guilt. However, the sudden break with a woman and her family that he had grown close to, his reckless online behavior, his strong disgust for contemporaneous political events and corruption, and the simulated flight to the SIO all suggest he was very unhappy, frustrated, and had potentially planned this act.
@Niels
I am not being critical of your work. I think it is useful to consider what it strongly implies, however. BTW, I do not suffer from a lack of imagination. If you have conceived a different conclusion for a straight Southerly path, and do not want to share it, that is your choice.
I have the simple minded belief based on a long exposure to humanity, that people do things for a reason convoluted as that reason sometimes is.
@Paul Smithson. Fuel left-overs. Don Thompson and I have discussed this and he continues to look into it.
He remains of the view that improvements in the accuracy of fuel measurement have reduced the indicated quantity variations with attitude and aircraft acceleration; and that, as he has said, the addition of 3,000 kg of ‘company fuel’ will overcome the need for the FQIS zero to be set at other than loss of boost pump suction, aircraft level.
My view and I think yours is that allowance is required by CFR’s for some fuel being inaccessible by engines when the aircraft is non level or acceleration changes. That is called for by CFR §25.959, this increment then being considered ‘unusable’.
CFR §25.1337, ‘Powerplant instruments’ at (b) reads, “(1) Each fuel quantity indicator must be calibrated to read “zero” during level flight when the quantity of fuel remaining in the tank is equal to the unusable fuel supply determined under §25.959;….”
While fuel measurement has improved, so far as I know these CFRs have been neither rescinded nor waived and there can be variation still, I would think, in the fuel accessible with changing aircraft attitudes and acceleration.
I think this should be included in the basic weight calculation since otherwise gross weight will be understated. If it is, Don’s 79.56 kg of ‘drainable unusable’ that he found was listed in the Asiana 777-200’s basic weight, might include it; though that would leave it small.
If so, your possible 300 kg of left-over fuel would be reduced substantially and also some doubt would be cast on the 156 kg of “unusable” in the -300 that you identified. Don has said this may be a planning figure*.
Confirmation that the CFR requirements are inapplicable to the 777-200ER or knowledge of the check calibration process would resolve this but, saving that, there is uncertainty. However if it is included in the Asiana basic weight as above then most likely it would be small in 9M-MRO’s.
*(Also about that 300 kg total, it is unlikely that the approx. 100kg from a late manual scavenge of the centre tank would be available if already scavenged automatically, as per my Oct 24thpost.)
Incidentally by my reading, the forward boost pumps, ie drawing from forward in the main tanks, do not come online in flight unless selected at aft boost pump failure. Thus any forward fuel remainder at aft pump failure would remain unaccessed without that selection, though some might be accessible later to the APU DC fuel pump.
@David wrote “Incidentally by my reading, the forward boost pumps, ie drawing from forward in the main tanks, do not come online in flight unless selected at aft boost pump failure.”
FCOM states, for the start procedure
“Fuel panel….Set F/O
LEFT and RIGHT FUEL PUMP switches – ON
Verify that the PRESS lights are extinguished.
If there is fuel in the center tank:
CENTER FUEL PUMP switches – ON”
That’s fwd and aft boost pumps, L and R. Both are set on, so that should one fail in flight there is no interruption in pressurised flow to the engine feed manifold.
@Victor
There is nothing that we know about the captain that would conclusively point to his guilt. However, the sudden break with a woman and her family that he had grown close to, his reckless online behavior, his strong disgust for contemporaneous political events and corruption, and the simulated flight to the SIO all suggest he was very unhappy, frustrated, and had potentially planned this act.
Yes, it certainly appears as you describe. My disconnect with a murder-suicide scenario involves Tim Pardi. What roll did she play in his life, and was she an influence in the diversion? ZS’s collapsing home life is questionable, and I still categorize him as a Malaysian patriot. Too many questions, and too few answers.
Perhaps better (and easier) to focus on the analytics. We have no way I know of to make progress on the personal or political issues. I will get off it.
@Don Thompson.
The training manual says,
“Left Transfer Bus Power
The left transfer bus is an alternative power source
for the left forward boost pump. The left aft boost
pump switch must be off for the forward boost pump to
receive power from the left transfer bus. This prevents
both boost pumps from operating when the backup
generator is the power source.”
In the above context the forward boost pump’s usual power supply is ground power.
The right pumps are described as similar.
Fair enough the selection needed is in fact the aft boost pump off.
As it stands I believe the point remains that I alluded to, that with no pilot, forward fuel would be unavailable to the engines.
I think we have reached a critical juncture.
It was either a ghost flight from soon after the FMT, or it was not.
We can’t have it both ways, it is that simple.
It is pointless discussing switching fuel pumps on and off etc if there was no one there to do it. If we accept that there was someone there, fuel games are possible, but it is also fair to accept that the supposed someone, if there, did not just sit there, for four hours plus, and do nothing, flight path wise, either.
If that someone was there, he was there for a reason, he had a motive, that was reflected in an objective, that he wanted to reach, so, as he flew south, through variable wind fields and temps, he would have “tweaked” his path as needed, a few degrees left or right, here and there, he might even have climbed a bit, or desceneded a bit, looking for better winds, and he might have done so multiple times.
Those who subscribe to the ghost flight are attempting to rule out paths on the basis of a few dozen kilos of fuel, which seems a little silly to me. Looking for “one stable path” (mode, etc) that fits a whole slew of very restictive parameters simply isn’t working. It hasn’t been working for years. Isn’t it time to acknowledge that ?
Consider Vulcan XM607.
A mission, with a specific objective, a pinpoint target, and a long way to go to get to it, through variable and poorly forecast weather, in an aircraft with less computerised nav capability than a 777, (even though it had an INS from the old VC-10’s bolted in at the eleventh hour) but, with two very smart, thinking, human navigators, in the back. They made landfall less than a mile from where they wanted to be. A bloody fantastic effort, given the circumstances. The rest is history.
I have studied Black Buck One extensively over the last few years. I am betting Z, a known consumate av-geek, probably did too.
@Ventus
If that someone was there, he was there for a reason, he had a motive, that was reflected in an objective, that he wanted to reach, so, as he flew south, through variable wind fields and temps, he would have “tweaked” his path as needed, a few degrees left or right, here and there, he might even have climbed a bit, or desceneded a bit, looking for better winds, and he might have done so multiple times.
So what do you suppose was the objective? What motive created the path South?
@ DennisW
As others have said, Z was an isolated man, disillusioned with the world of politics, his personal life was falling apart, and he was fearful that he would not pass his next medical, and would be grounded, which would destroy him.
Taken all together, it was time to act.
The objective is clear enough, S1 and S2 told us that.
S3 was 45S 80E.
I have to run – lunch with friends at 13:00 Lima (utc+11)
@David
@Don Thompson
RE: “…the addition of 3,000 kg of ‘company fuel’ will overcome the need for the FQIS zero to be set at other than loss of boost pump suction, aircraft level.”
Perhaps I’ve misunderstood your comments, but I don’t see how ‘company fuel’ affects the zero fuel set point. MAS defines ‘company fuel’ as: “fuel to cover specific operational requirements.” It’s simply extra fuel the company adds to the minimum statutory requirements to cover contingencies such as ATC holding at specific ports. In the MH370 case, the fuel analysis section of the operational flight plan included 3,000 kg of company fuel, presumably to cater for the delays that often occur when operating into Beijing. That fuel may be used, if necessary.
The zero fuel set point is defined by 14 CFR § 25.1337, as David mentioned. It is not affected by any fuel reserves the aircraft might be carrying.
@David
RE: “In the above context the forward boost pump’s usual power supply is ground power.”
The forward pumps are normally powered by the ground service bus, which is powered by the R main AC bus. If R main AC power is not available, the ground service switch can be used to directly power the ground service bus from either the primary external power or the APU generator.
RE: “As it stands I believe the point remains that I alluded to, that with no pilot, forward fuel would be unavailable to the engines.”
I don’t see your point. Both boost pumps in each main tank are normally running. The forward boost pumps are powered by the R main AC bus via the ground service bus. The aft boost pumps are powered by the respective transfer bus. The aft boost pump switch does not need to be selected off for the associated forward boost pump to run, assuming R main AC bus power is available.
@Andrew. I leave your first for Don.
As to the second it seems common sense that the forward boost pumps would be powered in flight so I was surprised to come across that TM passage I quoted, from 28-22-00 p104. That and the circuit diagrams have the boost pumps powered by the transfer buses. The first paragraph of that page says, “The left forward boost pump receives 115v ac power from two sources: the ground service bus or the left transfer bus.”
Most likely I misunderstand it but the paragraph I quoted says the aft boost pump switch must be off for the forward to come on line, without any qualification or embellishment other than an explanation of why.
Instead of the manual switch-off I supposed is this automatic maybe? Yet low pressure just seems to result in a warning light; also p104.
@Andrew. On second thoughts your, “The forward pumps are normally powered by the ground service bus, which is powered by the R main AC bus.” That explains it thanks.
@David
RE: “Most likely I misunderstand it but the paragraph I quoted says the aft boost pump switch must be off for the forward to come on line, without any qualification or embellishment other than an explanation of why.”
The paragraph says:
“The left aft boost pump switch must be off for the forward boost pump to receive power from the left transfer bus.”
If the ground service bus is powered, the L FWD fuel boost pump switching relay is energised and power flows from the ground service bus to the L FWD boost pump, via the L FWD fuel boost pump control relay (assuming the pump is selected ON).
If the ground service bus is NOT powered AND the L AFT boost pump is selected OFF, the following occurs:
– the L FWD fuel boost pump switching relay is de-energised, and
– the L FWD fuel boost pump transfer relay is energised.
Power can then flow from the L transfer bus to the L FWD boost pump.
A picture paints a thousand words:
L FWD Boost Pump Control
@Andrew. Thanks for the added explanation.
@ventus said: If that someone was there, he was there for a reason, he had a motive, that was reflected in an objective, that he wanted to reach, so, as he flew south, through variable wind fields and temps, he would have “tweaked” his path as needed, a few degrees left or right, here and there, he might even have climbed a bit, or desceneded a bit, looking for better winds, and he might have done so multiple times.
When using the LNAV mode of the autopilot, there is no need to “tweak” his path, as the GPS inputs provide for precise navigation. As for step climbs, he could have climbed to FL400+ at 19:41 with near optimum fuel mileage. There was no need for manual inputs to fly as far south as possible.
My guess is he chose a painless, hypoxic death while suffering from decompression sickness from a deliberate depressurization earlier in the flight, but that is only a guess.
Andrew,
Thank you for contributing on the fuel pumps, precisely the detail that I’d intended to convey but turned away for sleep rather than composing that reply.
The discussion, mostly between David, Paul S & me, concerns on the quantity of fuel that may remain to ‘slosh’ in the tanks when the measured fuel quantity is consumed, and that a non-level attitude may appreciably alter volume available for pump uptake.
My view is the state FQIS = 0, when the aircraft is level, leaves only fuel that cannot be ingested by the boost pumps, the boost pump delivering fuel to be consumed by the engine or complete the defuel procedure. Establishing FQIS=0 is a simple procedure, complete the defuel the aircraft. The unusable quantity remaining at FQIS = 0 is measurable by draining down via the tank sump valves but that is negligible. The weight and balance report concerning HL7742 measured all unusable drainable fuel as 80kg (a 777-200ER, all tanks). Considering the geometry of the tanks in the rib 8-9 void, and the position of the boost pump inlets (as we have before), leaves little/near zero likelihood for the inlets of the boost pumps to scavenge any appreciable fuel when FQIS = 0.
Ultimately, this discussion seems grounded around US CFR statements concerning compliance and mitigations for fuel uptake in non-level attitudes, e.g. a go-around, and FPFM considerations where an intent is to avoid high risk, low fuel levels. My view is that performance and procedure delivers the risk mitigation rather than fuel tank design.
@Ventus45
What are S1,S2, S3? S3 sounds like a westerly waypoint.
There is only a single item of factual evidence. It is the last radar trace. The Intrasat`s data analysis is theoretical. It is entirely reliant on ACARS and the total acceptance that the system operated as shown on the package.But can electronic data transmission be interfered with. After all the only other single piece of factual evidence is that despite its ingenuity the Intrasat technique has failed to produce a single shred of evidence as to the location of the aircraft. That alone I believe calls for a new method for a search.It was tried, at great cost, it did not work. What is the use of continuing with it.
I remember a case of corporate fraud, maybe some 40-50 years ago, which involved a life insurance company, States side, where for the sake of maintaining its stock value, the whole company became engaged in creating false lives. When the auditors checked to confirm their veracity in various offices around various states, the switch board operators put the calls through to staff members who could mimick the appropriate accent and dialect of that particular state to which the enquiry was being addressed.
I therefore tend to think along the lines of a similar scenario for the ACARS pings. Is it not feasible that interrogation signals transmitted to the aircraft received by the ground station may have been diverted to another to then respond as if they were from the aircraft but from a false position.
Perhaps the answers lie on terra firma and not at the bottom of the Indian Ocean.
@TBill
S1 S2 were the simulator end points 45S 104E.
S3 is my designated LNAV final waypoint that I think he was heading for.
He knew he was coming up a bit short fuel range wise – which is why I think he would have been actively “milking” the fuel – ie climb / descend here and there
@Don Thompson
Thanks Don. Given the definition of ‘unusable fuel’ in CFR § 25.959, it seems to me that FQIS=0 must include the fuel required to keep at least one boost pump inlet covered with fuel at all aircraft attitudes that are likely to be encountered in normal operations. There are flapper valves at rib 10 that prevent fuel flowing away from the boost pump inlets when the aircraft is manoeuvring, so any increase in unusable fuel required to cater for manoeuvres under CFR § 25.959 will be small. There certainly would not be enough ‘extra’ fuel to satisfy Paul Smithson’s scenario.
Of course in normal operations the fuel quantity should never approach FQIS=0, because aircraft are required to land with at least ‘final reserve’ remaining in the tanks. Final reserve is defined as the fuel needed to hold for 30 minutes at 1,500 ft overhead the destination or alternate airfield.
@Ventus45
OK I see, but we are still unsure what the pilot’s simulator cases may imply, but seems like a stretch to say it is somehow logical that the pilot would have changed the simulator flight plan to 45S 80E waypoint (approx 187-TT). If anything the BTO/BFO data reasonably strongly support that MH370 flew in the general direction of the actual home simulator cases, possibly crossing Arc7 in a similar region (30-32 South region).
For example, DrB’s prior 2018 pin at 31.5 South was a passive 181CMT MRC flight, in my mind almost perfect BFO fit, assuming a minor drift trend in the BFO. I would probably put an active pilot in the cockpit, I agree with you there.
I am recently re-focus again on the simulator work, realizing belatedly this is yet another area where authorities (ATSB in 2017) disclosed that they had more “complete” data sets than the public.
@Tony
Fallacy #1: “[Inmarsat’s analysis] is entirely reliant on ACARS“.
There is no reliance on ‘ACARS’ after 17:08UTC. None, whatsoever.
Fallacy #2: “[Inmarsat’s analysis relies on] total acceptance that the system operated as shown on the package“.
The AES, onboard 9M-MRO, actually demonstrates an anomaly during the signalling sequence at 118:25UTC and 00:19UTC. That anomaly is well understood.
Fallacy #3: “[Analysis of Inmarsat’s data] failed to produce a single shred of evidence as to the location of the aircraft.”
The deduction that the aircraft crashed in the vicinity of the 7th arc in the southern Indian Ocean, let’s assume the UGIB LEP, led oceanographers to advise independent researchers to search on the shores of the western IO where they found more than 30 pieces of debris attributable to, in all likelihood, 9M-MRO. While I accept the oceanography doesn’t offer discrimination for a single source, taken together with other factors it does help fix an area of impact.
Without a “single shred of evidence” from Inmarsat, the RMAF may not have looked at their radar recordings, leaving only the DCA civil radar to illustrate a trail that went cold at 18:01UTC.
Searching the seafloor at depths, typically, exceeding 3500m is difficult, very difficult. That you assume certainty in the discrimination of the target, within in the area of interest, is another fallacy.
@Tony
In addition to Don’s comments, the use of radio frequency ranging and Doppler shift has an unblemished use pedigree. The math is well understood and the physics is simple. Unfortunatey the data we have does not constrain the crash location with precision.
Don , Dennis, thank you both for your responses.
Given that the data analysis is based on the on board SDU, that the powering down and its subsequent powering back up remains much of a part of the whole mystery, the controversy and the debate thereon, my curiosity remains focused on ground interference with the system as a whole. In particular with the timing and sequence of the factually established events. Why light up the aircraft, albeit with a tiny pocket torch, to shine towards a Southerly routing heading to the South Pole. Could this not be a reason to divert any search to that area, and well away from its intended true destination. Is there no scope for thought outside the box. Especially where nothing has been found in it.
I suppose it is a bit like David Copperfield`s magic trick of making the Statute of Liberty disappear. He just changed the perspective of his audience.
@Tony
Ideas of “ground interference“, as you put it, have been comprehensively discussed here. They certainly haven’t been avoided.
If there was an alternative, true, destination isn’t that the zenith of elusive? So absolutely elusive, that any effort expended on a decoy plot would seem unnecessary and prone to a leak.
@Andrew,
It’d be good to be definitive about how FQIS=0 is reconciled with “the fuel required to keep at least one boost pump inlet covered with fuel at all aircraft attitudes that are likely to be encountered in normal operations“.
The idea that regulations require some design mitigation to avoid a scenario that would be the consequence of deficient execution in operations is something of a paradox.
The FCOM QRH states that fuel considered as reserve must be increased by 200kg if both boost pumps on a main tank are unavailable. i.e. engine fuel feed is reliant on suction draw. From previous discussion the suction feed uptake is stated to be at a higher level than the boost pump intakes. Yet no reconsideration of reserves is necessary if one or other boost pump fails.
Moot, perhaps, as Paul himself can’t reconcile fuel-distance-time for his scenario.
@Victor
I just reminded myself how easy it is to transfer money these days. Transferred a wad from my brokerage account to the banking account listed for all my autopays (just about everything including Apple Pay). Took me 2 mouse clicks and entering an amount. Total time about 30 seconds. Transfer instantaneous.
I am still convinced the diversion involved a demand that Najib return a $1B or so of the money he defrauded from the the 1MDB development fund.
@Don
The regulations seem quite explicit on that point, but I think it’s somewhat academic. In my view the tank design (ie flapper valves at rib 10, pump inlet locations) mitigates against a large increase in unusable fuel to satisfy CFR § 25.959. In this case the increase (if any) must be small enough to be inconsequential, and less than the smallest increment (100 kg) that can be displayed to the crew on the EICAS.
As to the ‘paradox’, there have been plenty of low fuel emergencies over the years, despite the statutory requirement to land with the final reserve intact! I guess the regulations act as something of a ‘backstop’ if the fuel ever reduces to a critically low level. Nevertheless, some of the requirements stipulated in the regulations have little practical relevance in such situations.
Andrew, Don,
It has been good to see you two put some illumination on the likely limitations upon fuel storage variabilities that may apply to the fuel carried by the aircraft.
And,
David,
Thank you for returning an analytic approach to a subject which was tending to delve into speculative unknown sources of extra fuel availability.
Don, you say: “The FCOM QRH states that fuel considered as reserve must be increased by 200kg if both boost pumps on a main tank are unavailable.”. Wonder if this stipulation is simply an allowance for the possibility of interruption to delivered fuel flow when fuel tankage is low and “suction draw” may be adversely affected by aircraft motion.
@Tony,
Let me also state that the analysis of the satcom communications metadata shows consistent agreement with theory and is also consistent with later analysis of fully documented flights of 777 with the same communications equipment.
There are some known uncertainties in the data that have been extensively discussed, but these are small compared with the overall picture.
Unfortunately, as compared with routine flights, there are significantly less communications opportunities and air-ground benchmarks and we are particularly short of data prior to 19:41. More than one plausible southerly path (perhaps 3) exist with excellent agreement to the satellite data and at least two of them are also consistent with the known fuel constraints.
But intentional spoofing of the satcom data would require a degree of expertise and forethought that strains credulity.
@Don
Am fully in agreement with your closing comments. I would however add the perspective called for in this instance is one involving all considerations involved in the “incredible”. Including any link to the 1MDB scandal, which has been suggested in earlier posts. The whole magnitude of that event was also colossal. Possibly the largest fraud in the annals of fraud. That also involved ingenuity, elaborate planning and the vanishing of very large sums of money.
The fuel constraints become of interest only after admitting the precept that the communications networks and systems and their integrity may be relied upon in their entirety.
My question is, somewhere in the computers of Inmarsat, some data was recorded. How certain are we it was transmitted by MH370 during its fateful journey aloft.
@Tony
You ask: “My question is, somewhere in the computers of Inmarsat, some data was recorded. How certain are we it was transmitted by MH370 during its fateful journey aloft.”
The Inmarsat satellite data for the first 26m 6s of the MH370 flight aligned with the ACARS data, sent by the aircraft, until ACARS was disabled.
The Inmarsat satellite data for the first 38m 47s of the MH370 flight aligned with the Civilian Airport and Regional Radar data, until the transponder was disabled.
The Inmarsat satellite data for the first 38m 52s of the MH370 flight aligned with the ADS-B data broadcast from the aircraft and captured by both private and government listening stations, until the transponder was disabled.
The Inmarsat satellite data for the first 1h 20m 6s of the MH370 flight aligned with the Military Airport Radar data, until the aircraft was out of range.
The Inmarsat satellite data for the first 1h 40m 29s of the MH370 flight aligned with the Military Defence Radar, until the aircraft was out of range.
The Inmarsat satellite data for the previous flight MH371 aligned with the ACARS, ADS-B, Flight Plan, Weather En-Route, ATC voice communications and observed time of departure, take off, landing and arrival.
It would appear that the Inmarsat satellite data was working fine for 9M-MRO and can be independently corroborated by multiple sources in real time.
@Tony
“…My question is, somewhere in the computers of Inmarsat, some data was recorded. How certain are we it was transmitted by MH370 during its fateful journey aloft.”
Tony we can probably be about 99.9% sure about Inmarsat recording MH370. We are dealing in probabilities, so we cannot rule out an extreme rare situation.
Within about 24-hrs after the accident, Inmarsat was trying to get word to Malaysia that MH370 continued flying until 00:19. After further analysis, Inmarsat advised an apparent SIO crash site. All of this information has stood the test of time, and as new evidence slowly comes in (debris finds etc) everything has been in near-perfect agreement with Inmarsat’s early understandings about a flight that continued for hours with apparent ending near fuel exhaustion in the SIO.
@TBill
If my memory serves me right, I remember some mention that MA had decided to save costs and subscribed to the basic Sat service for comms only, no position reporting. So whichever way I look at it I am unable to escape from the fact that any actual position was not reported by the aircraft. Inmarsat extrapolated position from electronic data which purportedly was recorded as comms transmissions. As we all know data can be manipulated. As far as I am concerned, in the whole sequence of events, one of the crucially important factors involved is the interruption of data transmissions. Which in itself must be quite a technical feat, involving a considerable degree of ingenuity, technical expertise and know how.
@DennisW: I think a rogue pilot in flight has little leverage in a negotiation to make demands, especially since there was no attempt to introduce public pressure.
@Victor – @DennisW
I think a rogue pilot in flight has little leverage in a negotiation to make demands, especially since there was no attempt to introduce public pressure.
I disagree. Dennis has a valid argument.
If it was linked to 1MDB, (highly likely) a pilot in flight in fact “has the whip hand”.
He has the aircraft.
He has the political / financial hostages.
His partners on the ground are the ones “making the running”, not him.
TimR made it very clear, long ago, that this event, was pre-planned, because he was aware, that (some) people knew of it, in advance.
TimR has not provided details of:-
(a) who knew – and when they knew, or even,
(b) exactly what was planned.
TimR was very reserved in what he did say, but it was clear, that in his view, there was no intention (known to those people) of crashing the aircraft.
The expectation (of those people) was apparently, that the aircraft would land, safely, presumably in Indonesia, and that the “publicity” would be “top of the news” in the morning.
Publicity is key. Wall to wall, “saturation” international media coverage is required.
Landing at some isolated place like Cocos Island, Christmas Island, or Port Headland is never going to cut the media mustard, period.
There was only one place he could land, Inndonesia.
He had a number of Options in Sumatra, but the primary option had to be the Capital, Jakata (seat of Government) in Java.
The “plan” that the Malaysians would have been “fed” by the co-conspirators, would have been “land in Indonesia”.
The Malaysian Government would have been forced to advise the Indonesians immediately, so that MH370 “would not be intercepted” (they could not run the risk of an unintended “shoot down”) that would be a “disaster” for BOTH COUNTRIES.
Remember the Indonesian Police General that was “silenced” ?
We know that the Wechat session occured immediately prior to brakes release, which is megga suspicious (see below).
The aircraft was cleared for takeoff at 16:40 utc and actually took off at 16:41 utc.
We also know, that the aircraft “Supposedly” and “alledgedly” remained within EXPECTED Malaysian (IADS) Military REAL TIME Radar Coverage, for a long time, alegedly until “10nm past MEKAR”.
We also know, that the first ground to aircraft Sat-Call was placed at 18:40.
EXACTLY TWO HOURS AFTER “CLEARED FOR TAKEOFF”.
That is significaant – two hours – PRECISELY.
I think the WeChat session was an advice to co-conspirators – “taking off now – place the demands – the two hour clock starts NOW”.
Looking at it from a goverment point of view, the standard routine is “don’t negotiate with terrorists”.
They would obvious stall on any demands, and play for time, i.e. wait for the aircraft to land, then they can control the agenda.
His coconspirators may be have thought that the government would “cave”, but Z knew that they would not, but he kept that to himself.
Z was a very senior captain. He had seen all of the terrorist hijack events over the years, and he knew how they would be handled by “the authorities”.
He knew that he was heading for the SIO, but his co-conspirators did not.
Z in fact, was brilliant, he “played” everyone.
He “played” his co-conspitators.
But most significantly – he “played” the system. Specifically, he “gamed the system”, by defeating it at it’s achillies heel. The problem with the “no negotiations policy”, is that everyone knows it, and an “insider” (as every airline captain in the world is) knows exatly how it will play out. Z was such an insider, and given that he had the tripple motivating factors I mentioned a few posts above, he had the perfect means to force the issue.
The government fell into the trap that he laid.
It probably was not until morning, when the fuel ran out, when they knew the aircraft could not still be airborne, that they realised that they had been played.
Remember that little “slip-up” (perhaps deliberate) at one of the early press conferences, regarding “sealed evidence”.
Similarly, his co-conspirators were probably shocked, initially thinking that something must have gone wrong, but later (perhaps days later) finally realised that they had been played by Z too.
It is hardly surprising therefore, that those people have “gone to ground” (undeground in fact).
I doubt that we will hear anything further from TimR.
So, a plausible scenario is as follows.
1. Z was known to be politically active for some years, but over time, he eventually became disenchanted with the efficacy of “the political processes”, due to entrenched systemic corruption in the system.
2. Z, like many others, wanted to change things, but they knew that they could not effect change “within the corrupt system”, so they began to entertaine the option of taking “direct action external to the system”, to force change.
3. Z found a number of like thinking souls, and a conspiracy team formed.
4. Z “convinced” them, that he had a “foolproof” plan.
5. Z executed “his plan”, and headed for the SIO, fully knowing that he had “struck a blow” for the eventual fall of the government. He was ultimately successful.
@Victor
Yes, I agree. It is doubtful a negotiation involved anyone on the aircraft. How is it possible to generate public pressure for an event starting at 12:41AM local time. I do not think public pressure was a consideration at all.
@DennisW
To clarify, re Publicity and public pressure
I did say:-
The expectation (of those people) was apparently, that the aircraft would land, safely, presumably in Indonesia, and that the “publicity” would be “top of the news” in the morning. Publicity is key. Wall to wall, “saturation” nternational media coverage is required. Landing at some isolated place like Cocos Island, Christmas Island, or Port Headland is never going to cut the media mustard, period.
Public pressure during the event was not an objective. The contrary is true. It had to be done quietly. Playing this out in the early hours of the morning, when Malaysia was asleep, was deliberate. The world financial system is operable 24/7. There was a 5 hour plus “window” for the necessary transactions for the return of the money to occur. The expectation of the co-conspiartors was clearly that it would happen. Their expectation was that the hijacking would be justified in the public eye in the morning, by the very fact that it did happen. The transaction could not be hidden if it did happen, and that in itself would prove that Najib was a theif, and even though the politiical system would duck and weave, it would ultimately be poliyically damaging, perhaps damagine enough to eventually break Najib and UMNO’s hold on Malaysia. That was the “real aim”, of the co-conspirators, not just the return of the money itself.
@Ventus
Yes. I also believe that the refusal to cooperate with the hijack demand was based on the belief that the problem could be dealt with after the plane landed and covered over by the apprehension of the hijacker(s) and the event labeled as some sort of terrorist activity. Abandoning the plane in the ocean was the only alternative. The “or else” part of the plot had to be exercised in order to preserve the credibility (and anonymity) of the conspirators.
Yes, also on the world financial system. I am constantly amazed by it, and I am far from a major player.
@Tony,
Neither MAS nor the flight crew knew that Inmarsat recorded BTOs and BFOs. In addition, the pilots did not know the AES was queried every hour during inactivity to see if the SATCOM link was still operating, generating the BTOs and BFOs. That was a flaw in ZS’ plan. He thought he could turn south unobserved after clearing radar range. He was wrong, but because both MAS and Inmarsat were too cheap to also record GPS position, the position information is loci on an arc, not a position. So far, the underwater searches have been unsuccessful. I believe we now have a very good case for knowing the crash zone location, but t is unclear when or if another underwater search might occur.
@Ventus45, @Victor
It sounds as though you are entertaining the possibility that Z may have intentionally ditched the 777 in the SIO at the LEP calculated, not because of accident or mechanical failure/non-airworthiness.
There is possible evidence for the above scenario. As mentioned previously, while performing first phase imagery exploitation of high-altitude surveillance of the western coasts of Indonesia, Australia and SIO, I did see streaks on SAR images indicative of rapidly moving object(s) of unknown origin, IVO approx 45S- 40S 90E. These images/data (SAR images being non-literal calculated/produced from MW data) were from approx 09 – 11 March 2014, well before any official search and rescue/recovery had entered the area. Perhaps one could determine the approx speed of said unknown streak-producing objects IF one had the SAR images, flight/collection parameters, and associated metadata, but this is a long shot; I tried unsuccessfully to retrieve said SAR images a few weeks after first viewing them but received “not available” query notifications. Additionally, the process of assembling said SAR images is classified, further restricting access. One has to wonder whether said streaks could represent the path of some type of previously planned covert rescue/recovery craft, (other than rotary-powered, which leaves a different signature on SAR imagery).
Regarding the EO images of possible MH370 wreckage, in line with the above scenario: said wreckage could have been “planted” by the same fast-moving rescue/recovery craft or be the remains of an exploded plane, towed south before being reduced to wreckage, or sunk. This could explain the wreckage observed south of the LEP which isn’t logical according to the prevailing ocean currents/drift patterns and may have been done as a ruse to confuse investigators.
If genuine, Z’s confiscated simulator flights into the SIO, terminating IVO the LEP, may be a premeditated effort, a plan to leverage MH370 crew, passengers and cargo to achieve some motive.
@Stuart wrote “One has to wonder whether said streaks could represent the path of some type of previously planned covert rescue/recovery craft”
Or, the observed artefacts may be contamination of the image by extraneous and anomalous effects.
Tony wrote “[…] the interruption of data transmissions. Which in itself must be quite a technical feat, involving a considerable degree of ingenuity, technical expertise and know how.”
Tony, you’re really not paying attention.
Isolating the AES from power requires two button pushes within arms reach of the left flight crew seat. Disabling ACARS use of the SATCOM link requires unchecking one check box via an MFD screen, a process familiar to the MAS crews. No feats involved. Loss of power to the SATCOM and disabling ACARS use of SATCOM are described in the MAS 777 Flight Crew Operations Manual.
@DennisW, @Ventus45: In Dennis’ scenario, the captain’s intention was to negotiate and land the plane. The trip to the SIO was an option that was exercised only because the negotiation failed. In @ventus45’s scenario, the captain never intended to land the plane, but led his co-conspirators to believe he would. Putting aside many of the associated speculations, I think that is a possibility, and could explain TimR’s statements. (Whether or not TimR was told a true story, I do believe he is an honest broker.)
From social media hearsay, it does appear that some Malaysian elected officials were expecting a diversion, but only after the plane went lost. Whether or not this was speculation, delay tactic, wishful thinking, or pre-knowledge of an actual plan, is hard to know.
@TBill
The Malaysian search and rescue response was quite casual and controlled by officials high up the food chain not the groups that would normally be responsible for that effort. It even received unusual criticism from ICAO. My interpretation is the knowledge of a deliberate diversion not requiring an S&R response. Others attribute it to incompetence
@Victor
I share your opinion of TimR. I interacted with him a lot via email. His initial reason for contacting me was interest in my Christmas Island scenario (my first foray into path modeling). He felt it that was a plausible option based on scuttlebutt he had heard.
This discussion is very interesting (at least some of it).
Most of the dialog could be seen as agreeing that for some (insert your scenario) reason the pilot (alone) flew the plane to the SIO in accordance with an end game of his devising.
Whether a hijacking was part of someone’s original plan, it could not have included the murder of the passengers followed by a safe landing.
Hence, the two hour period between the diversion and the phone call would not have included a depressurization event or any extraordinary maneuvers, which might have alerted the cabin crew.
Large aircraft of that era, as part of their infotainment systems usually had either a large display or seat back display that included a representation of the flight path. Did MH370?
@Don: Accepting it is as easy as pie to disable ACARS, it leads me to question why it was subsequently enabled. The objective to disable it in the first instance must have been part and parcel of the grand scheme of things. Why then turn it back on and say ” look here chaps, see we are going South”. Had it not been for that action, deliberate or otherwise, where would the search are been. Inmarsat would not have had a bean to go with and the only logical assumption remaining would have been to look West and closer to home.
Must say, reminds me of the myth “Where do elephants go to die”and talking of elephants who was the “elephant in the room”.
@Sid
DonT is the systems expert, but yes MH370 is believed to have had map display capability on the Panasonic IFE system. I don’t recall if the map feature can be deactivated by itself, but of course the IFE can be turned off by the IFE/PASS switch in the cockpit.
We know the IFE rebooted after the SATCOM was rebooted at 1825 so presumably the IFE was off for a period presumably before the diversion.
MH370-Captio scenario gives restart of IFE for the PAX as one possible reason for SATCOM reboot at 1825, but that’s a stretch since I do not believe any IFE activity (movies/calls/SMS/etc) was recorded. The lack, especially of cabin crew communications, is suggestive.
@TBill
I believe that many of the features of the IFE are independent of the satcom link. Do we know that the telecom features of the link were offered as a passenger amenity on the flight to Beijing?
@Tony wrote “it leads me to question why [ACARS] was subsequently enabled.”
ACARS was never “subsequently enabled.“. Power to the AES was restored at 18:25UTC. The AES restored its datalink with the Perth GES at this time with a normal GES Log On, once the datalink was established, the IFE system opened two connections over the datalink as observed after every earlier GES Log On (without transferring any data over either connection). No ACARS activity was observed on the AES-GES datalink after 18:25UTC.
Restoring the electrical configuration to ‘normal’ was, perhaps, the only objective at 18:25UTC. Restoring full aircraft external lighting (position and navigation lights) may have been the objective.
Linguistic devices involving elephants, magicians, and so on, have little relevance.
@Sid,
Pax amenity telephone service was not available whereas a text messaging application was integrated into the IFE system. There is no evidence that the IFE messaging application was used during 9M-MRO’s earlier MH371 service, nor at any time during the MH370 flight.
SATCOM voice was available at one or more cabin crew stations. The information to hand doesn’t detail whether the cabin crew satcom handset was directly connected to the SDU or via the voice network element of the IFE system.
@Tony
Had it not been for that action, deliberate or otherwise, where would the search are been. Inmarsat would not have had a bean to go with and the only logical assumption remaining would have been to look West and closer to home.
The reality is that since the plane has not been found it is impossible to assign value to any of the various pieces of information we have. The simulator data also suggests a likely path South. We have no data suggesting a Western path unless you want to count “steering by your wake”.
Gentlemen, I have great respect for your professional and scientific achievements with regard to the search for MH370. Maybe I can support from a complete non aviation perspective. Radio signals in a data base have been overlooked or ignored for more than 6 years now for analysis.
I did some training on data from AF447, MH17 and Germanwings 9525. For app. 3 months I am studying the signals regarding MH370, so quite a short time span as of today.
In case you are interested in that work, please let me know. Regards from Europe.
@Rob: What exactly are you analyzing?
Analysis of digital HF radio signals scattered by aircraft. 3 Phases: 1. observation, such as yesterday’s flight SIA479 JNB SIN across the IO and others. 2. Validation: Monitoring of real time signals now with SDR in Oceania 3. Verification: Applying rules and lessons learned to sto-red data of flight MH370 from KLIA to LEP. Validation and verification by use of ADS-B data today and 2014, ideally from Thailand to Tasmania.
As of now in urgent need for ADS-B data around midnight of that day for air traffic in Western Australia and Tasmania. Analysis of ADS-B data in order to reduce false alarms, false tracks with digital radio sig-nals scattered by aircraft. Flightradar24 etc. do only provide ADS-B data up to 3 years in the past (business package).
Preliminary results: Little evidence for flight to Xmas Island as of today. Most interesting signals end app. 00:32 h UTC for SIO. First estimates to LEP in SIO with less accuracy than Inmarsat SDU data as expected by nature of physics. Further analysis of data required.
Next steps: Data Fusion of Inmarsat position data and HF signal data during that night 16:40 h UTC to 1 am UTC. Tons of work and ADS-B data would really help a lot for that effort. More than a 100.000 lines of data in the MIMO system. Do you have access to ADS-B data from Oceania for flight duration MH370 or subset on March 7th/8th, 2014?
@Rob
I have the same question as Victor. I have no idea what you are referring to.
@Rob
Our posts crossed in real time.
I am completely unfamiliar with the analysis you are doing. Could you post a link explaining the technique for me to educate myself?
@Tony
To add to what Don has already pointed out about restoring the electrical configuration to ‘normal’ …
Here is a list of the Boeing 777 Electrical Power to Systems:
https://www.dropbox.com/s/46ngm51asalcfac/Boeing%20777%20Electrical%20Power%20to%20Systems.png?dl=0
The Satellite Communication System is powered from the 115V AC L SEC 2 BUS.
There are several possible reasons for wanting to restore power to ‘normal’.
1. The pilot wanted to descend below the radar horizon and wanted to power up the Ground Proximity Warning System on the 115V AC L XFR BUS.
2. The pilot wanted to cross a number of busy airways and wanted to power up the Traffic alert and Collision Avoidance System on the 115V AC L SEC 2 BUS.
3. The pilot wanted to wipe clean the Voice Recorder System and wanted power it up on the 115V AC L XFR BUS and let it run for 2 hours with no voice input to overwrite any previous recording.
@Rob
When you say need ADS-B for midnite, local time?
The MH370-Captio.com team has posted flight path videos for the Malaysia/Indo region up to 19:00 or so. They may be able to help – of course they are Xmas advocates. I have a little data for EK425 which would take from Perth 6AMish.
@Rob: We only have historical ADS-B data from the ATC receiver in Terengganu, Malaysia.
Where are you getting the historical RF data?
@Victor@Rob
“Back in the day” when cell phone positioning was very actively being pursued, RF signature analysis was explored extensively. A cell phone position has various RF signatures in different locations depending on multi-path and numerous other properties. A library of signatures versus location was generated and used to estimate the position of the transmitting device. What Rob is describing sounds very much like that approach.
To my knowledge no one has ever gotten that technique to work reliably. Probably more accurate to say that better ways of locating a cellular user were adopted.
Like you, I have the question of where you would get historical RF data.
@Dennis, @Rob: Or maybe passive radar?
https://en.wikipedia.org/wiki/Passive_radar
In any event, I am very curious about archived RF data, especially if that exists in the public domain.
@Victor
Yes, I think passive radar is good description of the basic technique I was alluding to.
@Stuart,
Examining SAR sat imagery sounds very interesting. I’ve read that German TerraSAR-X was used in the early search, with images delivered to gov.my and the Chinese. I was able to find some low rez TMRR microwave precipitation radar images that show an interesting hotspot, but it could of course be a raincloud. I wonder if TerraSAR was tasked to scan the whole 7th Arc.
@Rob,
I too am intrigued by your mention of a large MIMO RF signal database, presumably from that night. I know that broadband HF triangulation was used to pinpoint millions of lightning strikes in the SIO, and was able to acquire the private database for research. More info is on my MH370 website:
https://370Location.org
The ADS-B data that Victor mentioned can be found in ham (2E0PHS) Paul Sladen’s archive:
https://github.com/sladen/inmarsat-9m-mro
As a ham since 1970, I’ve also dabbled with SDR, currently feeding an ADS-B receiver on a Pineapple to FlightRadar24 for free access to their business tier.
Please tell us more about the MIMO data, and how it might be analyzed.
— Ed
@370Location: I use the Flex 3000 on HF, so I too am curious about SDR archives.
HF emissions from 9M-MRO remain a facet of the story that has not been deeply explored. It’s known that MAS had, prior to 2014, installed its own HF station to support airline operational communications with its B737s flying routes over the Bay of Bombay. The 737s were not equipped with AMS(R)S SATCOM and VHF radio would not provide sufficient range.
It was reported that, prior to 2014, the Tentera Darat Malaysia/Malaysian Army had acquired the Czech VERA system, a passive RF surveillance tool. The alleged sighting associated with Pulau Perak may be associated with this system, the island hosts a small army garrison to maintain Malaysian sovreign territory claim on the rock. Or maybe not, there is little space to distribute three seperate antennas.
@Don Thompson: Certainly voice HF transmissions would be extremely helpful to understanding the scenario for diversion.
I’ve wondered whether any (UHF) DME transmissions from MH370 were recorded and archived.
Regarding the sighting at Pulau Perak, I’ve attributed this to a witness hearing an overhead jet, perhaps accompanied by visually observing navigation lights and a strobe. On quiet nights, I have heard airliners passing overhead at cruise altitudes (as verified by FR24).
Thanks for responses, comments and questions. A quick one today due to lack of free time:
There is no link for explanation of method to the best of my knowledge.
Yes, I mean midnight UTC. Sorry. I do not need ADS-B data from MH370 itself (that one I have) but for flight duration 8 hrs. in the region of Oceania of other aircraft to reduce false alarms. I know the CAPTIO videos, but looking for real ADS-B data from Thailand to Tasmania.
Working on preliminary draft report how this will work. Not finished yet. Very time consuming.
I have 5 files of data in spreadsheets from AF447, MH17, Germanwings 9525, MH370 and April 1, 2014 Aerial Search in Area B. More to be created.
All documents or files can be made available soon. Remarks and comments included. Interested in cooperation. Data base is public domain. Hope I responded to everything so far.
@Rob: If you want to find collaborators, this is the place to be. You’ll find interested parties that have the chops to help.
@VictorI,
Come to think of it, my fascination as a kid was pulling out weak signals, working DX for the QSL collection. If only SDR had been around then. The Flex 3000 looks very nice. FB, OM!
As I’ve been able to extract far more info from the hydrophones than expected, I also wondered if there might have been recordings of the ELT 406 MHz BPSK signals from SARSATs. Alas, it appears the detection is onboard the sat, and only the digital result is retransmitted.
@Rob,
Looking forward to hearing more when you get a chance. I believe the ADS-B RX on Cocos and Christmas Islands are recent additions. You have probably seen this open ADS-B database that has some historical data:
https://opensky-network.org
@All,
My apologies if this has been covered in the past…
I was looking at the Shah simulator entries, particularly the comm and nav settings at the 10N turn south:
Avionics.01
Comm1Active=122.950
Comm1Standby=118.000
Comm2Active=119.900
Comm2Standby=121.700
Nav1Active=116.90 (PHUKET)
Nav1Standby=110.60 (SURAT THANI)
OBS1=338
Nav2Active=114.10 (Cocos Island or Langkawi or Columbo VOR)
Nav2Standby=109.60 (?? Taiwan Pingtung ?, Japan,Shonai ? Korea,NAVY=Pohang ?)
0BS2=315
Transponder=1200
ADFActive=353
ADF2Active=281 (Columbo is bearing 253)
My question is whether a pilot might typically have Nav2Active set to an upcoming VOR, or would it remain on a closer one already passed?
@370Location: A 777 pilot would not normally tune VORs. They would automatically tune to the nearest VORs/DMEs to provide the nav radio inputs to the navigation calculations.
Mick Gilbert has looked closely at the nav radio frequencies. If I recall, the 10N data reflects the closest VORs before the plane was “dragged” to that position, and the 45S data reflects the proximity to Banda Aceh before dragged to the position of fuel exhaustion.
@VictorI,
Thanks for that clear explanation on nearest VOR/DME, including the clue about dragging. It saves me from stuck down that rabbit hole. Thanks also to Mick for the analysis.
@Rob
In the vicinity of Arc7, EK425 heading northbound would have hit about 23 South on L894 on Arc7 at about the same time as MH370 would hypothetically be there (0000UT) if MH370 had been up in that area.
@370Location
@Victor Iannello
Regarding the Nav1 and Nav2 settings in the home flight sim data, yes, at the time that the sim aircraft was relocated to 10N the settings were:
Nav1Active 116.90 PUT VOR/DME (PHUKET)
Nav1Standby 110.60 PAE VOR/DME (PAINE, US)
Nav2Active 114.10 VPL VOR/DME (LANGKAWI)
Nav2Standby 109.60 TCM VOR/DME (McCHORD, US)
You should note that the two standby frequencies are ‘inherited’ from the initial set up configuration that starts with the departure field being Seattle. Same same with most of the comms frequencies;
Comms1Active 122.95 Unicom SEA
Comms1Standby 118.00 D-ATIS SEA
Comms2Active 119.90 Seattle Tower
Comms2Standby 121.70 Seattle Ground
and the two ADFs;
ADFActive 353 RNT (RENTON)
ADF2Active 281 HPK (PARKK)/SZ (SEATTLE PARKK).
In the home flight sim program only the Nav1Active and Nav2Active will autotune. The home flight sim program does not completely accurately reflect the actual autotune function on the real thing as in the home flight sim program the station that is tuned is dependent upon the range setting that has been applied to the Navigation Display.
@Mick Gilbert,
Thanks for clearing up my puzzlement over the standby nav freqs and ADF bearings. The Seattle settings make perfect sense. I’m getting that the autotune didn’t latch on at the dragged 10N location because of a shorter range setting, and not tuning Banda Aceh or Port Blair is one indication that it was dragged.
Much appreciated — Ed
@370Location
Ed, the VOR tuning settings for 10N are what was recorded prior to the drag/relocation. That rule holds for pretty much every piece of data bar the lat/lon data. That is a fairly important consideration that is often overlooked.
The reason that PPB and BAC aren’t tuned at 10N is becuase the 10N data file is created prior to the simulation being restarted.
@370Location: I don’t know if you have read this paper that I co-authored on the simulator data, but if you haven’t, you certainly should if you want to learn more the simulator and how we arrived at many of our conclusions:
https://www.dropbox.com/s/lvcz1fsxvphxob4/2016-11-29%20Further%20Analysis%20of%20Simulator%20Data.pdf?dl=0
Novel approach to “Real-World ADS-B signal recognition based on Radio Frequency Finger printing” described here.
@Mick Gilbert
@VictorI
I appreciate all the work that has gone into your simulator analyses.
I’ll study the paper and then search the forum archives if I spy any more quirks.
@Victor Iannello
@370Location
Victor, we now know that a number of the conclusions reached by you and Yves four years ago are not correct. For example, you originally concluded,
The data files were manually created after certain parameters were manually changed.
and
The flight files were deleted …
We now know that none of recovered the files were manually created if we take that to mean manually saved using the Save file function. They were all automatically created by the Microsoft Flight Simulator program, essentially in the background.
MSFS automatically generates three types of flight files:
Program generated temporary flight – initially created when the ‘Create a flight’ function is used and an aircraft type is selected. Overwritten when changes are made in the ‘Create a flight’ function such as amending the departure airfield or changing fuel and/or payload. The Program generated temporary flight file is also overwritten if in the course of a simulation the user uses the ALT-World-Map function to relocate the aircraft (either by dragging the icon on the map or entering different values for latitude, longitude, heading, altitude or airspeed) or if the ALT > Aircraft function is used to change the fuel or payload.
UI generated flight – created/overwritten when the ‘Create a flight’ options have been completed and the user selects ‘Fly Now’.
Previous flight – created/overwritten when the user exits the MSFS 2004 program or if the program is terminated.
2N was a ‘Previous flight’ file and 3N, 5N, 10N and 45S1 are all ‘Program generated temporary flight’ files. They were neither manually saved nor deleted rather they were automatically created in the background and subsequently overwritten.
You also originally stated that,
‘As the map shows the projected path of the aircraft consistent with the waypoints that are entered in the native flight planner, it would be convenient to drag the aircraft icon forward along the planned path.
and concluded that,
‘The parameters related to fuel and flight dynamics show that the aircraft was manually positioned along the flight path.‘
I can say quite categorically that no planned flight path would have been displayed on the Map for the user to use as a reference for repositioning the aircraft icon. There is a specific block of data where the flight path created using the MSFS 2004 Flight Planner function is recorded in the flight files. That block is absent from the recovered files.
You and Yves also concluded that,
The point in the Andaman Sea (10N) shows an aircraft banked left at 20° and turning towards the south.
We have known for some time now that for 10N (and also 45S1) the aircraft’s physical characteristics bar location describes the state of the simulation aircraft PRIOR to it being dragged or relocated. That is the point that I emphasised earlier to Ed. All the aircraft attitude, fuel, navaid tuning and engine data belongs to the location where the aircraft was dragged from, not to.
Thus the data at 10N in fact tells us that the aircraft was in a 20° AOB turn and turning towards the south BEFORE being relocated to the Andaman Sea. Based on the fuel and the Nav1Active and Nav2Active values it is highly likely that the simulation aircraft was in the Malacca Strait near VAMPI just prior to being dragged to 10N. In other words, the user was turning AWAY FROM where the aircraft was next repositioned to.
I have been working on pulling all of my work on this into a paper to share but have been somewhat hampered by events this year (not the least of which being the recent demise of the laptop that I have been using for all my flight sim work). I’ll look to get something more detailed out in the course of the next few weeks.
The South China Sea is contested. Certainly, we can all agree on that. Yes, multiple sovereign Nations do, and have been flying UAV aircraft. In what ATC calls “Due Regard.” That means ATC does not know where these platforms are at. Think about that. China, US, Singapore, Thailand, Vietnam, Australia, and most likely more.
Maybe each country flying more than one at a time.
Is this site controlled on commenters?
@Mick Gilbert,
@VictorI
Thanks for clarifying that the values are from before the dragged save. When you said just lat/lon were valid after a dragged entry, I wondered about heading and bank. The 2N save being from a shutdown implies that the points might not be sequential, per Victor/Yves paper. I’m not vested either way, just curious. It’s baffling that a sim starting a turn south would get dragged farther down the previous flight path. I look forward to reading your upcoming paper.
My sympathies to losing your laptop. I’ve had a setback here with a trusted 16 TB RAID storage array getting accidentally clobbered. Recovery from backups has been slow, with gaps. A reminder to all to invest in rotating backups.
@William Shea,
Victor has been vigilant in keeping this forum completely free of spam, which is not an easy feat. Because I can see your post, your comment has passed the moderator’s scrutiny. Please don’t violate that trust.
@William Shea: You had a typo in the email address when you submitted the commented at 9:54 pm, which then required my manual approval for the comment to appear, which I did.
@Mick Gilbert: Let me start by saying I appreciate that you actually bothered to load the MSFS software to independently investigate. So many others with some of the largest mouths never did.
To address some of your statements:
1) We now know that none of recovered the files were manually created if we take that to mean manually saved using the Save file function.
I agree. Based on information you gleaned from the ATSB, the files were automatically created after a manual change in position. That does make the creation of the files any less incriminating. It means that the captain was likely not aware of the trail of evidence that was left behind on the hard drive.
2) I can say quite categorically that no planned flight path would have been displayed on the Map for the user to use as a reference for repositioning the aircraft icon. There is a specific block of data where the flight path created using the MSFS 2004 Flight Planner function is recorded in the flight files. That block is absent from the recovered files.
Can you be certain that the absence of the block means the flight planner was not used? Even if no path was displayed, the user could still easily move the plane icon in the MAP screen, possibly aided by other tools such as Google Earth.
3) Thus the data at 10N in fact tells us that the aircraft was in a 20° AOB turn and turning towards the south BEFORE being relocated to the Andaman Sea. Based on the fuel and the Nav1Active and Nav2Active values it is highly likely that the simulation aircraft was in the Malacca Strait near VAMPI just prior to being dragged to 10N. In other words, the user was turning AWAY FROM where the aircraft was next repositioned to.
Whether the turn towards the SIO was initiated before the aircraft was manually moved to 10N is irrelevant, in my opinion.
The simulator data demonstrates in the weeks before the disappearance, a flight was created on the captain’s computer that starts at KLIA, proceeds up the Malacca Strait to the north of Sumatra, and then ends with fuel exhaustion in the SIO. We can be fairly certain that the disappearance was pre-mediated and involved the captain. I’ve seen no evidence to the contrary.
@Victor et al.
One rarely gets the answer to a complex problem right the first time (and sometimes the second, the third….)
The value of this dialog is that discussion of the evidence and the hypothetical conclusions leads to a better understanding of the actual problem.
We have all been wrong more than once.
@Mick Gilbert
@Victor
Thank you for discussing that we now know a little more about the pilot’s home simulator work. In Oct 2017, ATSB’s stated (in the report Operational Search for MH370) that ATSB had “complete” data for several of the simulator cases.
In “2020 hindsight” that’s an interesting disclosure. This is yet another area where known MH370 data is being held confidential from public scrutiny.
From Mick’s information from ATSB, it turns out by “complete data” ATSB means “half-a-loaf”: ATSB apparently has complete Microsoft Flight Sim Data sets, but apparently the important PSS777 addon file details are not saved when the temporary files are generated in this manner.
Below spreadsheet I summarize the limited data which is known to us, versus the complete data that ATSB apparently actually has for the cases. Each saved file can contain up to about 600 individual lines of data, organized within the 49 sub-categories of data shown in the spreadsheet.
https://docs.google.com/spreadsheets/d/1zt47Tj2eF7MhctLrttYGM0A_kkQ8uQSdCNTDXADTmSc/edit?usp=sharing
I depart from Mick, in that I believe Victor and Yves work still stands the test of time. I see no immediate overall interpretation changes, in part because the limited data that was already disclosed is arguably the most important data. But I actually feel the simulator work may help tell us where MH370 crossed Arc7 (eg; 30-32 South). I am frustrated that we do not have the more complete simulator data to hopefully extract even more clues from the existing data.
@Victor
Re flight sim data.
In your findings you have stated :
“The particular flight files of interest were one of hundreds found on the computer on several drive; however, the files of interest were deleted and
later recovered by investigators from a “shadow volume” on a single drive that was found disconnected from the computer. This makes the set unique among all the flight files found.”
May I enquire as to the reasons for considering the set of data from that particular drive unique. In what sense was it considered unique, for example was it for reason it was disconnected, was it because of the deletion of the data it contained or was it because of the circumstances of the find, eg was it found in some secret location.
@TBill, @Sid Bennett: In my mind, the important discovery by @Mick Gilbert is that the flight files were automatically created. Prior to that, we struggled to understand why the files were created, and why the captain did not take more extreme measures to ensure they would not be discovered. If the files were created automatically by MSFS, and likely without the captain’s knowledge, those questions are now answered.
@Tony: The grouping in the Volume Shadow, the repeated parameter values across the files, and the short duration of the simulated time all suggest the files are related to a single flight. This and more are described in more depth in a previous post.
@Victor
Yes those files are hard to see, because they are transient, but they show up in the saved flight file directory briefly if you think to look for them, when you make a change.
The only reason we did not know the file type, which is basically the very first line of data in the saved flight sim files, is that is part of the data that is being held confidential, but ATSB has now offered that much.
@Victor
Some time ago, there was a discussion about the purpose of the ZS simulator exercise, in which locations in the SIO were detected. I remember that you suggested deliberately leaving such a trace by ZS because it is difficult to find a practical sense for such an exercise. If the exercise points were saved automatically without the knowledge of ZS, the question returns what was the purpose of this simulation.
@Victor Iannello
et al
Victor, I should have made it clear that I’m not looking to criticise your earlier work with Yves. Back then you didn’t know what you didn’t know. As to whether new information and perspectives changes earlier drawn conclusions, I’ll leave it to readers to form their own views.
To specifically address a couple of your points above,
Can you be certain that the absence of the block means the flight planner was not used?
Within the bounds of reasonableness, yes. When the MSFS 2004 Flight Planner function is used to create a flight plan it creates a data group called [ATC_ActiveFlightPlan.0] in Previous Flight files and a group called [GPS_Eng] in the other data files. The flight plan details are recorded in those data groups and that data is used, inter alia, to show the route on the ALT-World-Map display.
None of those data blocks are present in the recovered files. This can only mean that the Flight Planner function was not used to create a flight plan. If there is no [GPS_Eng] data block in a file there is no route displayed on the World Map
Even if no path was displayed, the user could still easily move the plane icon in the MAP screen, possibly aided by other tools such as Google Earth.
Is there even one scintilla of evidence to suggest that might have occurred?
Whether the turn towards the SIO was initiated before the aircraft was manually moved to 10N is irrelevant, in my opinion.
And I disagree. If you’re trying to create a narrative that the data points are all part of one continuous flight path the fact that the aircraft is heading away from the next point in the supposed route doesn’t help that narrative along. I fail to see how it can be even vaguely consistent with that narrative but, as I said earlier, I’ll leave it to readers to form their own views.
The simulator data demonstrates in the weeks before the disappearance, a flight was created on the captain’s computer that starts at KLIA, proceeds up the Malacca Strait to the north of Sumatra, and then ends with fuel exhaustion in the SIO.
And if I were to say that fuel exhaustion didn’t occur in SIO? That rather it occurred somewhere in the northern hemisphere, likely adjacent to north-western Sumatra?
Again, it appears that I have to labour the point that all the aircraft attitude, fuel, navaid tuning and engine data belongs to the location where the aircraft was dragged from, not to.
Thus the status of the aircraft in terms of zero fuel, engines spooling down, shallow banked turn to the right, were what was happening before the aircraft was repositioned down to 45S1. In other words, fuel exhaustion had occurred about 1.5 – 2 minutes before the aircraft was dragged to 45S1.
Further, the fact that both Nav1Active and Nav2Active are tuned to 113.4, the BAC VOR at Banda Aceh, is good evidence that after 10N the aircraft was flown south-west towards Banda Aceh rather than south towards 45S1.
The rest of it turns on answering the question, how do you get to fuel exhaustion from 62,700 kg of fuel on board in significantly less than 1.2 hours without using the ALT > Aircraft > Fuel and Payload function (because using that function would have created a Program generated temporary flight file)?
@370Location
My sympathies to losing your laptop.
Thanks Ed. I’m on the coast here in southern Queensland on Australia’s east coast and what the salt air does to electrical gear and electronics is brutal. I had set up an old EliteBook with Windows 7 and Microsoft Flight Simulator 9 to try and get close to Z’s set up. Sadly a couple of weeks ago she “failed to proceed” as the Rolls Royce people like to put it.
@Victor
@Mick
I agree, as far as I can see, there is no FS9 flight path showing to drag the icon on the map. However, as Victor mentioned, there could still easily be a supplemental flight path map using an add-on program such as FSNav or FlightSimCommander. I use the latter program, and it shows a flight path map separate from FS9. The former (FSNav) was apparently quite popular with FS9 users, and I am guessing FSNav may also allow flight plan/path.
There are basically 3 or 4 ways the icon could have got to 45S:
(1) Just dragged to 45/105 which is an lat/long intersection on the FS9 Map when zoomed out all the way.
(2) Followed a flight path showing in FSNav or other add-on program
(3) Flew 180S CMH from 10N.
(4) Slew Mode
Item (3) CMH180 seems to be ruled out by the sim time data, but still has some interesting findings.
@TBill
Bill, there is simply no evidence to support the contention that Z used a supplemental flight path map add-on program such as FSNav or FlightSimCommander.
@Mick Gilbert: There is no doubt that captain created the simulated path by sequentially manually moving the plane and adjusting the fuel. The order of movement, turn, and fuel adjustment for each manual change is irrelevant, in my mind.
@Greg: That’s a good question. I appreciate your following along.
@Mick
“…there is simply no evidence to support the contention that Z used a supplemental flight path map add-on program such as FSNav or FlightSimCommander.”
Like so many issues re: MH370, we have no evidence one way or the other. This reminds me of the defacto proof of passive flight (the we have no good proof of active flight).
FSNav was a very popular and useful FS9 add-on which us why some simmers never updated from FS9 (because the FSNav software developer elected to stop developing at FS9).
If we want to “think like ZS” we probably need to be more FSNav-aware (which is an action item for me). In hindsight I should have been more FSNav-savvy.
@Mick Gilbert
In Folder 1 of the RMP report on page 144 and 145, we are told that the .flt file data group [datetimeseason] set up for the ZS home simulator fragments found on his external hard drive was Season=Winter, Year=2014, Day=52, which is the 21st February 2014.
We are also told on page 206, that the data was last modified on 3rd February 2014. The ATSB gave the evening of 2nd February as the time when ZS was running the SIO simulation, whilst off duty. ZS quite often worked into the night.
The important fact about setting up the SIO simulation for the 21st February 2014 is, that his next scheduled flight from KUL to PEK was on 21st February 2014.
ZS planned initially to hijack the 21st February flight from KUL to PEK, not the 8th March 2014 flight.
This plan was run through his simulator on 2nd/3rd February 2014, 3 weeks in advance of his initial hijack target.
In addition, we are told that he uninstalled his Flight Simulator and deleted his passwords file on 20th February 2014 in preparation for his flight the next day to PEK (or the SIO).
I think the Preliminary Assessment by the IG dated 14th August 2016 and the subsequent excellent analysis by Victor and Yves dated 29th November 2016 are still broadly correct.
We are missing a number of data groups in the fragments of data we have. You are correct that [ATC_RequestedFlightPlan] and [GPS Engine] are both missing, but so are other data groups. Each data fragment recorded in the Folder 1 RMP report from page 148 onwards starts and ends with scrambled data. We do not know what other data groups from the recovered .flt files there may have been.
We know the simulation run may have been paused, dragged, modified and saved. It will be difficult to account for the fuel running to zero in all tanks, without user intervention in the simulator.
@Richard
Good info… I appreciate it.
One fact I am not so sure about, when ATSB said the sim was run on 2-Feb, I think they meant that the DateTimeSeason setting showed 2-Feb-2014. I almost never run my cases with today’s date in there. So I like 3-Feb as possible run timing, since that was the file save date. However since ZS was flying that day, I wonder what the file time stamp shows?
It may seem like a fine point, but I am speculating if pilot was checking winds in SIO, winds were low on 3-Feb, so on 8-Mar possibly required change of flight mode with higher winds.
@Richard
PS- see my note above ATSB indeed apparently has “complete” data files, so ATSB is not missing any groups of data for fully 4 of the cases.
Complete means complete FS9 FLT temp files, but PSS77 data portion (waypoints etc) is not present.
General comment:
My experience with the ATSB is they are dedicated to transparency to the extent they are not constrained by other parties on the investigative team. The simulator data came to the ATSB from the Australian Federal Police (AFP), who presumably got the data from the FBI. (This has never been officially stated, but I view it as likely.) The ATSB was not allowed to publicly release that data. It is a testament to Mick Gilbert’s persistence and resourcefulness that he was able to deduce the information about the automatic generation of those flight files based on very limited information he was able to obtain.
The First Officer’s cell phone connection to a cell tower on Penang Island is a great example of how the Malaysians withheld information from both the public as well as other official investigators. The ATSB learned of this only after the RMP report was leaked to the public, rather than from official channels, and amidst public denials from Malaysian officials that the data existed. The data was significant because it provided additional confirmation that the primary radar targets were indeed MH370.
Why did the Malaysians feel it was necessary to hide this from the public as well as from other official investigators?
@TBill
The ATSB states in their report dated 3rd October 2017 on page 98: “Data from the Pilot-in-Command’s (PIC) home flight simulator was recovered and analysed in March/April 2014. This information was provided to the ATSB on 19 April 2014”. This was early information before the RMP report and as Victor points out probably came direct from the FBI. The ATSB talks about 6 data points, of which 4 are “complete” and 2 are not.
This ties with the RMP Folder Appendix (1) Appendix M-1 on page 199, which shows Route Point A, C, D, E and F, but not B. It also ties up with RMP Folder 4 Section 12 Page 27, which mentions 6 Route Points but states there is no significant data for Route B.
The RMP Folder 1 Appendix A on page 148 gives the raw data for all 8 data points, but is dated 15th May 2014 almost a month later. My guess is, that the FBI discovered more data as time went on.
The date of the simulation data fragments last modification was 3rd February 2014. This is from the date time stamp on the Volume Shadow Information (VSI) as stated in the RMP Folder 1 on page 206. This report is dated 19th May 2014. Again this is later information. By this time they had figured out the VSI last modification date.
The [datetimeseason] for this simulation run was 21st February 2014 as stated in the RMP Folder 1 page 144 and again on page 145 and again on page 131 in section 6.3.2.4.
That is my key point, that ZS ran the simulation on 3rd February 2014 with a simulated date of 21st February 2014, which was his next flight from KUL to PEK!
ZS planned to hijack MH370 on 21st February 2014 initially and he was doing the planning 18 days beforehand.
@Victor says
“There is no doubt that captain created the simulated path ”
What makes you so certain. Could there not be even the smallest of doubts the smoking gun could have been placed in the hands of the alleged suicidal captain. As you have said that the Malaysian authorities felt it necessary to hide this from the public as well as from other officials. Could it not follow therefrom there can also be doubt whether other material may have been with held, that whatever was released should have attracted certain degree of skepticism as to its evidential nature and quality.
Should an investigator not be aware of expectation bias, another one of our human frailties and allow it to drag us by the ear along its false route.
We seem to be joining a lot of dots but who put the dots there for us to join is the question. Was it the captain or some other person. I have a completely open mind about that and thus far have been unable to be convinced it must have been him, that no other could have done it but him. Air accidents in the main involve not a single but a number of factors conspiring to form a causal chain for the final outcome. That also remains a possibility which stands.
@Tony: Yes, it’s possible that the captain was framed. However, the timing of events near IGARI makes it almost impossible that anybody else other than the crew was responsible for the diversion.
From a previous post that discusses the ADS-B data:
After the last radio transmission from MH370, the maximum time available to disable the transponder and divert the aircraft was 64 seconds. That leaves an impractically small amount of time for a third party to enter the cockpit and take control.
I appreciate those of you that wish to be thorough and consider all scenarios. However, at some point, we have to acknowledge which scenario is by far the most likely.
Previously I asked:
Why did the Malaysians feel it was necessary to hide this [data about the cell phone registration] from the public as well as from other official investigators?
There is another important question:
What other relevant information was either hidden or released as misinformation or disinformation?
@Richard
Re: In Folder 1 of the RMP report on page 144 and 145, we are told that the .flt file data group [datetimeseason] set up for the ZS home simulator fragments found on his external hard drive was Season=Winter, Year=2014, Day=52, which is the 21st February 2014.
The problem there is that that does not match the data that the ATSB has.
The ATSB advised that, ‘… a listing of 4 complete .flt files and 2 partial .flt files were provided to the ATSB on 19 April 2014. All files except the final (partial) file contained a [DateTimeSeason] field which contains values for Day, Year, Hours, Minutes, Seconds, Season.
The files with the field had the common values of Day=33, Year=2014 and Season=Winter
The [DateTimeSeason] field in the files indicated 15:26 to 16:38 (hh:mm).
Day=33 is 2 February.
Whatever data may have been recovered for files with Day=52 it is not the data used by the ATSB, data that matches the RMP Folder 1 locations.
If you read the Digital Forensics Department Preliminary Case Report in RMP Folder 1 in full it appears that the Day=52 reference relates to the use of Microsoft Flight Simulator X and the PMDG B777 add-on, not the use of Microsoft Flight Simulator 9 (2004) and the PSS B777 add on. The 21 February “flight” would be consistent with the MSFS X Logbook.BIN file for 20/2/2014 @ 11.07am per 6.4.3 Logbook.BIN analysis (page 136).
6.4.3.1 Logbook.Bin 20 Feb 2014 @ 11:07 am (page 137) shows the 21 February 2014 flight to have been for a “Boeing 738” (a B737-800).
Re: We are missing a number of data groups in the fragments of data we have. You are correct that [ATC_RequestedFlightPlan] and [GPS Engine] are both missing, but so are other data groups. Each data fragment recorded in the Folder 1 RMP report from page 148 onwards starts and ends with scrambled data. We do not know what other data groups from the recovered .flt files there may have been.
I had been engaging with (some might say, pestering) an official agency for some time about the recovered flight sim data. They had steadfastly maintained the position that due to the sensitive source of the files they were not at liberty to release them.
I finally ended up getting them to agree to provide me with just the structure of the files (ie just the data group and data element headings) purged of all actual data values. The data file structures were provided under an agreement that they were for my own use and that I would not distribute them to any other person or party.
Suffice to say that it was by matching the file structures to the structure of MSFS automatically generated files that I concluded that we were looking at automatically generated files.
File A (2N) is an automatically generated Previous Flight file.
File B_partial (presumably 3N) is incomplete.
File C (5N) is an automatically generated Program generated temporary flight file created when the user adjusted the fuel load.
File D (10N) is an automatically generated Program generated temporary flight file created when the user relocated the simulation aircraft.
File E (45S1) is an automatically generated Program generated temporary flight file created when the user relocated the simulation aircraft.
File F_partial (45S2) is incomplete.
Knowing how the files were created and knowing the engine, fuel and navigation aid data for each point (which for File D (10N) and File E (45S1) relate to the aircraft’s condition prior to being relocated) it is possible to reconstruct the manner in which the simulation was likely unfolding. It is also possible to eliminate or render unlikely some possibilities for how the simulation was likely unfolding.
Further, knowing that [GPS_Engine] falls between [ATC_MessageSystem] and [DateTimeSeason] in the file structure means that it is a straightforward task to determine that it is missing from these files.
@Victor Iannello
@Tony
Re: ‘After the last radio transmission from MH370, the maximum time available to disable the transponder and divert the aircraft was 64 seconds. That leaves an impractically small amount of time for a third party to enter the cockpit and take control.‘
Not that I’m a proponent of third party intervention but that very limited view that control must have been seized after the last transmission completely ignores the possibility of control being seized well beforehand.
I’m sure that it is not lost on those who do advocate that theory that the Captain’s non-standard repetition of the ‘maintaining level three five zero’ call and his non-standard acknowledgement of the hand off to Vietnam may have been him trying to surreptitiously signal a problem to ATC.
@Victor
Regarding Malaysia’s motive, if any … for perspective it would be beneficial to look at the recent terrorist activity in SE Asia. HVI Zulkifli Abdhir (nom de guerre Marwan), was a Malaysian-born and US educated electrical engineer who was being actively pursued for his role in numerous terrorist attacks throughout SE Asia, most notably the Kuta Bali bombing (2002). Certainly all forms of intelligence collection were utilized by US and partner nations to conduct counter terror operations from at least 2002 onward, and it took several attempts to eliminate Marwan, who was killed in the Mamasapano Clash (Mindinao Philippines January 2015). Interestingly, there was an increase in monitoring of Malaysian and Indonesian military facilities, airfields and other areas of interest from approx late 2013 onward. Commercial aircraft/related facilities were determined to be a significant security threat.
And in unrelated news, this – https://timesofaddu.com/2020/11/12/part-of-an-airplane-wing-found-near-dh-meedhoo/?fbclid=IwAR2Y0ep_esaOWiY3aqTx-vxy-9pjOVHacmhbYKdF6wQmj0v6dEygOt06JIQ
Looks like the wing off an MQ-9 Reaper has decided to holiday in The Maldives.
@Mick Gilbert: There is no evidence that the flight was abnormal in any way before the diversion. Sure, it’s possible that a third party had entered the cockpit at some point before or after takeoff and was pointing a gun at the Captain and the First Officer, the crew offered no resistance, and all appearances of a normal flight were maintained by the crew. I don’t think that’s likely.
The missing repeat of the handoff frequency near IGARI can easily be explained by the captain’s knowledge that he would not be checking in with Vietnam. Considering that MAS aircraft would be very familiar with the handoff frequencies from Malaysia, I don’t see why the captain would believe that would signal a problem, which it did not.
@Stuart: I don’t dismiss some of the elements that @TimR, @DennisW, and @ventus45 have proposed, although I would offer a different composite scenario as a possibility.
As @ventus45 proposed, if the captain’s intention was to divert the plane to the SIO, he may have led a team on the ground to falsely believe that his intentions were to safely land the plane as part of a negotiation or to make a political statement, which was then relayed to the Najib administration during the flight. In the captain’s plan, this would allow safe passage back across Malaysia (even though we now know that the Malaysian military was not prepared for a rapid response and intercept) after depressurization incapacitated the passengers and crew. Once out of radar coverage after previous radar captures placed MH370 on a northwest trajectory on airway N571, a descent and diversion to the south would not easily be detected. After the ACARS was disabled, only the Inmarsat satellite data (which the captain was probably not aware of) placed the crash in the SIO. In this scenario, the team on the ground was horrified by the disappearance, and never disclosed their involvement. Nor would the Najib administration, for political reasons, disclose their awareness.
The simulator data found on the captain’s home computer and the Inmarsat data were clues that were inadvertently left behind.
@Mick Gilbert
We know that ZS had installed both FS9 on his external drive MK25 and FSX Gold Edition V10.0.60905 on his external drive MK26 and both installations were performed on the same day 20th December 2013.
We also know that ZS had both the PSS 777-200LR add on, as well as the PMDG 777-200LR add on.
The RMP Preliminary Case Report (English) dated 13th May 2014 clearly states that FSX was used with the PSS 777-200LR Malaysia no VC add on. This is possible with some restrictions, including usage of the Auto-Pilot and Flight Plans. According to Yves Guillaume’s analysis of the Aircraft Specific Input Parameters of FS9 (2004) and FSX in his excellent document Flight Dynamics in Microsoft Flight Simulator dated July 2012, the formats are largely identical with some additions for the new FSX features. Please see Appendix 3.
Well done for getting the ATSB to give the structure of the data, but the details from the ATSB are misleading.
Victor and Yves found 8 data points, of which 6 were useful for their analysis. The RMP Preliminary Case Report Appendix A shows the raw data of the same 8 data points. Victor and Yves used the nomenclature 2N, 3N, 5N, 10N, 45S-1 and 45S-2 for the useful data points for their analysis and noted 6-2 and 7 as additional points. The ATSB refer to 6 data points, which are identical to 2N, 3N, 5N, 10N, 45S-1 and 45S-2, where 3N and 45S-2 are noted as incomplete.
You say the ATSB state that 5 data points had a [datetimeseason] reference to Year=2014 Day=33 (2nd February 2014).
RMP state that 8 data points found on the external disk MK25 in the shadow volume were compared to the 8 data points found on the external disk MK26 in the saved .FLT files all had a [datetimeseason] reference to Year=2014 Day=52 (21st February 2014).
How do you account for the ATSB statement “complete”, when the raw data shown by the RMP is definitely scrambled at the start and end of each data fragment?
How do you account for the discrepancy between the ATSB and the RMP on the number of data fragments?
How do you conclude FS9 was used, when the RMP state FSX was used to create the data fragments?
Do you think ZS did multiple runs of the SIO simulation with the same coordinates and flight parameters using both FS9 and FSX?
We also know from the Initial Examination Report (Malay) dated 19th May 2014, that the data fragment files found on his external drive MK25 in a shadow volume are automatically created after the computer is unused for 15 minutes. Clearly these were saved automatically to the MK25 external drive, because he was running from the MK26 external drive.
The report gives the Volume Shadow Information (VSI), last modified 03 FEB 2014 as:
{OOd7ef6c-8bcb-1Ie3-b3f7-ee8a9181afad} {3808876b- c176-4e48-b7ae-04046e6cc752}
This ties up with the MK25\MK25\D\System Volume Information\ given in the Preliminary Case Report (English) dated 13 May 2014 Appendix A p.148 regarding the data fragments found.
You also appear to ignore my points about deleting his password file (User2.txt) from his external drive MK23 on 20th February 2014, which contained all his (in total 77) banking, online shopping, email, work, social media, mobile phone and online forum passwords.
You only do that, if you are planning not to return.
@Richard
FS9 is only approximate re: Moon phase depiction, but fyi FS9 thinks it sees nearly a full Moon in the sky on the night of 21-Feb-2014. I have always felt a Moonless night was chosen (8-March-2014).
If I am trying to match outside lighting, then I run with TimeDateSeason for flight time in question. Otherwise I just use whatever date is pre-populated, sometimes I change to daylight just to see the gauges etc. But the FS9 does not automatically set TimeDateSeason to today’s date, the user has to make that change manually, which I never do.
I wish we knew the real file timestamps on the recovered files. TimeDateSeason is just a user choice.
@TBill said: But the FS9 does not automatically set TimeDateSeason to today’s date, the user has to make that change manually, which I never do.
It’s been a while since I’ve run these kind of tests (and I don’t have much appetite to repeat them), but my recollection is flights that begin on the ground are populated with the current date and time. Those that are loaded from flight files saved in the air start with the time and date saved in the flight file.
Richard wrote “We also know from the Initial Examination Report (Malay) dated 19th May 2014, that the data fragment files found on his external drive MK25 in a shadow volume are automatically created after the computer is unused for 15 minutes. Clearly these were saved automatically to the MK25 external drive, because he was running from the MK26 external drive.”
While it is stated that MS Windows default behaviour is to create a volume shadow snapshot every 15 minutes, that only occurs if the system is idle. A Windows PC is rarely, if ever, sufficiently idle to do this. The definition of idle is a level of CPU usage that simply doesn’t occur even without any user interaction. In fact, I have never experienced a Windows PC do this. The fall back is that a snapshot is taken once per week, as I recall that is scheduled for a Sunday at a specific time. Alternatively, a snapshot is made prior to applying Windows Updates (released once per month) or when applying application updates.
The exploitation of VSS by Windows to make the snapsots is discrete to a volume, that is an NTFS volume, not a physical device. Without additional third party software the shadow is maintained on the original volume.
@Victor Iannello
Re : “The missing repeat of the handoff frequency near IGARI can easily be explained by the captain’s knowledge that he would not be checking in with Vietnam. Considering that MAS aircraft would be very familiar with the handoff frequencies from Malaysia, I don’t see why the captain would believe that would signal a problem, which it did not.”
My reading of the last comms are:
1.12:50:06 (ATC) Malaysian three seven zero, climb flight level three five zero.
2.12:50:09 (MAS 370) Flight level three five zero, Malaysian three seven zero.
3.01:01:14 (MAS 370) Malaysian three seven zero, maintaining level three five zero.
4.01:01:19 (ATC) Malaysian three seven zero.
2. Correct read back.
3. Not necessary. But sometimes used to prod ATC for swift release to next sector.
5.01:07:55 (MAS 370) Malaysian… three seven zero maintaining level three five zero.
6.01:08:00 (ATC) Malaysian three seven zero.
7.01:19:24 (ATC) Malaysian three seven zero contact Ho Chi Minh 120 decimal nine. Good night.
8.01:19:29 (MAS 370) Good night, Malaysian three seven zero.
5. Another prod to ATC for release.
6. Yes I know you are all ready for the hand over.
7. 11 long minutes later and the release finally comes.
8. Incorrect read back, contact frequency read back omitted. I would suggest more for reason of haste, which to me was suggested by the earlier non standard calls by the crew.
I would therefore suggest the crew were keen to terminate contact with KL ATC as early as possible. Preferably before reaching IGARI.
@Tony said: I would therefore suggest the crew were keen to terminate contact with KL ATC as early as possible. Preferably before reaching IGARI.
I think that’s possible.
@Tony (@Victor)
All good points.
Perhaps we do need to closely analysise the implications of a “possible” attempted “early hand off” more closely, to see if it “really was” an impatient Z, trying to get away ASAP.
His “position” at 01:08:00 Hotel (17:08:00 Zulu) is the key here.
He was virtually at the east coast.
Let’s assume Z wanted to get to Penang as soon as possible.
Let’s further assume that he wanted “the handoff” as soon as possible, so that he could then serepticiously switch off the transponder only slightly therafter, and hope that the ATCO, (whio is now no longer interested in him), would not notice.
He would have needed to do this, so that his upcoming left turn would not be visible to any of the ATCO’s on their SSR sector displays.
So, let’s assume, that he had planned to turn overhead WMPR (the “island” of Pulau Redang).
This would suit nicely.
From his point of view, he needed:-
(a) to remain within the Malaysian FIR (avoiding Vietnam and Thailand)
(b) to be at FL350 (he was already – check)
(c) to be outside Koya Bharu civil Terminal PSR range (he was – check)
(d) to be outside Trengganu civil Terminal PSR range (he was – check)
(e) to be able to turn left to Penang without being “seen” by any civil ATC Officer on either their short range Terminal PSR Displays (though perfectly visible to Military PSR) or their long range SSR sector displays.
(f) to be able to avoid military airspace WMR109 (to avoid raising any alarm bells in the Malaysian Military PSR rooms).
(g) This route would have also kept him “well away” from Thailand Military PSR as well, in stark contrast to the less preferred IGARI route, which forced him to “skirt the border”.
So, if he had planned to turn overhead WMPR, his total flight distance from WMKK to WMPR to Penang would have been roughly 360nm. But, since he did not get “the early handoff”, he was forced to go via IGARI.
That route (WMKK to IGARI to Penang) became roughly 500nm, which “cost him” an additional 140nm of ultimate range (and an aditional 18 minutes flying time). So, he could have arrived at Hamid’s phone registration (17:52z) at 17:34z.
I also think that Z later took a “short cut” by turned off the VAMPI track, near the “island” of Palu Perak, and proceeded directly across southern Ache via TASEK to WITC, because:-
(a) he was now running nearly 20 minutes “late” on his preferred paln, and
(b) he had “lost” 140nm in ultimate range (which, at end of flight is worth two and a half degrees of latitude further south).
@ Don
Many thanks for the further and very helpful detailed information!
1. You wrote: “The fall back is that a snapshot is taken once per week, as I recall that is scheduled for a Sunday at a specific time.”
2. You wrote: “Without additional third party software the shadow is maintained on the original volume.”
ATSB state that “The simulator data was a partial reconstruction of a flight simulator session from 2 February 2014.” 2nd February 2014 was a Sunday. May be we were lucky, that the data fragments found on the external drive MK25 were auto saved that Sunday during the ZS simulation of a flight to the SIO using FS9, which was installed on MK25.
ZS obviously carried on with the simulation on MK26 using FSX as the last recorded modification to MK26 VSI was on 3rd February 2014, according to the Initial Examination Report (Malay) dated 19th May 2014 p.206.
The assumption by the RMP that ZS used FSX is only partially correct. ZS appears to have used both FS9 and FSX for the SIO simulation, but the data fragments we have are from FS9 and most likely from the autosave Sunday 2nd February 2014.
This explains the discrepancy in the [datetimeseason] between ATSB with the date 2nd February 2014 from the FS9 simulation and the RMP with the date 21st February 2014 from the FSX simulation.
ZS could not have run the FSX simulation actually on the 21st February 2014 as he was flying to Beijing and back from midnight that day.
@Richard
@Victor
The RMP Preliminary Case Report (English) dated 13th May 2014 clearly states that FSX was used with the PSS 777-200LR Malaysia no VC add on.
Do you believe that that is correct? Do you think that the flight sim aficionado who had two versions of Microsoft’s Flight Simulator (FS9 and FSX) and two different B777 add-ons (PSS and PMDG) installed, used the PSS add-on with the version of MSFS that it is not designed for?
According to Yves Guillaume’s analysis of the Aircraft Specific Input Parameters of FS9 (2004) and FSX in his excellent document Flight Dynamics in Microsoft Flight Simulator dated July 2012, the formats are largely identical with some additions for the new FSX features. Please see Appendix 3.
All very enlightening to be sure. The fact of the matter is that PSS designed their B777 add-on for FS2000. It runs under FS2002 and FS2004. When I queried PSS Product Support specifically on whether their add-on would run under FSX their response was,
‘Unfortunately it is only compatible with FS2004. If you are looking for a 777 for FSX may I recommend PMDG.‘
Here it is probably also worth noting Z’s Facebook post of 10 November 2013 where he is opining on the PSS B777 add-on; he writes,
‘I hv yet to see a good addon as the PSS boeing 777 which was release many years ago. Unfortunately its for FS9‘
Victor, do you want to chime in here?
… but the details from the ATSB are misleading.
That is certainly not my experience.
Victor and Yves found 8 data points, of which 6 were useful for their analysis. The RMP Preliminary Case Report Appendix A shows the raw data of the same 8 data points.
It shows some of the data from those 8 data points.
Victor and Yves used the nomenclature 2N, 3N, 5N, 10N, 45S-1 and 45S-2 for the useful data points for their analysis and noted 6-2 and 7 as additional points.
Co-ordinate 6-2 is almost certainly another Program generated temporary flight file that was created when the ‘Create a flight’ function was used, an aircraft type was selected and the user then amended the departure airfield. The 100 percent full tanks, including a number of tanks that aren’t fitted to the B777, are a fair indicator that this is the case.
Co-ordinate 7 shows a B777 that has been flown back on the ground, manually lined up for 32R at Kuala Lumpur.
It is regrettable that we do not have [DateTimeSeason] values for those files.
You say the ATSB state that 5 data points had a [datetimeseason] reference to Year=2014 Day=33 (2nd February 2014).
Yes, I do. Victor, do you want to chime in here? My understanding is that you were given the same information.
RMP state that 8 data points found on the external disk MK25 in the shadow volume were compared to the 8 data points found on the external disk MK26 in the saved .FLT files all had a [datetimeseason] reference to Year=2014 Day=52 (21st February 2014).
I don’t think that it says that. Frankly if you can make head or tail out of that Manglish translation you’re doing better than me.
How do you account for the ATSB statement “complete”, when the raw data shown by the RMP is definitely scrambled at the start and end of each data fragment?
I thought that there was a long held understanding that an authority outside of the RMP had analysed the recovered disks and that’s where the ATSB got their information from. That external agency appears to have recovered more complete files than the RMP (to the astonishment of anyone?)
Separately I believe that Don may have a view as to what that scrambling (my term is ‘mumbo jumbo’) may be.
How do you account for the discrepancy between the ATSB and the RMP on the number of data fragments?
Pretty much the same way that Victor and Yves only focussed on some of the data files – someone formed the view that Co-ordinates 6-2 and 7 weren’t germane.
How do you conclude FS9 was used, when the RMP state FSX was used to create the data fragments?
Because you wouldn’t get files for the PSS Boeing 777 add-on being created in FSX.
Do you think ZS did multiple runs of the SIO simulation with the same coordinates and flight parameters using both FS9 and FSX?
No. I think that the data files in question were generated on 2 February using FS9/PSS and that the RMP have royally ballsed up their analysis, or translation of the original report, quite possibly both. If there was some third opportunity for the RMP to stuff this up I’d throw that in at short odds as well.
We also know from the Initial Examination Report (Malay) dated 19th May 2014, that the data fragment files found on his external drive MK25 in a shadow volume are automatically created after the computer is unused for 15 minutes. Clearly these were saved automatically to the MK25 external drive, because he was running from the MK26 external drive.
The report gives the Volume Shadow Information (VSI), last modified 03 FEB 2014 as:
{OOd7ef6c-8bcb-1Ie3-b3f7-ee8a9181afad} {3808876b- c176-4e48-b7ae-04046e6cc752}
This ties up with the MK25\MK25\D\System Volume Information\ given in the Preliminary Case Report (English) dated 13 May 2014 Appendix A p.148 regarding the data fragments found.
Sorry, not my table – I see that Don has offered his views on this – but isn’t there an inconsistency there? How did 20 February data end up in a 3 February file?
You also appear to ignore my points about deleting his password file (User2.txt) from his external drive MK23 on 20th February 2014, which contained all his (in total 77) banking, online shopping, email, work, social media, mobile phone and online forum passwords.
You only do that, if you are planning not to return.
Okey doke, so you originally wrote, ‘In addition, we are told that he uninstalled his Flight Simulator and deleted his passwords file on 20th February 2014 in preparation for his flight the next day to PEK (or the SIO).
There you are conflating evidence, conjecture and opinion. What we know from the Initial Inspection Report prepared by the Computer Crime Investigation Section on 19 May 2014 is that:
FS9 had been uninstalled from the MK25 drive on 20 February and that the drive was found disconnected.
FSX was installed on the MK26 drive and this drive was still connected to the Mk20 Corsair PC.
So, based on just those two statements it is incorrect to say that ‘he uninstalled his Flight Simulator‘. FSX was not only still installed but it was still connected to the PC.
Further, we know that a text file containing password data was deleted from either the MK23 (500GB) or MK24 (1TB) and that those drives were also disconnected.
We also know that there had been a history of system crashes off his sim dating back to December 2013.
Maybe he disconnected the drives and uninstalled one of his sim programs because he was looking to rebuild the whole shooting match. Maybe he did delete that text file in anticipation of the joining the choir invisible. Or maybe he deleted it because he didn’t want it left on a disconnected drive.
@Mick Gilbert
I can give you a long list of information withheld or errors by the ATSB.
I can give you a long list of information withheld or errors by Malaysian authorities.
Please see my previous post today at 06:14 am.
ZS used both FS9 and FSX.
@Mick Gilbert asked: Victor, do you want to chime in here?
1. ZS had installed two versions of MSFS: PSS 777 on FS9 on MK25 and PMDG 777 on FSX on MK26. The incriminating simulator data was from the PSS 777 on MK25.
2. The Malaysian investigators conflated the two versions, either intentionally or unintentionally. The FSX version was used to generate template flight files that were compared against the incriminating simulator data from FS9. It appears most of the investigative work was performed using the FSX version. For instance, the log book summaries are from the FSX version.
3. The following statement is found in the conclusion section: From the forensic examination as of the report date, it is found that there was no activity captured on exhibit JP01 and MK 26 that conclusively indicate any kind of premeditated act pertaining to the incident MH 370. However, the incriminating data was found on MK25, not MK26.
4. Regarding the date of the simulation, from a previous post on the simulator data:
“From the ATSB’s report, we learned that on April 19, 2014, the Australian Federal Police provided the ATSB with the recovered simulator data. The report states that The simulator data was a partial reconstruction of a flight simulator session from 2 February 2014. Based on the February 3 date of the volume shadow, we already knew that the simulation was created on or before February 3. However, I was curious to know how the ATSB determined that the exact date of the simulation session was February 2 since the information about date and time was not included in the file fragments that were provided in the RMP report.”
“After some email exchanges with the ATSB, I was surprised to learn that the ATSB has additional data values from the recovered flight files that were omitted from the data sets that were provided in the RMP report. In particular, there is a section of the flight files in which the date and time of the simulation session are stored. These data values tie the date of the simulation to February 2, 2014. Also, the time values show that the chronological order of the data sets matches a flight departing KLIA, flying over the Malacca Strait, continuing past the Andaman Islands, turning to the south, and exhausting fuel in the SIO, in the same order that the progressively depleting fuel levels suggest. The time values also indicate that the flight session lasted for about one hour. This confirms that the position and fuel levels were modified during the simulation, just as Yves Guillaume and I had concluded in our paper.”
5. Regarding the other data sets that were found on MK25, from the previous post on the simulator data:
“Of the eight total flight file fragments that were recovered, three were for an aircraft on the ground at Kuala Lumpur International Airport (KLIA), and five were for an aircraft flying. Based on fuel levels and other indicators, the data sets in which the aircraft is flying can be related to one of the data sets for the aircraft at KLIA, i.e., six data sets appeared to be related to a single flight. The remaining two data sets at KLIA show fuel levels that are not consistent with the other data sets. These fuel levels may reflect intermediate values before the final takeoff fuel levels were selected.”
6. On the frequency of the creation of Volume Shadows, this blog article is an excellent summary of how VSS works, and states:
“By default, the System Restore task is scheduled to run every time you start your computer and every day at midnight, as long as your computer is idle and on AC power. The task will wait for the right conditions for up to 23 hours. These rules are specified in Scheduled Tasks and can be changed by the user. If the task is executed successfully, Windows will create a restore point, but only if enough time has passed since the last restore point (automatic or not) was created. On Windows Vista the minimum interval is 24 hours; on Windows 7 it is 7 days. As far as I know, this interval cannot be changed.”
I hope that answers all the questions.
@Victor
Yes you are correct re: TimeDateSeason, in FS9 if you start a new flight from scratch from the runway, it is populated with today’s date and you can change it. I almost never start new from the runway, so that’s why I never have today’s date in there. In those cases where I was taking off from KLIA, I set for 8-March-2014 or a surrogate date to have a setting moon.
@Ventus45
That is good point about IGARI delay. That could explain hypothetical plan changes such as FMT location and other choices.
@Victor,
1.What do you understand by exhibit JP01? MK26 or MK25 or another exhibit?
2. Were you “curious” or doubtful about the ATSB assertion, that the data fragments were captured on 2nd February 2014?
3. If the simulation date time stamp is contained in the data fragments, as claimed by ATSB, why is this missing from the RMP report, in your view? Why is this also missing from the ATSB report dated 3rd October 2017, in your view?
4. When you say, on Windows 7, which ZS was using on both MK25 and MK26, for both FS9 and FSX, that the restore point is every 7 days, do you agree with Don that this is scheduled for a Sunday?
@Richard: To answer your questions:
1. JP01 is only referenced once. I don’t think it is MK25 or MK26. It is unknown.
2. I would be surprised if the ATSB got the date wrong.
3. The RMP investigators and the investigators that were responsible for the materials handed to the ATSB (likely the FBI) might have used different forensic tools, used different settings for matches, or had different levels of capability. I don’t know what data you believe is missing from the ATSB report from October 2017.
4. I am not aware that the Windows 7 restore point is specifically scheduled for a Sunday. Rather, I believe Windows 7 waits for idle time AND for a minimum of 7 days after the last restore point.
@Richard
Re: Item (2)
I would ask if ASTB said (a) the file fragments were captured 2-Feb, or instead if they said (b) the TimeDateSeason user setting in the FS9 program saved data was set for 2-Feb…I am thinking it is the latter. My understanding we do not have a file time stamp, except maybe 3-Feb (with no time given) for the shadow drive.
If we had all of that info (real time save vs. user time setting data in the program) then we might have further insights.
For example, I am trying to make an argument for CMH180, but that takes about 6 hrs flying time, which I can do in 5-minutes by running max (64x) speed, but still the simulator program clock would run 64x too, so I am shot down on CMH180, unless I can show real time might support that. But I have no real time data.
@TBill
@Mick Gilbert refers to the ATSB stating the [datetimeseason] setting was Year=2014 Day=33 (2nd February 2014).
The ATSB report states “flight simulator session” was 2nd February 2014, not external drive last modification date.
So I believe you are right to say, that the internal simulator setting was 2nd February 2014.
When the external drive MK25 was last modified, we are not told by the ATSB.
The RMP were only concerned about the date the external drive MK26 VSI was last modified on 3rd February 2014 and not the external drive MK25.
@Victor stated that he would be surprised if ATSB got the date wrong.
So @Mick and @Victor appear to support the ATSB information.
You and I question the ATSB information.
I guess we will never know.
@Richard
We have to admit it *might* make sense that the sims were run 2-Feb.
But I am not following if that would be consistent with the volume save after 7 days inactivity.
@Ventus 45.
“Perhaps we do need to closely analysise the implications of a “possible” attempted “early hand off” more closely, to see if it “really was” an impatient Z, trying to get away ASAP.”
I believe the starting point with the above is the filed FP. That is :
DCT PIBOS R208 IKUKO M076F290 R208 IGARI M765 BITOD N0480F330 L637 TSN N0490F350 W1 BMT W12 PCA G221 BUNTA N0480F350 A1 IKELA N0480F350 P901 IDOSI N0480F390 DCT CH DCT BEKOL K0890S1160 A461 YIN K0890S1190 A461
FL 350 was not expected until BUNTA. So he seems to have got an early clearance for that level to IGARI. I wonder whether this is routine for outbound flights in that particular sector of KL airspace. Normally early releases do also help reduce ATC workload. Perhaps there are crews following this blog who are familiar with the routings and can shed some further light on this. It seems the crucially important aspect for closer examination is the departure to the FP cruise level of the flight.
@Victor:
“After the last radio transmission from MH370, the maximum time available to disable the transponder and divert the aircraft was 64 seconds. That leaves an impractically small amount of time for a third party to enter the cockpit and take control.”
So if the air/ground VHF comms are anything to go by, the last 64 seconds may not be so critical in the overall scheme of things.
@TBill
2nd February 2014 was a Sunday.
Don suggested: “The fall back is that a snapshot is taken once per week, as I recall that is scheduled for a Sunday at a specific time.”
Victor responded: “I am not aware that the Windows 7 restore point is specifically scheduled for a Sunday. Rather, I believe Windows 7 waits for idle time AND for a minimum of 7 days after the last restore point.”
@Richard: In Section 6.4.5 of Folder 1 of the RMP report, it is stated that the simulator flight files were found on MK25, not MK26. This is consistent with the installation of FS9/PSS 777 on MK25. That said, in Section 6.5.6, they mention finding matches on MK26. I don’t think they are referring to the flight files for the SIO flight, but I admit it is hard to know for sure.
@Victor
That is why I concluded that ZS ran the SIO simulation on both FS9 and FSX.
Victor wrote “I am not aware that the Windows 7 restore point is specifically scheduled for a Sunday. Rather, I believe Windows 7 waits for idle time AND for a minimum of 7 days after the last restore point.”
That may well be the case. It is certaintly not every 15 minutes, as noted in the RMP material, and that is the most important point I wished to contribute.
Do also note that a restore point will normally be invoked during the Windows Update processing, and it’s possible that a third party software install may also invoke a restore point.
Having just checked my own Windows 7 ‘Enterprise’ edition install I can confirm that the scheduled invocation of the ‘System Restore’ task (that initiates the shadow copy) can be modified by an adequately knowledgable user using the Windows Task Scheduler. Note, my install is the ‘Enterprise’ edition: its defaults may not be reflected in other editions.
We are, yet, left with many unanswerable questions about the MSFS build. Unanswerable without access to the original drives, or the clone images of the drives.
@Tony
(1) It is worth noting again, that Zs clearly requested “Level 350 to Beijing” on first contact with ATC, whilst still at the Gate.
I think we can reasonably infer, that Zs definitely wanted to get “up – up – and – away”.
(For Old Aussies:- NOT with TAA !!)
(2) In the filed flight plan that you quoted, it is interesting to note, that the FIR boundary between the Kuala Lumpur (WMFC) FIR and the Singapore (WSJC) FIR is at IKUKO. The airspace between IKUKO and IGARI is technicall in the Singapore FIR, but it is (by agreement) normally managed by Kuala Lumpur.
Given the lateness of the hour ( or early AM if you prefer ) and with very little traffic in that area, Zs may have hoped for an early hand off to Ho Chi Minh (VVHM).
It is 74nm from IKUKO to IGARI, where Ho Chi Minh would be awaiting his call.
That represents a time window from IKUKO to IGARI of some nine minutes, ample time for him to “vanish”.
(3) IKUKO is only 13nm from WMPR.
(4) A left turn just past IKUKO to 261 would overfly WMPR, and leads directly onto Airway W546 (joining at OPOMO) which is parallel to the boundary of WMR-109.
(5) At the end of the 9 minutes (when he should have been at IGAI and turning for BITOD) he would in fact be over 120nm away, at about 6 or 7nm out from OPOMO (just off the NE corner of WMR-109) and heading direct to Penang.
Food for further thought ?
@Tony
@ventus45
RE: “FL 350 was not expected until BUNTA. So he seems to have got an early clearance for that level to IGARI. I wonder whether this is routine for outbound flights in that particular sector of KL airspace.”
Yes. Aircraft are normally cleared to a lower level initially, but are then cleared to the requested level after coordination with Singapore, subject to the traffic situation. There’s not much traffic at that time of night, so it’s not unusual that MH370 was cleared to FL350 much earlier than planned. The lower level specified in the ATS flight plan (FL290) is only for planning purposes and does not prevent the crew requesting a higher level.
@all
Shah was a very complex and tormented individual.
https://www.thesun.co.uk/news/7483593/zaharie-ahmad-shah-mh370-pilot-malaysian-airlines/
It is difficult to believe he was not involved in a conspiracy of some sort. The details of which may never come to light.
I doubt the messaging early in the flight or the history of his flight simulator usage will give us any insight into what occurred.
@all
On The Significance of Zaharie’s Simulator Data – S1 and S2
@Tony
@ventus45
Also, I think it was Fariq who requested and read back the clearance.
My take on the double FL350 call was that it was either a gentle hint to hand over to HCM, or perhaps Z thought FL370 was the requested level and was a hint for further climb. After all, at their weight it would be showing as the optimum level on the FMC.
There may have also been slight confusion with the 370 call sign, so in the back of Z’s mind 370 was the requested level.
So I don’t think we can read anything suspicious in the two FL350 calls.
@Ventus45
Your essay is welcome because we do need to brainstorm the possible significance of simulator work. But the key point is we do not know what the captain might have had in mind, either for the sim cases or the real flight.
It is stretch to suggest the sim studies conducted in the afternoon, based off an apparent MH150 flight to Jeddah, flying in a trajectory towards below OZ, somehow reflects an hidden or dervied intent to hit the sunlight terminator far to the West in the real flight.
I recently find that the fuel loaded at SimCase N10 is just enough to get to the magnetic South Pole at 64.5 South/137.5 East directly due south way below OZ. If flying in CMH180 the sim flight would go to Magnetic South Pole with no need for waypoints. That is my latest hypothesis for the sim flight intent. Not sure the real flight intent but CMH180 is certainly on my radar.
@Ventus45
A very thought provoking paper!
I agree with you completely, that ZS meticulously planned the hijack to the SIO.
I also agree with you that he wanted to get as far away as possible from anywhere in the SIO. The location as far away as possible from Australia, Antartica, the French Southern and Antarctic Islands, Heard Island and the McDonald Islands is 50°S 94°E. ZS knew that he had to pass between Indonesia and the Andaman Islands at 6°N 94°E, so a route due south as far as possible toward 50°S 94°E would be optimal. Your range of 45°S 104°E to 45°S 84°E, either side of 45°S 94°E makes perfect sense.
ZS knew that the fuel required to get to 50°S 94°E with a total flight distance of 7,934 km, would be doable with the fuel load for the upcoming flight to Jeddah on 04FEB2014 with a total flight distance of 7,070 km, when reserve fuel is taken into account.
The next point you make is that ZS planned to fly in darkness. The Jeddah flight MH150 departs at 15:15 local time and arrives at 19:30 local time, which is all in daylight. The next candidate was the Beijing flight MH370 on 21FEB2014 departing at 00:35 local time. This flight starts in darkness, but as you point out, is too early in the year to remain in darkness all the way to the SIO. I would also add that the moon rise on 21FEB2014 is at 23:06 local time at 6°N 94°E and the moon is at 71% brightness. Much better to wait until the next candidate on 08MAR2014, when the moon sets at 00:16 local time at 6°N 94°E and the whole flight can be conducted in solar and lunar darkness.
The only problem about the Beijing flight is that there is less fuel available. ZS knew from previous experience, that he would only have ca. 49,700 kg as opposed to 65,200 kg for the Jeddah flight or 91,200 kg for the next candidate the Amsterdam flight scheduled on 20MAR2014. Victor and Yves calculated that ZS had entered 68,424 kg in the SIO simulation run dated 2nd February 2014, that was retrieved from his home flight simulator. ZS decided to take the less fuel option of the Beijing flight, knowing it would get him at least to around 35°S 94°E.
@Victor
The paper you co-authored with Yves on the ZS Flight Simulator is based on the restore point data found on the external solid state drive MK25. A total of 8 coordinates are shown in the RMP Preliminary Case Report Appendix A. Each coordinate is surrounded by scrambled data, which is evidently from the Windows 7 SP-1 operating system. The FS9 fragments in between the scrambled data are legible but incomplete. Each fragment is 4096 bytes or 1 NTFS cluster in length, as Don has previously pointed out.
You show from the FS9 data content, that there are 6 co-ordinates where the GForce and MaxReachedEngine RPM align and the fuel amounts, despite manual adjustments by ZS, generally matched expected values. Don pointed out that the various GUI IDs are the same for all 8 coordinates. You have clearly shown the alignment between these coordinates.
The last coordinate would have been shown on page 62, but this page is missing from the RMP Preliminary Case Report Appendix A. I wonder why? What coordinate did it show? Was this missing page intentionally removed?
I also still find it notable, that on the same day 2nd February 2014, as ZS planned the hijack to the SIO, he also spent 45 minutes on the phone to his cousin, school friend and MAS Aircraft Engineer colleague Zulhaimi Bin Wahidin. The RMP does not appear to have followed up on this call. When later asked about the call Zulhaimi Bin Wahidin stated, that this was just a personal chat and catch up call, that had nothing to do with work or aircraft. I find it a strange coincidence and a long call for just a personal chat. Perhaps they talked about politics and personal frustrations with the corrupt regime, or even what ZS planned to do about it. Zulhaimi Bin Wahidin was one of the first to try and call ZS on his mobile several times on the 8th March 2014 after MH370 was declared missing.
@Richard
Fuel is, admittedly, the thorn in our side, so to speak, and Zaharie’s as well. But we know (well, I am pushing the idea) that “he knew” that he could do it, with only 49,700Hg. So the question becomes, how did he arrive at that decision, rationally ? The only logical answer, is that he “planned” on a much shorter path (track miles) than anyone here has yet seriously considered.
To me, there seems to be only one plausible answer.
He wasn’t planning on even going to PIBOS, let alone ZBAA.
I ran this scenario past TBill by PM on Twitter last night (early AM – like 4am !)
I am not staying up late tonight ! (It is approaching 22:30 local).
I think the MH150 flight to Jeddah is a complete red herring.
Consider this.
What if Z had planned to “take” MH370 on the ground – by somehow “neutralising” the FO – during taxi from the gate to the runway ?
The hold before entering the runway, and the hold on the runway, and the wechat call are all suspicious.
A man “playing for keeps” would have no limits.
In any case, I think Z actually simulated an escape, by taking off, and instead of going to Pibos – Igari and onward to ZBAA, he intended to go like a bat out of hell straight up the Malacca Strait. The fuel load at takeoff was irrelevant to the sim run, because he only had to go as far as actual “anticipated” MH370 fuel would take him.
[Adding NOW – he could not just simply put MH370 fuel in the sim run, because that would give the game away too easily.]
You have a sim. Try this.
Set MH370 takeoff data, weights and fuel.
Then Fly this route.
WMKK ASOGA GUNIP N571 VAMPI N571 MEKAR N571 LAGOG 4500S10400E
How long does it take, and how much fuel do you use ?
Does it reasonably match known MH370 flight time and / or fuel burn ?
I got a flight time of 8 hours and 1 minute in skyvector, which means arriving at 00:42, but a bit short on fuel.
Then try this route;-
WMKK ASOGA GUNIP B466 TOSOK SANOB P627 IGEBO P627 BEDAX 4500S10400E
I got 7 hours 26 minutes in skyvector, arriving at 00:07, and the fuel is good too.
What do you get ?
We can break this flight into two halves – by hemisphere.
He already knew how much fuel was required from 0.00°N 94°E to 45°S 104°E. Subtract that from the MH370 fuel load, and he then knows how much fuel he has to play with to get to the equator.
So, in the sim run, he only had to “simulate” how much fuel would he used to get from WMKK to the equator near 94°E, depending on what route he took to get to 94°E. The actual fuel loads were irrelevant really, it was only the “differenc” between KL and the equator that mattered.
Thus, he had to try a number of routes to see what was “doable”.
I don’t think any of the routes we have been studying up to now are doable. I have proposed two that are close, above.
BUT, we know that on the night, he could not, and did not, take either of those routes, or any near equivalents.
He went via IGARI and Penang.
He knew he could not make 45°S by Penang, but he still had to get as far south as possible. He knew he was way behind the eight ball on fuel turning Penang. He knew he had to improvise. So what did he do ? Did he in fact, have a contingency plan up his sleeve all along ?
Being the meticulous guy he was, I am betting he did. I have a theory that I shared with DennisW a week or two back, but I will not put that up here yet, because it may contaminate the original thoughts of others.
And bugger, it is now 23:05 local. Good night troops !
@Richard asked: Was this missing page [62] intentionally removed?
The pages appear in the order 60,62,61,63. You can find page 62 before 61.
@Victor
Thanks! Just where you would expect to find it!
@Ventus45
For you route: WMKK ASOGA GUNIP N571 VAMPI N571 MEKAR N571 LAGOG 4500S10400E
I get a similar time, but a fuel shortage of 1,776 kg.
For your route: WMKK ASOGA GUNIP B466 TOSOK SANOB P627 IGEBO P627 BEDAX 4500S10400E
I get a slightly faster time than you and a fuel excess of 2,157 kg.
As you say, we know ZS did not fly either those routes.
As soon as ZS had decided that MH370 on 8th March 2014 was his target, ZS planned to detour at the FIR handover just after IGARI. With this revised plan, ZS knew from the start of the hijack flight he would only make 35°S 94°E.
@Ventus45
@Richard
Keep in mind MAS was planning on two daily flights to Jeddah, with a redeye that never happened. So Jeddah makes possible sense as a tentative plan.
However, Jeddah flight might have been controversial choice of flight politically, and also would have had 3 pilots.
Also note the Flight Time of the recovered sim data matches MH150, as well as fuel load and flight path similarity. Having said that we do not know for sure.
ventus45 wrote “ So the question becomes, how did he arrive at that decision, rationally ? The only logical answer […]”
rationally
logical
Using either word in connection with the sequence of actions that unfolded during the night of 7th-8th March seems illogical, or even irrational?
@ventus 45
Both of the routes you have suggested, via LAGOG or BEDAX are inconsistent with the BFO error at 18:40, since the turn South would have had to have been made before then.
Also, I am having trouble accessing the link you provided in your post of Nov 15 @8:46
@Victor
Is my memory correct you had in one of your reports mentioned that the turn at the last mil radar contact was ” impossible”. May I enquire as to the reasons you came to that conclusion. Apologies in advance in case you have already explained. If that is the case could you please direct me to where I can read these.
@Tony asked: Is my memory correct you had in one of your reports mentioned that the turn at the last mil radar contact was ” impossible”
What I said was the turn as graphically depicted in the early reports (such as the ATSB report from June 2014) was impossible. I think that sharp turn was just somebody’s poor attempt at connecting sparse radar targets. The track relative to IGARI is also incorrectly depicted.
In fact, when considering the errors associated with the military radar data at maximum range, I believe the turn could have been flown without disconnecting the autopilot.
I discussed this and other aspects in a previous post.
@Victor
I went back and looked at your previous post and the comment about coasting. If the tracker was some sort of adaptive process such as a Kalman filter, the previous behavior of the track would be taken into account. Since the path was mostly straight, the filter would lag the turn for a while, and then when the parameters were updated, it would more abruptly respond. That seems to fit with the “sharp” left turn. Coasting is a different artifact when there is a sequence of points missing where the path is projected along the previous path. It may be a combination of the two.
@Sid
(@all)
I made a few edits to the file and uploaded it.
I thought it would simply replace the original file and the link would stay the same.
Turns out that is not so.
Mediafile apparently considers it a new file and give it a ney link.
The new link is:-
https://www.mediafire.com/file/5v0bq6jin2v8v78/Ventus45-15Nov2020.pdf/file
@Sid Bennett: Whether the attempt to create the path was automated or manual, I believe the inaccuracy of the path and the sharp turn were artefacts due to the uncertainty of the sparse radar data. I believe the plane was likely on autopilot until after the last radar target at 18:22z.
@Sid
Those tracks were not flown, obviously. I never said they could have been, so the actual flight BFO/BTO non-matches are irrelevant. They were only “examples” of Zaharie’s possible original planning “what if’s” to work out his fuel problem from take-off to the equator.
@Richard
As I said above:-
“We can break this flight into two halves – by hemisphere.”
To be clear, what I meant by that was:- from a fuel point of view.
If we can “nail” the fuel needed for the cruise segment from the equator at 94E to 45S104E at FL350, we can subtract that from the 49,700, thus we would then have the remaining fuel available for his northern hemisphere segment to get to 94E.
Then we can “what if – back plot” from 94E to KL and try to second guess what he must have originally intended (planning wise).
From that, we can then compare actual fuel used from KL to Penang, to see how much of that “northern hemisphere fuel” he had used and how nuch he had left, at Penang.
Therefore, we need to know ACTUAL FUEL at Penang, because HE DID.
He would also have known how much extra was needed to get to Vampi to “pick up” his original planed track, and I am betting he knew he could not afford it.
How great the shortfall was, would have determined what he did next.
He would have had to have decided on one of two options as I see it.
Option 1, keep the original plan and go to VAMPI, and accept that he is going to end up way short of 45S (say he has lost about 600nm range, so he will end up arounnd 35S), or:
Option 2, if “getting to 45S” or as near to, is still the imperative, that becomes “the driver”, and forces him to make a cut across Sumatra.
@ventus45: The BFO at 18:25 is not consistent with a “cut across Sumatra”, if I understand your proposal correctly.
I can’t imagine the captain would have ever had a plan to divert soon after takeoff. The workload would be high, it would be hard to eliminate interference from the First Officer, passengers and crew in the cabin would be problematic, and surveillance from ATC would be high. All these problems disappear with a diversion near IGARI, lockout of the First Officer, and a subsequent depressurization.
All this alternative planning to arrive at the terminator with sufficient fuel and a desire to ditch appears incredibly contrived to me. I think it is much more likely that after he set the plane on a due South course and efficient cruise altitude, he chose a painless, hypoxic end.
@ventus45
You stated: “He (ZS) would have had to have decided on one of two options as I see it.”
A crash latitude ca. 45°S was the only option for a Jeddah hijack to fuel exhaustion.
A crash latitude ca. 35°S was the only option for a Beijing hijack to fuel exhaustion.
There was no attempt to make a 45°S plan, out of a 35°S plan, by diverting early or taking short cuts.
The ZS simulation aligns with a crash latitude of 35°S, when modified based on the decision to hijack a Beijing flight after waypoint IGARI, rather than hijack a Jeddah flight departing via waypoint GUNIP.
@Ventus45
I believe in the sim case, fuel was added after take-off.
So that is hard to understand. The only thing I can see at the moment is that there is enough fuel to get to Magnetic South Pole, in the simulator. Not sure how Richard might compare with Victor’s simulator fuel consumed numbers to 45/104, vs. real world.
@VictorI
Does autopilot imply that a diversion route was programmed at least in part before the diversion or is the diversion an input from the dashboard? Is the path back across Malaysia a clue?
@ventus45
Thanks for the re-post…
@Victor
“I can’t imagine the captain would have ever had a plan to divert soon after takeoff. The workload would be high, it would be hard to eliminate interference from the First Officer, passengers and crew in the cabin would be problematic, and surveillance from ATC would be high. All these problems disappear with a diversion near IGARI, lockout of the First Officer, and a subsequent depressurization.”
Acceptance of the perpetrator as the captain,the following become implicit.
That it was meticulously planned and executed without any alterations.
As to the timings of the actions involved, The work load on the flight deck reduces after t/o and climb to intial cruise level. Much of which is in the hands of automation.
Seat belt signs will be on, pax and cabin crew will all be neatly tucked up in their seats. The cabin will be nice and quiet, before the usual service commences. The after TO checklist having been completed The FO as the PF will be occupied monitoring the automatics and the captain dealing with the usual routine RT calls.
I would therefore be more inclined to ascribe a greater probability that action commenced during that time interval than at the very last moments at or seconds before IGARI. A large number of those in the cabin would surely have become aware of the reversal of course. Certainly i would have thought the cabin crew would have and would have become inquisitive and concerned. Unless of course they had received some sort of announcement from the flight deck to explain the reversal of course and to maintain calm in the cabin.
@Tony: If you are implying the turn back began before IGARI, the ADS-B data collected by the ATC receiver unequivocally shows that the path was normal until almost exactly abeam IGARI.
@Sid Bennett: The shape of the turn back path looks like it was flown using HDG (or TRK) SEL rather than by waypoints in LNAV mode. I strongly suspect the MFD was in MAP mode, and the heading was selected using standard displayed waypoints as guidance. It may be that the first waypoint entered into a route was VAMPI, and not until near Penang Island.
@VictorI
Thank you. Seems plausible.
This suggests that the actual takeover time was governed (ad hoc) by the evolving flight plan, but once the pilot had full control of the situation a more orderly approach was used. One might say that the remainder of the flight was informed by the simulations previously done. But it is an open question as to which aspects of the simulation were actually adopted.
@Sid Bennett
The key point is that ZS performed a flight simulation to fuel exhaustion in the SIO. This shows the hijack was pre-meditated.
It is of secondary importance, to what extent the flight simulation was followed in the actual hijack. In mv view, the flight simulation could not be closely followed in the actual hijack, as the Beijing departure was via waypoint IGARI, whereas the Jeddah departure, which was simulated, was via waypoint GUNIP, which lies between the simulated coordinates 3N and 5N.
@Victor
No I am not implying that the course reversal begun before IGARI.
I am trying to suggest the actions to divert the aircraft begun well before that point.
I think all the evidence from departure to the point of last radar contact is reliable. It is from that last ground contact that a search for evidence commences.
Your description of the turn as “impossible” drew my attention to that last ground contact. I thought if the manoeuvre was impossible, then it did not happen or it was mis- recorded. Taking these in turn, in the first instance for it to be possible it would involve a break up of the airframe. In the second it would mean the radar evidence is suspect as to its reliability.
The implications of these are a shift in the time frames of events.
In connection with drift analyses carried out, is the distance between the your estimates of the final point and the location of the nearest debris recovered known. I have read somewhere in the past, wreckage being found some 4000km NW from the search area on the shores of Reunion Island.
@Tony: We don’t have the military radar target data at the turn back. We have over-filtered speed and track data which if taken literally and mathematically integrated implies a smooth turn. We also have an image of the estimated track which shows an unrealistically sharp turn. I trust neither data set as a precise representation, as neither exactly matches the ADS-B data before IGARI. My best estimate is at some point after IGARI, the turn was flown with the autopilot engaged in HDG SEL mode.
I don’t think there were actions taken much before IGARI, as the possibility of interference from passengers and crew likely meant a depressurization occurred. This means the captain would have donned his mask, and this would have been very evident during the last radio call.
@Victor
“This means the captain would have donned his mask, and this would have been very evident during the last radio call.”
Thought provoking comment which encouraged the following.
Two matters arise.
First, emergency 02 mask. I do not know whether the flight deck was equipped with full face type. Assuming it was would/could there have been any sign/hint of this on the voice and ambient sounds analysis which I would presume must have been carried out as part of the investigation.
Second, voice stress analysis. Would it not be be reasonable to expect that at the crucially important IGARI turn the captain would have been under an elevated state of stress. Yet my reading of reports regarding voice comms suggest no abnormal signs were detected. All I can surmise from that is that if he was indeed the culprit, then best expressed in the vernacular, he surely takes the biscuit for having been one hell of a cool dude.
@Tony: Airline pilots have confirmed that if the captain was wearing the required quick-donning mask, it would be very evident during the radio call.
Yes, it means he remained cool during the final radio call. How cool do you think he would have been if a third party had taken control, as some have suggested?
@Victor
02 mask: Given it was not evident, would it not therefore follow that the safe assumption is he was not wearing it.
Sangfroid : Given his personal background, which has been thoroughly and carefully researched and examined, there is no evidence he possessed such a quality. So the answer must be that no ordinary person would have been able to maintain composure to the extent necessary as not to exhibits signs of stress in speech. But how many of us can really say how we will react, we will not know unless we experience it. It is a quality some possess but few ever discover even once in a lifetime. So I would suppose the existence of this quality from the captain`s character may not be wholly discounted.
I do wonder whether a stress analysis was ever carried out on Sully`s voice. According to many there was not even a hint of stress in his rt calls. He remained coll as a cucumber throughout the whole episode.
@Tony: I have not seen a scenario that aligns with more of the facts than a deliberate diversion by the captain. Not by a long shot. I don’t think there is enough evidence to convict in any court system where there is a presumption of innocence. That said, this blog is not a court of law.
If and to the extent this analysis of the flight and calculation of the crash site relies on Kate Tee’s alleged sighting, it needs to be recalculated.
@BG 370
The analysis of the MH370 flight posted in the header above is based on:
1. Inmarsat Satellite data for both MH370 and previous 9M-MRO flights.
2. Boeing Aircraft Performance and Navigation data for the B777-200ER.
3. MAS 9M-MRO Aircraft Engineering data from previous flights.
4. 9M-MRO ACARS transmission data from MH370.
5. Official and Public ADS-B transmission data from MH370.
6. Civilian and Military Radar data for MH370.
7. GDAS Weather data at the time of the MH370 flight.
8. AMSA Aerial Search data for MH370.
9. MH370 Floating Debris Drift data for 33 items found in the SIO.
This analysis is not reliant on eye witness reports.
@BG370
Can you give a few more words why you feel that way about Kate Tee’s possible sighting?
In general, we don’t really know what MH370 was doing between 18:25 until it hit Arc2 at 1941. When I develop a path, I usually do that Arc1-to-Arc2 part last, and I consider that speculation, but it’s nice to offer ideas.
In that sense, the current Godfrey/Ulrich/Iannello/Banks is a very well thought out proposal for the early flight path.
sorry above its DrB Ulich
@BG 370: In the timeframe that our estimated path was at low altitude and following waypoints along the north-south FIR boundary between Indian and Malaysia airspace, Kate Tee’s boat was very near waypoint NOPEK along this boundary. Putting aside the details of Kate’s description and the exact timing of the reported sighting, she very well may have been the last person to see MH370 from the ground. Even though we did not use Kate’s sighting to construct our path, we thought is was worth mentioning that she may have seen MH370.
@Victor
Am in whole agreement with you on the very purpose of this blog.
My approach is on the premise that all efforts are based on a forensic examination of all facts and circumstances and the scientific evidence available.
Accordingly I was merely attempting to test all that evidence against each other. In that sense therefore the circumstantial evidence points the finger at the captain. Moreover the greatest weight to that is his home computer and its fit to the route Inmarsat has plotted.
So without taking into consideration Kate Tee’s alleged sighting, where would the authors of the report calculate the crash site to be ?
Would it be at the same place (S 34.2342° E 93.7875°), or somewhere farther north, south, east,or west ?
@BG 370
I already explained, in a previous post today, that Kate Tee’s sighting or any other eye witness reports were not relied upon in our paper. As Victor explained, the Kate Tee sighting was worth a mention, as an aside.
The Last Estimated Position remains unchanged, as determined and recorded in our paper entitled “The Final Resting Place of MH370”, dated 7th March 2020, as 34.2342°S 93.7875°E.
Since you are pushing this issue, I believe it now behoves you to answer @TBill’s question, “Can you give a few more words why you feel that way about Kate Tee’s possible sighting?”
@Richard
No disrespect intended, but your group (Iannello, Godfrey, DrB, Banks) has no track record in finding anything. Nor has the Australian DSTG. Why in the world the crash analytics were not turned over to Metron is inconceivable to me.
@DennisW
Metron unsuccessfully competed for a contract to help in the search for MH370. Have you asked yourself, why they failed to get the contract?
Metron often quote how they found AF447. A personal contact of mine, who was advising BEA on the search for AF447 and present at the search meetings, has a rather negative few of Metron.
BEA originally assumed, that AF447 would be found within 40 nm of the Last Known Position (LKP).
Metron disagreed, because their model assumed that the emergency locator beacons work in 90% of the cases and AF447’s emergency locator beacons were not detected near the LKP. Lawrence Stone of Metron, finally admitted over a year later, that a visiting Professor of Systems Research from Cape Town University, South Africa, proposed a change to the Metron model, that they should assume the emergency locator beacons had failed, which turned out to be crucial.
After getting their model assumptions right, AF447 was found 6.5 nm from the LKP, in phase 4 of the search almost 2 years after the crash.
As for Metron’s help to find MH370, their senior analyst responsible for their MH370 efforts, by the name of Colleen Keller, stated “our new best guess for where to find MH370 is: The Indian Ocean”, which I find a less than helpful statement.
AF447 transmitted its position up to the time of impact, whereas MH370 stopped position reports over 7 hours before the crash. There is no comparison between the search assumptions for AF447 and MH370.
MH370 will be found within 140 nm of the Last Estimated Position at 34.2342°S 93.7875°E as stated in our paper dated 7th March 2020 and published above.
@Richard
I agree that the AF447 incident is not a good model for the MH370 incident, and I never referenced it.
While I have a high respect for you and your team members, your proposed LEP suffers the following serious issues IMO.
1> The EOF Doppler and AES comms history strongly suggest the aircrft terminated very near the 7th arc.
2> Your +/- 140 nm LEP spans 7th arc latitudes 32S to 36.5S. This range of latitude has been searched with an approximate detection probabilty of 90%.
3> The only scenario compatible with your LEP is PIC murder-suicide for which I have little regard.
@DennisW
You say you did not reference AF447. You may not have explicitly referenced AF447, but you implicitly referenced AF447. You stated it is inconceivable that Metron (whose only experience in commercial aircraft mid-ocean search is AF447) were not asked to lead the MH370 search. I do not understand your quibble.
1. Our primary search area is close to the 7th Arc. 140 nm is the least priority area. Surely you have read our paper..
2. Metron missed AF447 first time. OI missed San Juan first time. It is not possible to be 100% in underwater searching, when the seabed terrain is difficult and the crash site is at an immense depth.
3. The vast majority of analysts conclude it was a PIC murder-suicide. You are somewhat alone with your pet theory.
@Richard
Yes, I read your paper more than once. The +/-140 nm represents +/- 2.3 degrees of latitude along the 7th arc from 34.2S. I was not suggesting searching farther from the arc. Yes, everyone recognizes that there is not a 100% probability of finding the plane in a searched area. Simply a very high probability it was not missed.
Metron has pedigree related to finding things – SAROPS (search and rescue tool), real time tools for flight prediction and anomaly behavior, aircraft flight analytcs for NASA, Lost Cities for Canada,…
My theory has a significant amount of event related support. The murder-suicide theory has absolutely no evidence supporting it. Only speculation based on it being the only possible flight scenario ending far South on the 7th arc.
Actually the vast majority of analysts including you, Victor, and DrB have historically been motive averse going all the way back to the “Duncan days”. I recall Duncan telling me to go elsewhere if I wanted to discuss motive despite means, motive, and opportunity being the classic cornerstones of crime assessment and a prosecutorial requirement.
@DennisW said: Actually the vast majority of analysts including you, Victor, and DrB have historically been motive averse going all the way back to the “Duncan days”.
I challenge you to find one time that I was “motive averse”. On a consistent basis, what I have been averse to is speculation presented as fact with no supporting evidence. Over the years, I have proposed my own speculative scenarios, always identified as such.
As for Metron, it is a proven, high quality organization. Perhaps you should contact them and persuade them that they should use their talents to solve this mystery, whether or not they are “coin operated”. Whining on this site about their lack of involvement is pointless. Nobody here is preventing them from contributing in any way they want. I welcome their involvement.
So what exactly is your theory? That during the flight there was a demand to transfer a billion dollars, it was rejected, and the pilot tried to land on Christmas Island and failed? And by chance, the BTO and BFO after 19:41 has the signature of a straight flight, despite numerous turns and other maneuvers?
@Victor
Yes, my theory is a demand for a money transfer that was not met. I prefer your path to the Cocos as a possible final bail out, with the runway alignment manuever at the end to magnify distance to the North on the arc.
Richard: “BEA originally assumed, that AF447 would be found within 40 nm of the Last Known Position (LKP). Metron disagreed, because their model assumed that the emergency locator beacons work in 90% of the cases and AF447’s emergency locator beacons were not detected near the LKP.”
Here is a link to a report written by Stone & co. in Jan, 2011 before the wreck had been found:
https://www.bea.aero/uploads/tx_elyextendttnews/metron.search.analysis.pdf
Metron never disagreed with the 40 nm radius. Metron did not simply assume anything about the reliability of ULBs. Information on the reliability of the ULBs came from the BEA itself (Appendix B). The Phase 1 search for the ULBs focused on the Northern part of the 40 nm circle (in the direction of the recovered debris). Metron did provide input for Phase 2, a modest sonar search in an area not covered in Phase 1.
“Lawrence Stone of Metron, finally admitted over a year later, that a visiting Professor of Systems Research from Cape Town University, South Africa proposed a change to the Metron model, that they should assume the emergency locator beacons had failed, which turned out to be crucial.”
That would be Johan P. Strumpfer, a coauthor on the above report. How he came to work with Metron is unclear (he’s a business guy.) Figures 32 and 33 of the report give the probability distribution both without and with that assumption. Even without the assumption, the Metron model predicted that there was a 30% chance that the wreck had been missed.
There was also a report by the drift group:
https://www.bea.aero/enquetes/vol.af.447/phase3.search.zone.determination.working.group.report.pdf
This report guided the Phase 3 search. The 95% confidence region (Figure 63) didn’t even come close to the actual position of the wreck. Metron gave it very low weight.
@sk999
Thank you.
@Victor
I challenge you to find one time that I was “motive averse”. On a consistent basis, what I have been averse to is speculation presented as fact with no supporting evidence. Over the years, I have proposed my own speculative scenarios, always identified as such.
I accepted your challenge and reviewed virtually every document you authored. I could not find a single example of you articulating a motive. A scenario is not the same as a motive. How is that not being motive averse?
@DennisW: You’ve failed to show one instance where I am “motive averse”. Not “articulating a motive” does not mean I have am averse to discussing one.
The one contributor to this blog that might actually have evidence about a motive is TimR. I have encouraged TimR, both in blog comments and in many email exchanges, to disclose as much as he is able. That is the polar opposite to being “motive averse”.
As I’ve said previously, I am warming up to the idea that, as ventus45 proposed, the captain led collaborators on the ground to believe his intention was to negotiate and land the plane. This allowed safe passage back over Malaysia before ducking below radar and clandestinely flying south. Perhaps there were other demands that were thrown in, such as the freedom of Anwar Ibrahim. You’re fond of the money transfer. Although TimR’s story complicates the scenario, the captain’s deception of those in contact with TimR reconciles TimR’s version and the route to the SIO, although it’s all speculation.
@Victor
OK, you are advocating a path to the SIO from the FMT that offers no possibility of a safe landing. It is obviously a murder-suicide scenario (which you and none of your co-authors articulated). Do you really think the PIC (mostly likely Shah) intended to murder the passengers and Malay crew (most of whom he probably knew well)? I simply do not see that in his social media posts. I readily admit that it is simply my opinion based on my belief of being able to “read” people.
My comments on the area being previously searched stand. Your latest scenario has a very low likelihood of being correct IMO.
@DennisW, @sk999,
You both appear eager to try and re-write history.
Here is a quote from Lawrence Stone published on the Metron website:
“According to Stone, team member Johan Strumpfer, a visiting professor of systems research at the University of Cape Town in South Africa, proposed an assumption for their model that proved crucial in determining where the search for AF447 should continue: that the locator beacons had failed.
Based on this assumption, the statistical team recommended performing an active acoustical search in an area that had already been covered by the passive search. “In fact, the 2011 [undersea] search commenced in the center of the [probability] distribution and quickly found the wreckage,” they wrote. In early May 2011, the cockpit voice recorder and flight data recorder were found and recovered.”
The report written by Metron that you quote was dated 20th January 2011, which is when Metron finally admitted after 18 months, that they had got their assumption wrong. As I pointed out in my previous comment, as soon as this assumption was corrected, the search teams quickly found AF447.
@DennisW,
You stated: “Actually the vast majority of analysts including you, Victor, and DrB have historically been motive averse going all the way back to the “Duncan days”.
Your statement is not correct and you have a short memory.
You asked the same question, in a comment on this post above, dated 17th April 2020. You received a prompt and full answer from all co-authors.
As you also know, I spent a weekend in Kassel with Sabine Lechtenfeld (@littlefoot), who is a criminal psychologist, where we spent some time considering the psychological profile of ZS. You have also exchanged private emails with Sabine and myself on this subject.
I have commented many times on this current and previous posts on the motive, opportunity and capacity of ZS to execute a murder-suicide. In addition to an analysis of his psychological state, I have analysed and commented on his personal situation, political battles, public campaigns against the then government of Malaysia and their corruption, obsession with young models, etc.
I even organised a private anonymous survey of the IG members in 2016, that considered 15 alternative motives and scenarios for the MH370, to which all members responded including Duncan Steel.
I can assure we all have strong opinions and the co-authors have all gone public with their views on this blog.
Most recent news from Ocean Infinity. Additional detail from the vessel designer, Vard.
Adding to plans for nine 21m and 36m unmanned vessels, now an additional eight 78m optionally/minimally crewed vessels.
I expect the lower costs, that the operation of these vessels is likely to demonstrate, may bring the opportunity for a renewed seafloor search. Of course, the costs need to be covered. Ideas?
@DennisW: You are splitting hairs in your analysis of the captain’s personality. You believe the captain showed no signs of somebody able to commit murder-suicide (disputed by a pilot friend that knew him). Yet, in your scenario, the captain made an extreme demand which was refused, and that led to his killing the passengers and crew, i.e., committed murder-suicide. Not much difference.
@Victor
I would put it more broadly that stigma, reluctance, and/or cover-up about pilot suicide now seems to me almost the main reason the Xmas Island diversion option is popular with some. Not saying TimR has the syndrome, but his contacts might.
@Victor
Good grief.
You are completely missing my point. There is no question in my mind as to whether ZS committed murder-suicide. I firmly believe that he did. The key question is when he made that decision. Prior to takeoff-unlikely. At IGARI- unlikely. At the FMT-unlikely. After reaching the last possible landing area-I think so. I am sincerely trying to locate the wreckage. I am not trying to determine if ZS committed murder-suicide. With that goal in mind, it is very relevant to consider when that decision was made as it strongly influences the flight path selected.
It is obvious to me that you and Richard are reacting negatively to what I think are legitimate concerns about the conclusions in your latest report. I think it is a great effort as are your previous efforts. That is not the point.
@DennisW
Actually the “Duncan days” were appropriate and necessary as part of the process. At that time we were using even more limited information than we have today and we needed to agree on basic facts. We tried to separate hypothesis from fact, and we still should do that.
Over time, more scenarios were studied and generally the gaps in data were acknowledged as part of any report and the needed intermediate hypotheses to connect the segments of the path have been pretty clearly stated.
@Richard
Yes, Sabine and I traded a great many emails. As I just epressed to Victor, the subject of these emails was not whether Z was capable of committing murder-suicide. Our discussions focused on whether his mindset prior to the flight indicated that action was likely. We could find nothing pointing in that direction. It is the primary reason why I have never been a fan of a 180S flight path.
@DennisW: You believe that the captain would not have made the decision for a murder-suicide until extreme demands were not met. That is the distinction you are making that I find bizarre. He is either capable of committing murder-suicide or he is not, independent of whether there were conditional demands.
The actions of the captain were not consistent with a pilot that had made demands. If so, he would have maximized his chances of getting those demands accepted. There was no need to fly back over Malaysia. He could have easily circled over the South China Sea and made his demands publicly known so there would be public awareness and global pressure for Malaysia to accept the demands. Once the demands were met (which would be extremely unlikely), he could have landed in Malaysia, Indonesia, Christmas Island, or elsewhere. If he was intent on pulling the trigger after demands were not met, he could have dramatically crashed the plane to maximize global awareness of whatever political point he was making. There would be no need to turn off the transponder, turn off the SATCOM, disable ACARS, and fly into the SIO.
Instead what we see is an attempt to cloak, avoid interception, and then deceive so that the final destination was unknown. I have to believe that was his intention all along. If not for the SATCOM data, which likely was unknown to him, we would have zero basis for conducting a search.
@Sid
Yes, the “Duncan days” were a very good experience for all of us. Duncan was a very focussed host, and had very strong convictions about what was relevant for the discussions. I recall those days as being characterized by over-constrained solutions (spreadsheets with 0.1Hz BFO residuals). Fun stuff to be sure, and yes, we have evolved substantially to the prevailing attitudes today. Now everything is much more refined – the fuel model, the weather model, the drift model (I don’t think debris had even been recovered during Duncan’s participation), operation of the flight management system,…
@Victor
Yes, ZS was capable, and I believe he did exercise murder-suicide.
The available time in the air was not realistically compatible with marshalling any Malaysian public opinion (take-off at ~1AM 😀).
I believe his attempt to “cloak and deceive” is consistent with a desire to shield his family, friends, and political associates / co-conspirators from embarrassment and retribution after the fact. Likewise, the lack of a written manifesto explaining the reasons his actions.
As I have said before, after the demands were not met he had no choice. Acquiescing to the government at that time would greatly undermine the credibility of any future actions/threats his associates might make.
I am out of gas. I think you now clearly understand my concerns about your flight path both in terms of motive and physics. I see no point in slogging on.
@DennisW: The captain was no fool. Post 9/11, there was nearly ZERO chance any demands would be accommodated (and I’m being generous when I include the word “nearly”). He had to know this. If he made demands and was willing to kill the passengers and crew if those demands were not met, then he also knew that the scenario would most likely end in murder-suicide. He had to also know that once the diversion was known to passengers and crew, there would be extraordinary efforts to enter the cockpit (such as ramming a food trolley into the door), which would make it extremely difficult to succeed.
You are proposing a scenario that I think has serious flaws in the logic. It’s not because I am averse to considering a motive, as you have claimed many times. It’s because there are simply too many holes in what you propose.
Motive
I am unable to conceive how it would serve to find the final resting place of the aircraft. How could knowledge of it possibly lead to the point where the wreckage lies. I believe time and effort spent in searching for motive will be a fruitless diversion from the realities of a physical search. That comes first and should the aircraft be found, it may then become necessary to consider whether another search, this time for motive is to be carried out.
@Victor
Victor is convinced the location is 140nm from the position derived by his and his colleagues work. If this is a radius, the area is 61,500 sqnm. I presume some of that has already been searched. What would the unexplored area be. Has that been calculated. What sort of cost would an underwater search entail. How would it be possible to imbue those who have the capacity to fund such a mission,with equal conviction. To do so, perhaps corroboration is required through another independent party employing another method/approach. Presently notwithstanding that the work is of excellent quality unfortunately it has a draw back. That is Inmarsat`s analysis and the very fact that it failed to yield results.
Victor
Hello again! Thanks for info on EK425. Still looking for ADS-B data of that night. RFQs out to FR24 and Flightaware (FA). Slow process. FR24 does not provide such data older than 3 years. FA still elaborating.
Now I do have a draft of a preliminary working paper on the subject. Just in case you are interested please send me an email. Then I will provide a link to the working paper and the data base. Maybe it will evolve to an additional “radio model” for flight path determination by joint efforts.
Please only for personal use to start with, please give me feedback on my approach and then we will see how to proceed with regard to IG. Thanks!
@Tony: Ocean Infinity has the financial resources and technical capabilities to conduct the search. They also have access to all the sonar data from the GO Phoenix subsea search, as well as their own search using AUVs and an ROV. At this point, whether a new search occurs is dependent on their willingness and perhaps the cooperation of Malaysia. These days, OI is busy on other projects, so the prospect of another search is at least a year away. However, I assure you that OI has not forgotten MH370.
@Rob: Done.
@Victor
You say again you are not averse to considering a motive.
Nevertheless, in all our dialog you have not revealed what you believe the motive for the diversion was. Nor has Richard or any other of your other report collaborators.
Based on your remarks and your proposed scenario, I have to believe that you think Z had a murder-suicide motive from the get-go.
@Tony,
“I presume some of that has already been searched. What would the unexplored area be. Has that been calculated.”
I asked the same question when the search area was first presented and Richard went to some trouble to calcuate the answer. You will find it somewhere in the previous thread. No doubt Richard can point you to the specific exchange if you can’t find it. If memory serves [which it often doesn’t, these days], approximately 75% of the proposed search area has previously been searched. That ~75% includes whatever minor data holidays may exist in the searched portion.
@DennisW: My best estimate for the reason for the diversion is not different from what many others here believe.
The captain was despondent about his personal life and also about Malaysian politics. His call to action, which he realized would also mean his end, was to divert a Malaysian plane and make it disappear, which he hoped would draw attention from the world, bankrupt the airline, and expose the corruption of the Najib administration. After reaching IGARI, every action he took was to prevent interference (incapacitate crew and passengers by depressurization), hide (disable the SATCOM, ACARS, and transponder; turn back at a handover point), avoid interception (transition the Malaysian peninsula at maximum speed, avoid Indonesian airspace), set up a decoy path to the northwest (follow airway N571 before turning south), avoid radar detection (descend north of Sumatra), and crash the plane as far south as possible (set the final waypoint to be the South Pole).
There are two sets of evidence that were left behind accidentally: the satellite data, and the simulator data. Both point to a crash deep in the SIO.
Hi DennisW –
I haven’t paid much attention to this for the last few years or so but you’re always my favorite poster lol. I recall something about your theory that has always bothered me, perhaps you explain it quite simply and I have just forgotten, sorry. I don’t see your explanation though and I don’t want to read through 3 years of missed posts lol. I’m just an interested layperson and have no expertise in this area.
While Z is meandering around waiting for this negotiation to complete, how did he prevent the passengers and crew from attempting any form of communication with folks on the ground?
And on the flip side, if I were on the ground as part of the negotiating crew, one of the first things I’d want to know is what is going on inside the plane. So wouldn’t the good guys on the ground try to communicate with the crew?
And lastly, if they have so much time screwing around with this negotiation, why wouldn’t they have sent other planes up there to follow Z around?
thanks!
@Victor
Fair enough, and I thank you for that.
My only disagreement is your assertion that the satellite data supports a crash deep in the SIO. I don’t believe the satellite data can be used to support a crash any location. It is only able to support a path South after the FMT, and a rapid descent at the end of fuel.
The Cocos path I favor was created by you.
I will go on record as saying that I calculate your recent proposed termination LEP has about a 20% probabiltiy of being correct. Most of it has been searched previously. The remaining 80% probability is along the 7th arc from 25S to 20S.
@Rob,
I’d like to review your draft on the “radio model”.
I can be reached by private message via the contact form on my website:
https://370Location.org
Thanks — Ed Anderson (KE6IZN)
@Rob
You might try FlightStats, they provide introductory free trial access via an API for historical searches. While their API access method is designed to be used by a coded interface, it may be “hand cranked”.
@DennisW said: I will go on record as saying that I calculate your recent proposed termination LEP has about a 20% probabiltiy of being correct.
I put it at 50%, only because we don’t know what we don’t know. My co-authors believe the probability to be much higher. I think it is still the best and most cost effective place to look, by far.
@DennisW
I sympathize with your feeling that a full-out flight analysis considering possible criminal motives, like NTSB/FBI might have done if they were allowed to continue helping Malaysia (which they were not), might have come to a more definitive search, or lack thereof if they thought it was hopeless due to the vastness of the SIO.
However, that’s a double-edged sword. We as independent investigators would not exist if FBI was taking charge of the data. We would be sitting on the sidelines waiting to hear the FBI report.
@TBill
Not sure I would categorize us as investigators. I think a better decription is forensic scientists. We are men of the “laboratory”, and can only analyze evidence that crime scene investigators bring to us. That sucks. I am much more attuned to making and collecting observations on my own. It is like listening to Ami tell me about a car problem instead of examining and driving the vehicle myself. I find it very frustrating.
@DennisW: We are primarily analysts, as you say. But we (the IG and the contributors to the blog) have also been instrumental for getting much of the data into the public domain. Examples off the top of my head are: the civilian primary radar data, ATC ADS-B data, Inmarsat satellite logs, ACARS logs, Boeing simulator studies, details about the flight files found on the captain’s home simulator, Singapore radar source near the Malacca Strait, details about the BTO and BFO.
I think we can agree that Blaine Gibson is a bona fide on-the-ground investigator. We stay in contact with Blaine and share information.
@Victor
I agree.
Just providing this forum and the inputs of the contributors has been overwhelmingly positive.
Please find below (hopefully a link) to my analysis of the Flaperon hinge for your consideration, comments and critical feedback.
https://www.dropbox.com/s/exvcdgylqmtx7xl/MH370%20Flaperon%20Feasibility%20FEA%20Analysis%20%28Rev%201.2%29.pdf?dl=0
Congratulations on all the new insight provided on Victor’s blog this year. Thank you for the hard work and for sharing the amazing work, analysis and creativity. Hopefully all the pieces can come together and help lead to finding MH370 and provide closure for the families.
Tom
@Kenyon
Excellent report Tom!
Many thanks for the insights into the Flaperon and the alignment of the hinge failure with torsional flutter.
The absence of the expected surface impact damage due to a hypothetical ditching, shows beyond all reasonable doubt that the Flaperon separated from the aircraft following hinge failure due to flutter prior to impact.
Your findings firmly contradict the DGA hypothesis, that “it appears that the flaperon impacted the water while still attached to the aeroplane and that at the time of the impact it was deflected.”
@Kenyon,
Thank you for that, an excellent piece of work. I’m aware that you have persisted with this analysis over a long period.
Would a third case for an FEA analysis be feasible? That is, for an extreme lateral (shock?) load on the hinge?
@Richard,
While I agree that your last paragraph, above is sound, I would caution making the exclusive conclusion “that the Flaperon separated from the aircraft following hinge failure due to flutter prior to impact“.
@Kenyon
Tom, thank you for the very detailed paper.
You would doubtless have a good understanding of the limitations of your approach. What level of certainty would you be happy to assign to the conclusions that separation was:
a. due to flutter, and
b. occurred prior to impact.
Separately, do you have a view as to how many cycles of flutter would be required to cause the observed failure?
One way or another, your conclusion appears to have some serious implications for how far from the 7th arc the wreckage should be. It would appear to be difficult to reconcile the sort of failure you envisage with an extended glide post fuel exhaustion.
@Don Thompson
A third FEA case (say Case 3) feasibility run is indeed possible. Some initial thoughts:
– Generally I suspect it would look somewhat similar in the hinge breakpoint as compared to the torsional flutter Case 1. However, the fore and aft flanges would show compression on one side and tension on the other vs a more balanced fatigue shown with Case 1. Alternately if a massive wave of lateral force was applied to the hinges and an instant after-shock in the opposing direction then the damage would look similar to Case 1. (Basically a two cycle strike with a major initial and minor final blow.)
– The poor “resolution” of being limited to observation of publicly available photos and salt water erosion-corrosion come into play. The modeling and FEA produce details that are not discernible in the photographic information we have at hand.
– On a positive note we can observe the damage to the soft-body structure of the recovered right Flaperon. A primary attachment failure scenario needs to align with the soft-body damage observed. The observed trailing edge damage would be consistent with a torsional flutter scenario. I’m not convinced the upward rotation of the Flaperon could be produced during an extended glide landing, however given so many variables (plane AOA position, waves etc.) I simply assumed it is possible for the sake performing the comparison FEA.
– Note: the pin-pivot would also differ in Case 3 but that part was not recovered from wreckage.
@All As a side note @David has previously published his thoughts on the potential scenario that one Flaperon PCU actuator would be hydraulically locked and the other in free bypass. I feel this scenario would act to exacerbate torsional flutter conditions. A key concept to also keep in mind.
@ Mick Gilbert
The FEA studies produced tons of data, however the gist of the report would have been lost if it was loaded with technical information.
Cycle counts are available for the Torsional Flutter FEA runs, however the existing model is not refined enough to explore the balances between cycles counts, forces applied, forward & aft vectors of the torsion scenario. Without further refinement of the FEA setup (and frankly without design documents from Boeing) the cycle counts obtained with this initial study are of no engineering value.
Understandably so there may not have been compelling reasons for Boeing to run Flaperon torsional flutter analysis for the conditions experienced by MH370. It was certainly run for the standard test envelopes yielding MCBF results. For the B777 for they likely determined MCBF while in takeoff (bypass mode & other modes) with engine at full throttle.
At this point I’m trying to stick to available facts and analysis and avoid assigning levels of certainty. One angle I’ve tried to maintain is to try and rule out torsional flutter and I’m unable to do so at this time. On the contrary I would need to see and understand a plausible scenario of how the Flaperon is separated from main wing upon impact with water where the primary attachment failure and soft body damage align with the photographs.
Regarding serious implications to how far from 7th arc, I’m not in a position to understand how my Flaperon failure analyses fits into the broader effort to determine location of the wreckage. Perhaps this team on Victor’s blog can use it? In fact I’ve often wondered if all my work was in the end will be fruitless. But we all try and share our ideas and eventually the picture starts to collectively form of what did indeed happen to MH370.
@Tom Kenyon: I agree with the previous comments. You’ve done excellent work, which is of course limited by the data that is available.
Your work places additional doubt on a glide after fuel exhaustion leading to a controlled ditching. It supports focusing a future search to areas relative close to the 7th arc. Of course, it’s also possible there was a glide before a steep descent, but that would mean the sequence was a dive-glide-dive, which becomes rather contrived.
Thank you again for your technical contribution and your perseverance. I know you have been busy.
@Kenyon
Tom, your work is certainly not fruitless. I appreciate your cautious and scientific approach.
However, despite the nay sayers, who are in abundance, I believe you have proven beyond all reasonable doubt that the Flaperon separated from the aircraft following hinge failure due to flutter prior to impact.
I understand that Don cautions against exclusive conclusions, but I feel there is no other viable conclusion.
I understand that Mick wants you to put figures on the level of certainty, but I feel he is asking the impossible.
I hope that both Don and Mick have not lost their sense of reality.
I hope that both Don and Mick can agree, when the odds are stacked against them.
@Richard,
For the avoidance of doubt, I am in full control of my senses while remaining cautiously aware that there are aspects of this event that are not yet known while there are other conditions that remain feasible but yet unexplored.
Accordingly, my sense of reality involves a quite different view of the ‘odds’ than yours.
@Kenyon
Excellent work and possibly best clue towards the final moments of flight.
The probability of torsional flutter failure and separation in flight or as a result of impact with the surface is rather low. However should it be more likely that torsional forces have brought about the separation of the flaperon from, then I would suggest as follows.
The only circumstance which I am able to conceive is that the flaperon remained attached to a portion of the wing which separated and remained afloat or in shallow submergence. Hydro- dynamics acting on the structure for a period of +3 years eventually caused the separation of the flaperon which may have offered sufficient buoyancy to the whole structure. Following separation the remaining wing portion sunk whilst the flaperon remaining afloat continued in its journey. I wonder whether it would be possible to estimate the cyclical count involved in wave action over the period of time. In terms of fatigue failure, I would suggest that salt water immersion over such a prolonged period of time would have a significant impact.
@Kenyon,
Great work Tom. It has always seemed inconceivable to me how the flaperon damage [particularly the TE separation] could have been caused by impact with the water. The massive engine dangling immediately in front of the flaperon cannot be ignored.
It seems eons ago that I proposed that the TE separation of the flaperon was very indicative of a flutter induced failure, most likely occurring during the accelerating spiral dive following the right engine failure. I think Mike also arrived at a similar conclusion at the same time.
The potential for [aeroelastic] flutter to occur is, of course, a function of speed, but it is also more likely to occur if, for example, hinge mechanisms and pivot points are worn, as might be the case in older aircraft, or the flaperon is in free bypass as proposed by David. The onset of flutter is very rapid with oscillations easily reaching 10 Hz or greater within a couple of seconds.
@Don T
Just to be clear my probability estimate of terminal location of 20% in the 7th arc 32S-36S and 80% elsewhere on the arc converts as follows.
Moneyline odds
32S-36S (+400) elsewhere (-400)
UK odds (fractional standard)
32S-36S (4/1) elsewhere (1/4)
Being an avid online bettor (mostly prop bets) my preference is the moneyline (Vegas) description.
@Richard
Re: I hope that both Don and Mick can agree, when the odds are stacked against them.
I have no idea what you are getting at, Richard. You seem to automatically conflate inquisitiveness with disagreement. In this case you’d be absolutely wrong to do so.
I’ve long argued in a variety of forums that the French hypothesis of a ditching separating the flaperon was likely flawed. Thus I welcome Tom’s work.
What I have a problem with is applying levels of certainty to conclusions that exceed what the methodologies can reasonably produce. I don’t think that’s unreasonable.
What I was trying to ascertain from Tom was whether he shared your all-in confidence regarding the conclusion.
Separately, you might give some thought to what proof beyond reasonable doubt of flutter causing the flaperon to separate in flight does to your and your co-authors’ latest search recommendations. Long story short, if flutter separated that flaperon then the aircraft wreckage must be relatively close to the 7th arc, ie the probability of the wreckage being found in the A2 and A3 search areas falls to near zero. That essentially means that if your LEP is correct then the wreckage must have been missed first time around (probability X) or you’re wrong (probability 1-X).
@Kenyon
Thank you for those clarifications and expansions, Tom.
I can only echo what others have said about the value of your work. Terminal dive v Glide has always been a (if not, the) factor in setting the search area boundaries. Having a higher level of confidence in a flutter inducing dive carves an enormous swathe off of the potential search area. That is a very valuable and practical contribution.
@Kenyon
I echo Mick’s comment. Nice work.
@ Victor and all contributors – Wishing you a wonderful Thanksgiving for those of you in the U.S. Being an avid reader of this blog, it is important to thank you for all the efforts and the detailed scientific analysis that is shared here in the quest to find MH370. While we all hope the day is not too far away when the mystery is solved, for sure the analysis from such a diverse and qualified set of folks no doubt will be looked upon to assist future such searches though the circumstances might be different.
Honestly, reading this blog we can only wish such collaboration comes together in solving the current pandemic situation.
@Mick G
That essentially means that if your LEP is correct then the wreckage must have been missed first time around (probability X) or you’re wrong (probability 1-X).
Yes, it is hard to understand Richard’s assurance that 34.2S +/- 140 nm is sure to contain the wreckage or Victor’s 50% probability estimate. I think my 20% estimate that the wreckage was missed is generously positive.
@Kenyon. Thank you Tom and the others for the effort end expertise you have put into your analysis.
As you say, “…however the gist of the report would have been lost if it was loaded with technical information.”
Nevertheless, I think the implied very high confidence attributed above to the torsional flutter explanation does depend on some of that, the underlying assumptions in particular.
So now, while risking the overloading you avoided, necessarily I raise some queries and comments below:
• Have you been able to show that flaperon torsional loading of this extent can be generated from its response to aerodynamic excitation, or is that an assumption? The low down hinges in particular tend to separate this instance from precedents.
• Can you show that the frequency of the overall flexing would match the inertial characteristics of the flaperon and its supporting structure? A stable flexing would be needed of enough amplitude to exceed the minimum stress that can induce fatigue and for sufficient cycles ie not damped to a lesser magnitude or too rapidly divergent (where there might be no weakening before overstress).
• The natural frequency of the flexing mass is dependent on its moment of inertia, on elasticity and on aerodynamic force direction and size. Separation of the trailing edge obviously would have a marked effect on both amplitude and frequency. Other influences would include airspeed changes and density. Some might take the remainder outside the flutter stimulation conditions, requiring a change of conditions to restore them.
For example I assessed earlier that loss of the trailing edge at speed would result in changed aerodynamic vector direction and position, those then deploying the flaperon remainder. That would separate immediately, in overstress.
Based on this analysis and that it didn’t happen (being inconsistent with the damage to the adjacent outer flap), the trailing edge did not separate in flight.
In your Case 1, if it didn’t then, when did it?
• Related, because the actuators can exert more force while resisting compression than extension, were there numerically equal (for example) cyclic forces of opposite sign, there could be actuator runaway extension as above, leading to departure of the whole in overstress.
In short the comparative weakness of the actuators to extension should not be overlooked when the forces in the hinge are considered.
• Also, about elasticity, that and hence ‘natural’ frequency could change also as there was damage to the flaperon structure aside from trailing edge loss, such as the multiple cracking evident to the leading edge, apparently torsional, that altering torsional stiffness.
• Another also, the spring of the two actuators would affect the flexing frequency, again these being firmer in compression than in extension and both of course being dependent on whether they are responding to input, hydraulically ‘locked’ when not, or in by-pass, the last offering minimal resistance. That in turn depends on electrical power for their control (generated, including by APU; and battery) and hydraulic power (engine windmilling, RAT, APU) at the two PCUs and their actuators.
You alluded to this; “As a side note @David has previously published his thoughts on the potential scenario that one Flaperon PCU actuator would be hydraulically locked and the other in free bypass. I feel this scenario would act to exacerbate torsional flutter conditions. A key concept to also keep in mind.” With the RAT operating, before the APU comes on line (at about 1 min 10 secs after fuel exhaustion), it is the inboard actuator that could be in by-pass, offering no resistance to torque loading, the whole actuator loading then being taken by the outboard. Thus much of the inboard hinge load will be taken by the outboard, so that will be the more heavily loaded. Thus it could fail first, though that would be contrary to your sequence.
(The actuators have relief valves, though of unknown capacity, but these should not affect that issue.)
In my discussion* of the DGA hypothesis I included a vector diagram of the combination of forces on the hinge pivot point while depicting the torque couple between that and the actuator.
• Unloading of the flaperon on take-off is intended to reduce the effect otherwise on the actuators’ fatigue life. That might well suggest that fatigue will affect these first in other potentially-flutter circumstances.
Even if they didn’t and the hinges both failed the ensuing failure of the actuators would need separate explanation, since possibly the flaperon could trail otherwise.
• There might remain other failure modes that yield similar hinge fractures? The evidence of damage to the flaperon’s inboard and outboard ends and the upward crushing of it at its outboard nose need explanation.
I did demonstrate (to my own satisfaction anyway) that the French hypothesis (the DGA emphasised it was that) was flawed though for different reasons to those you have put. At that time the right outer flap part had not been recovered, that disclosing an apparent impact with the flaperon. I do think that since then any flaperon failure theory needs to discuss that aspect, and to deal with the various other damage that the French measured and recorded, thoroughly.
• Also, they had the inboard hinge and trailing edge failing simultaneously: unlikely I think. Failure of the trailing edge first in their case and in your Case 2 would relieve the hinge stress. The flaperon rump might then separate as its remainder became immersed and dragged.
The like would alter the outcome of your Case 2 with its premise that the trailing edge did not separate.
(* The hypothesis I put was that there was end loading from the adjacent outer flap, that theory aiming to embrace the damage evident to both, including flaperon trailing edge separation.)
@DennisW
I have the advantage of having completed, together with Bobby and Victor, a detailed drift analysis over the last 9 months, which independently shows remarkable agreement to 34.2°S ± 140 nm as stated in the paper published above. This new analysis excludes your Cocos Island hypothesis. Instead of continually telling me, I am wrong, why don’t you do your own analysis?
@Kenyon
My apologies Tom! I appear to have over-rated your excellent work.
Everyone agrees your work is excellent, but disagree what your excellent work shows.
You state that you are unable to rule out the scenario, where the Flaperon is separated from the aircraft before impact. I agree with your finding. Some analysts here obviously disagree.
You state that you have yet to see the evidence to rule in the scenario, where the Flaperon is attached to the aircraft at impact. I agree with your finding. Some analysts here disagree.
The scenario that the Flaperon partially separated before impact and completely separated on impact, still does not appear to match your second statement, that you have yet to see the evidence to rule in the scenario, where the Flaperon is attached to the aircraft at impact.
At least most analysts agree that your findings firmly contradict the DGA hypothesis, that “it appears that the flaperon impacted the water while still attached to the aeroplane and that at the time of the impact it was deflected.”
@Richard
I have the advantage of having completed, together with Bobby and Victor, a detailed drift analysis over the last 9 months, which independently shows remarkable agreement to 34.2°S ± 140 nm as stated in the paper published above. This new analysis excludes your Cocos Island hypothesis. Instead of continually telling me, I am wrong, why don’t you do your own analysis?
I suspended my analytical efforts some time ago. The spreadsheet days are over. OI will simply do the “sensible” thing and continue to search North from where they left off.
@Kenyon: It would be helpful to compare your work with the analysis of CAPTIO, and why you believe the results are so different.
@DennisW
If you suspended you analytical efforts some time ago, on what basis are you continually telling me, that I am wrong?
The odds offered by your favourite bookmaker?
@Mick said: That essentially means that if your LEP is correct then the wreckage must have been missed first time around (probability X) or you’re wrong (probability 1-X).
Even within A1, there are areas that were not scanned, or were scanned and produced low quality data, due to the challenging terrain (slopes greater than 30%). I wouldn’t call that a “miss”.
For reference, see Section 3, “Terrain near the LEP”, from the last post.
@Victor
I must confess I’ve been largely pre-occupied with other activities since 2018 timeframe. To my surprise the first thing I notice is CAPTIO’s uncredited use of my graphic work I performed for my original analysis. (My work contains full traceable credits to all sources used.)
I’ll give it a read, but a red flag popped up on the initial glance. Usually an uncredited compilation of other people’s work leads to a person or group attempting to monetize in short order. Is there a money trail identified for CAPTIO?
@Richard
I never said you were wrong. We simply have differing opinions about how a continued search should be prioritized.
@Kenyon: We have a CAPTIO member that contributes here. I have no reason to doubt their integrity, notwithstanding an uncredited graphic. We’d be interested to understand why the conclusions are so different.
@Kenyon et al.
For us non-aerodynamic types, can you outline the flight regime under which the structural analysis could be valid. e.g. speed, altitude, attitude.
Also, is there a scenario where the fatigue merely weakens the structure so that it eventually fails.
@DennisW, further north than than the already-searched 7th arc is a fool’s errand. 40S is where she lies.
@Paul
😀 You are the primary reason for my 80% probability area categorization change from 25S-20S to “elsewhere”. I realized I was being insensitive.
I do have a couple of “fool’s errands” in my errand history.
@paul smithson
While I agree that your route seems plausible with from the satellite data analysis, I feel that there are two weak points:
1. The fuel analysis is incomplete. It needs to follow your path/speed profile for the full period.
2. The various BFO/BTO data immediately after 18:25 are not explained.
The rationale for the specific azimuth is somewhat contrived (as is the early path in URIB :-))
That having been said, I give it more credence than the northern routes. Those require a very purposeful pilot with speculative motives.
@DennisW
Your dismissal of the southerly routes needs a restatement of the evidence for the northern routes in order for me to follow it.
In the discussions on Westerly v Southerly routes I would draw particular attention to the seven items of debris found. Here is the chronology and locations of the finds.
29/07/15 Reunion
27/12/15 Xai Xai
28/2/16 Vilankula
21/3/16 Mossel Bay
30/3/16 Rodrigues
23/6/16 Pemba
9/16 St Luc (unconfirmed )
All the locations are far distant from the seventh arc positions and rely entirely on accuracy drift estimates.
The chronology is more interesting. Excluding the unconfirmed find all others were discovered within eleven months of the first. Factoring a time estimate for the finds, it is highly likely the arrival of the debris at these locations was earlier than their discovery. From which would follow that the possibility of their arrival in closer proximity exists.
An observation I make on this is the period between the date of the loss of the aircraft on 8 March 2014 and the first find on 29/07/2015. Some seventeen months. I remain skeptical that this debris could have been carried that distance between the positions put forward and their point of discovery.
@Sid
I did not mean to create the impression I am dismissing any routes. Even routes ending in an area previously searched.
Simply expressing a preference for certain routes.
@Victor, Thank you for the opportunity to review a related paper.
(With a reasonable dose of Tryptophan) I read the CAPTIO report “The end of flight MH370: a ditching study of the flaperon hitting the surface of the sea” dated 13th March 2020. Hopefully that was the report you had in mind.
The CAPTIO report focuses on analyzing the soft-body super structure of the Flaperon with respect to a ditching at sea scenario. My November 25, 2020 report focuses on two failure scenarios for of the primary attachment, the alloy hinge system. Therefore a point by point comparison is not afforded.
However, the report shows two (2) very nice 3D graphic representations of their proposed ditch configuration on page 6 and page 10. The 3D model snapshots show the Flaperon dragging (or impact) in water. However, to complete the understanding of their analysis we need to understand:
1.0 The flight control status of the Flaperon that maintains the -30 degree position shown in the graphic representations.
2.0 An overall (non-detailed outline sketch) graphic representation of the entire aircraft with respect to the angle of the Flaperon shown in the graphic representations. In other words, maintain the position of the Flaperon shown in the 3D graphic snapshots and superimpose an outline of the full (scaled) aircraft. I presume the base conditions for their scenario is normal horizontal landing configuration, normal landing speed range, right engine already detached from impact with water (with no significant damage to Flaperon), and to have both wings, and tail section, above the water.
Without the above information I cannot determine the basic feasibility of the study. However, it appears that the study implies an upward force on the trailing edge of the Flaperon eventually caused the primary attachments to fail. If so, that’s where my hinge FEA analysis would disagree, since the upward trailing edge force scenario produces results different from the available hinge photographs.
The study’s section of the Flaperon free falling is interesting but seemingly oversimplified to produce a result supporting the (Flaperon based) ditch theory. I suspect if the same exact methodology was applied to some of the B777 MH-17 debris falling from 35,000 ft (10 km) to solid ground the simplified model results would differ from reality.
https://www.dropbox.com/s/q4fkiedouwelzjg/MH17%20Wreckage%20Examples.pdf?dl=0
I don’t know of data available that can show when, where, or at what elevation above sea level the Flaperon separated from the main wing. My recent study looked at two popular scenarios, one with cyclic fatigue the other a single upward force. There are indeed other possible scenarios, in fact endless. I vaguely recall (due to passage of time) the French seemed to imply that the Flaperon was pulled off its primary attachments as if there were magical water friction hooks that could impart a great aftward force sufficient to remove the Flaperon from it’s attachments. If that was the basic premise, I wouldn’t bother to set up a FEA run to see the impact on the alloy hinge. However, if someone has a viable scenario to noodle, please feel free to put forth, I’ll do what I can to throw my two cents in.
P.S. Your feedback on CAPTIO integrity is fully accepted based on my respect for your impeccable credibility. FWIW I was mistaken, my work was credited. However incorrectly credited as (highlighted by CAPTIO). Additional works published appear to be used in CAPTIO presentations and videos found on the web. I guess I would request that if our work is used by CAPTIO the source should be stated, certainly not presented to the public as original work by CAPTIO, that is very misleading.
@David thank you for your responses.
“Have you been able to show that flaperon torsional loading of this extent can be generated from its response to aerodynamic excitation, or is that an assumption?”
– I’m using an assumption that aerodynamic conditions existed (prior to Flaperon separation from main wing) to generate harmonic responses sufficient to create cyclic lateral reversing loads on both hinge systems. This cyclical loading lead to fatigue of the alloy sub-assembly creating a point of failure on both hinges. (BTW it is of significance that both inboard and outboard Flaperon hinge systems exhibit the same type of fatigue failure evidence.)
“Can you show that the frequency of the overall flexing would match the inertial characteristics of the flaperon and its supporting structure?”
– No, frequency did not play a role in the FEA studies. I don’t think anyone outside of Boeing’s engineering department could perform such analysis with any level of confidence.
“In your Case 1, if it didn’t then, when did it?”
– I don’t fully understand this section of your post. However, my analysis does not delve into determining the possibility, nor the nature, of flutter conditions of the B777 Flaperon. I have a general assumption that Flaperon flutter does not occur during the entire safe flight envelop of the B777. However I do assume it is possible to experience flutter conditions when flown above and outside the safe flight envelope (plus an unpublished contingency known by Boeing). If someone can prove there are no conditions where the B777 Flaperon will experience flutter or generate cyclic lateral reversing loads on the alloy hinges then I can put my pencils down. Keep in mind that at first glance the Flaperon looks like a relatively simple control surface. However, I’ve spent years reverse engineering this sub-component of the wing system and have gained a tremendous amount of respect for Boeing Aerospace Engineers. This is a VERY complicated, non-symmetrical, critical device with very specific and challenging flight requirements. Being asymmetric and located on the trailing edge of the main wing and aft of the powerful engine it’s clear that flutter dynamics and dampening are most challenging. My gut feel is that the trailing edge of the Flaperon deteriorated during a flutter event and potentially exacerbated the flutter issue.
“With the RAT operating, before the APU comes on line (at about 1 min 10 secs after fuel exhaustion), it is the inboard actuator that could be in by-pass, offering no resistance to torque loading, the whole actuator loading then being taken by the outboard. Thus much of the inboard hinge load will be taken by the outboard, so that will be the more heavily loaded.”
– Your uncovering of this scenario years ago is an important concept to consider for entering a cyclical torsional loading condition. Furthermore, if this unbalanced actuator loading condition is (for example) a required event to begin (or exacerbate) flutter then it has the potential to assign values to “when” it likely started in earnest.
@Tom Kenyon,
More interesting comments Tom. Thanks.
>> “My recent study looked at two popular scenarios, one with cyclic fatigue the other a single upward force.”
It is the cyclic fatigue failure which appeals to me. I think I understand some of the practical aspects of the type of construction used in the flaperon, having built and flown a glass fibre aeroplane with control surfaces constructed in a similar fashion to the TE portion of the flaperon. The TE portion which separated has no internal structure dissipating loads. Cyclical loads would be carried only by the top and bottom skins which themselves are fastened to the rear spar, and along that line, exactly where the TE separated, the bending moment will be at a maximum for cyclical loads.
>> “Can you show that the frequency of the overall flexing would match the inertial characteristics of the flaperon and its supporting structure?”
>> – No, frequency did not play a role in the FEA studies. I don’t think anyone outside of Boeing’s engineering department could perform such analysis with any level of confidence.”
In fact Boeing may already have such data. Boeing identifies in one of its manuals the potential, or possibility, of flaperon flutter during a static engine run-up. [It would take me a week to find the reference again.] Knowing that, Boeing may have some idea of the oscillation frequency, but in some abnormal event as we are examining here, the frequency and the amplitude of the oscillations could well be much greater. The onset could be very rapid with destruction of the TE occurring within seconds.
An interesting question is . . would the remaining part of the flaperon still be subject to flutter if the TE separated first. Or, perhaps, as the TE separated the cyclic loads on the hinge systems [with some torsional loading] caused the failure there also, within milliseconds.
@Brian Anderson
RE: “Boeing identifies in one of its manuals the potential, or possibility, of flaperon flutter during a static engine run-up. [It would take me a week to find the reference again.]”
It’s in the 777 Training Manual (27-11-00 p.128) as a Training Information Point:
“During an engine test run on the ground with thrust near takeoff level, the flaperon behind the engine can possibly flutter. This is a usual condition.”
Both flaperon PCUs are in bypass mode when the aircraft is on the ground with the airspeed less than 85 knots and at least one engine running near take-off thrust.
@Sid Bennett
“…can you outline the flight regime under which the structural analysis could be valid. e.g. speed, altitude, attitude.”
– For Case 1 analysis I consider the applicable flight regime is above and beyond the safe flight envelope for the B777-200 (for Mach and Pressure Altitude), plus (say 12%) contingency margin for Mach at a given safe Pressure Altitude. Being in this abnormal flight zone introduces the chance of flutter scenarios. Keep in mind that as the aircraft descends onto the denser atmosphere the allowable safe Mach decreases. A high speed spiral decent puts ever increasing extreme loads on the aircraft. Secondarily temperature of the alloy plays a role in rate of fatigue (colder is more brittle) but this itself is not a key concern.
– For Case 2 virtually valid for any conditions that can impart enough upwards force on the bottom of the Flaperon sufficient to separate from aircraft. As a comparison against MH370 right Flaperon damage, I urge readers to closely study Asiana Airlines’ Flight 214 left Flaperon to understand an example of what damage (primary attachments and soft-body) occurs to a B777 when impacted with a runway.
http://assets.bwbx.io/images/iOspym.iRiGc/v1/-1x-1.jpg
(Photographer Justin Sullivan)
“is there a scenario where the fatigue merely weakens the structure so that it eventually fails”
– Cycling sufficient loads generates fatigue (yielding) in the structure/material by developing micro-cracks. If sufficient loads continue to be imparted on the structure/material the micro-crack (propagation) expands. At some point a load imparted on the remaining (residual) uncracked material causes a catastrophic failure. Think of bending a paper-clip back and forth until it breaks. Say it takes an average of 10 fully-reversed cycles to fail. If you bent it 9 times and left it on the coffee table, you would expect it to fail in a few bends at some point in the future.
@Kenyon. My thanks for your answers.
Noting the Asiana Flight 214 photo and the CAPTIO nose-down flaperon descent assessment do you have an opinion on how the trailing edge separated, both cases?
@Sid
The route I proposed is based on M0.84 FL340. There are other reasons to support the FL340 suppositiong. The last speed seen on Butterworth radar fits M0.84 FL340 inclusive of wind. The speed across the peninsular fits Mmo M0.87 at FL340 inclusive wind.
I agree that there is a fuel problem with the route, to the tune of about 6%.Depending on how much the headwinds reduce at higher altitude, it may be possible to cover most of this with a step climb around 2200.Some of the saving could also be explained by an idle descent near the end – which gives you another 20 mins of powered flying time.
There’s nothing wrong at all with the BTO on this route. The BFO is definitely “trended”, but that might be due to bias drift.
The route was not derived to fit a waypoint path, but to find the predicted intersection of the pre turn BTO trend (modeled) with the post BTO trend (hindcast). As well as finding a route with magnificent BTO fit, the M number is smack-dab on a round number, (2-decimals) which also happens to be nominal cruise.
Without any fiddling or manipulation, the predicted azimuth is a perfect match for IGEBO-RUNUT. The former might make sense as a “clearing waypoint” to ensure that Sumatra landmass is not crossed. The latter is the most “obvious” SIO waypoint on the charts, being a crossing of southerly air routes.
The end point (7th arc) lies just beyond the searched area.
Apart from the fuel problem, what’s not to like??
@Kenyon
Many thanks for the further explanations.
The CAPTIO scenario is based on a forced ditching following fuel exhaustion and as you point out is designed to align with the “French” DGA report.
Neither the DGA, nor CAPTIO, discuss the consequences of fuel exhaustion, that both engines failed, APU failed and Ram Air Turbine (RAT) was deployed. As David has pointed out, the Flaperon inboard actuator would be in bypass and no longer offer a rigid resistance on impact.
CAPTIO considers a ditching on water at 133 knots and descending at 500 fpm with full Flaps 30.
There are two significant problems with the CAPTIO scenario:
1. Standard B777 ditching on water procedure calls for the avoidance of full Flaps 30 and recommends an intermediate Flap setting.
2. The ATSB Outboard Flap debris reports shows that the Flaps were not extended. The damage on the Outboard Flap as well as the contact damage between the Outboard Flap and the Flaperon show that both the Flaps and Flaperon were aligned with each other and both were not extended.
Analysts that favour a ditching on water, disregard not only your analysis (although they are willing to copy some of it), but the ATSB analysis of the Outboard Flap and the Boeing 777 operating procedure for ditching on water.
@Paul Smithson
You ask: “ Apart from the fuel problem, what’s not to like??”
The drift analysis excludes 40S.
I just want to point out that the Boeing engineer who inspected the flaperon in France, came onto Victor’s site early 2020 to say he felt it was water impact. I know there was probably some attempt to contact him later, but I did not hear if he was open on the air flutter scenario.
@ Richard. “The drift analysis excludes 40S.” Well, that’s your secret, isn’t it, since you have not published the results.
@Paul
Figure 32 from the UGIB March 7, 2020 report.
https://photos.app.goo.gl/eVewNZ2wNXhSBihBA
@DennisW. Reminder: there was a discussion about this and it transpired that the drop-off in the graph represented the cut-off of the data range used, not the end of the probability distribution. Subsequently, DrB et al have been working on a dataset that includes the 40S zone and beyond – with results eagerly awaited but yet to be published. We are told that the new analysis pinpoints, with uncanny accuracy and confidence…..a particular favoured spot.
@TBill
Several of us had a long call with the Boeing engineer, which Victor kindly arranged.
Although officially sent to DGA in France by Boeing, his observations were not included in the DGA report. He also spent a week on the Asiana crash at SFO.
His initial conclusions were driven by the lack of leading edge damage to the Flaperon. He had not previously considered a mid-air separation of the Flaperon, nor the entire wing, but cannot rule out either possibility. He was impressed with Tom’s FEA analysis and especially the extremely good fit of the hinge lateral damage to the actual hinge damage, implying flutter.
Just now catching up on renewed discussion about the Flaperon. Tom’s analysis is the best I have seen. Excellent work. The French analysis is weak and… frankly, wrong wrt the cause of separation. CFAPTIO is also lacking in consideration of the context. The Vance “analysis” is hardly an analysis at all. Nothing but a knee jerk response before knowing any of the contextual information. Pure, bone headed garbage.
Sometimes first impressions that have a long life are worth reviewing. In the present context, it’s worth looking at what I wrote the day after the Flaperon was reported found.
https://bit.ly/3le0sbB
ALSM. That commentary has stood the test of time commendably.
@Kenyon
@David
In the scenario where one actuator is (relatively firmly) holding one end of the flaperon and the other actuator is offering minimal (if any) resistance, and the flaperon is cyclically flexing:
When the relatively flexible trailing edge begins to tear off would there be increased aerodynamic loading sufficient to produce almost immediate failure loads upon the fatiguing hinges ?
@ Not for the mathematically challenged.
I am sometimes amazed at what tit bits Mr Google throws your way when you are looking for something else. This came up in a search less than an hour ago, so I downloaded it, and have done a quick skim read.
I have not seen this 285 page THESIS referenced by any one before.
I think some of you may be very interested.
https://search.proquest.com/openview/e26beedf3db92e2446bb543bf2c5d460/1.pdf?pq-origsite=gscholar&cbl=18750&diss=y
I met Peter Large in Boulder, October 2019 to discuss his Thesis and basic hypothesis. We corresponded extensively for over a month about his MH370 AirLink antenna idea. It was simply wrong. Now he agrees it was based on a false assumption.
I contacted my friends at Ball that worked on the AirLink Antenna. They confirmed the antenna conforms to the 741 spec. It does in fact continuously adjust the inbound uplink EIRP as need to close the link with the minimum transponder load necessary for a good (low) BER. Thus, his theory was based on an assumption that was false (constant eirp).
Peter pointed out that the Thesis never claimed that the key assumption was correct. He never investigated to see if it was correct before writing the Thesis. He admits it was a purely academic exercise.
BTW…Dennis introduced Peter and I. Thanks Dennis.
I should add to make clear…unlike so many ideas that turn out to be nonsense, Peter’s idea was not nonsense. He’s a smart guy that just made an academic assumption that was false, and never followed up to see if it was true or not.
@Ventus
Peter is a very good friend of mine, I worked with him for many years (same industrial campus different projects). Peter was focussed more on the business side, and I was a technologist. I actually introduced Peter and Mike.
Peter’s wife has an interesting theory that when the CERN people produced the Higg’s Boson it spun our planet in a bizarre and whacky alternative universe.
@Mike
@Dennis
OK, thanks, I will not continue reading it,
@All
On the subject of Indonesian ATC facilities, radars etc (that I was lookinhg for), found this THESIS.
http://kau.diva-portal.org/smash/get/diva2:656944/FULLTEXT01.pdf
More Radar
22 pages
ICAO 4A-4-1 TABLE CNS 4A SURVEILLANCE SYSTEMS
https://www.icao.int/APAC/Documents/edocs/fasid/cns4a.pdf
@George G
Loss of trailing edge increases the natural frequency of the resulting Flaperon (loss of mass and stiffness). The frequency modes would change as well. However, more importantly would be a dynamically changing environment as with a spiral dive scenario and it’s ever increasing destructive forces acting on the aircraft.
Boeing would perform modal analysis on the Flaperon which generates natural frequencies of the Flaperon system. Boeing would perform frequency response dynamic analysis of the Flaperon. They make any adjustments to avoid or dampen resonance issues. Boeing ensures that the structural materials and designs are strong enough to function well within the realm of operation. This includes the ability of all Flaperon parts to undergo MANY cyclic loadings, all well within their stated operational and maintenance life cycles. The Flaperon undergoes engineering analysis, scale tests and eventually flight tests. Final design and manufacture of the Flaperon is adjusted such that it operates without any vibration, systemic harmonic, or flutter issues while the B777 operates WITHIN its safe aeroelastic stability envelope (plus some contingency).
The design and manufacturing limits are exceeded the further a B777 is exposed outside of the safe flight envelope.
Lying in between everyday successful flights (clearly within design + contingency) and a 0.82 mach impact with earth (clearly outside of design) sits this “danger region” of surface and structural component failure. The time exposure of a B777 in the “danger region” at a given starting altitude for a spiral dive has been estimated and published.
@ventus45
The Indonesia AIP docs are also an informative source of information (ENR 1.6 ATC Surveillance Services And Procedures).
The MSSR & ADS-B site at Gunung Linteung, Banda Aceh (N 5.541766° E 95.500779°), might have been relevant but do note that it is not equipped with PSR.
MY and ID had, jointly, scoped data sharing from the ID ADS-B sites providing surveillance of the WMKK FIR, such as the Gunung Linteung site, but no agreement had been concluded in 2014.
@George G. Whether there is one actuator in by-pass depends on whether the APU has started or not. If it has, both will be operative. By my estimate, MH370 speed at the time of the last transmission would be a deal less than that needed for flutter and the APU was of course running, so both flaperons would have both actuators operative. Supposing the dive acceleration continued and the APU stayed on line until high speed was reached then the actuators would be rigid, within the limits of their relief valves. That on the actuator’s extension supply line would be most vulnerable given it would be at higher peak pressure were there flutter.
On opening that would change the flutter conditions.
In the Silk Air 185 dive that 737 reached at least M=0.97. It shed various pieces of empennage in flutter, at two different stages, ie speeds/altitudes.
I think Argiris Kamoulakos of CAPTIO did a good job in demonstrating that the flaperon would fall leading edge down and, to me, that impact would be consistent with the crush damage on the leading edge at the outboard end. I think this largely rules out the trailing edge separating on the flaperon hitting the sea.
Also, I think the work he did demonstrating how the trailing edge would break off on hitting the sea in a ditching (albeit with a very high descent rate) was impressive. In his model the trailing edge failed when it had penetrated the sea by just 8 – 10 cm, though that result is indicative.
For these reasons I think the trailing edge most probably would have come off in flight in this flutter scenario, which would alter the stresses of Tom’s analyses.
About your second question, by my estimate that trailing edge departure would have led to an immediate overstress of the hinges in tension (though possibly they might have been weakened by fatigue at that point).
Subsequent stresses would separate the actuators too (that also needs to be addressed).
However I do not think that that sequence is consistent with the damage to the flaperon, whose upper skin carries a crease from overtorque and cracking at the leading edge, also quite possibly from that; or the damage to its inboard end; or that evident in the adjacent outer flap.
That is why I prefer another explanation for the flaperon’s separation though other pieces might well have departed in flutter or overstress in flight, including a wing.
@ASLM: I agree with @paul smithson. Your early evaluation of the flaperon was very insightful.
@Paul Smithson
You stated: “The drift analysis excludes 40S. Well, that’s your secret, isn’t it, since you have not published the results.”
You also stated: “@DennisW. Reminder: there was a discussion about this and it transpired that the drop-off in the graph represented the cut-off of the data range used, not the end of the probability distribution. Subsequently, DrB et al have been working on a dataset that includes the 40S zone and beyond – with results eagerly awaited but yet to be published. We are told that the new analysis pinpoints, with uncanny accuracy and confidence…..a particular favoured spot.”
The new drift analysis is not a secret. It is a work in progress.
The initial analysis is complete and we are discussing the results. We are making sure that every “i” is dotted and every “t” is crossed, before publishing.
We expect the new paper to be over 200 pages long. So far we have written up over 100 pages.
Given the amount of excellent and high quality scrutiny, the analysts on this web site will offer, you can imagine, that we are being careful before publishing anything.
The new drift analysis considers latitudes near the 7th Arc from 7.7940°S to 44.1632°S. There is no artificial cut off at 40°S.
So far, the probability density function shows the most likely crash latitude is at 34°S.
So far, the probability density function at 40°S and further southwards is 1,000 times less likely than 34°S.
So far, the probability density function at 30°S and further northwards is 1,000 times less likely than 34°S.
We reserve the right to change our views, in light of further analysis.
My advice to you, is not to start criticising the paper before you have read it, with comments about “uncanny accuracy and confidence” and “a particular favoured spot”. You usually start criticising after publication.
@Richard
My sincere advice to you is that perfecting your paper results in closing off any objective dialog about the methodology.
@Sid
I appreciate the care, myself. When I find errors in papers it makes me think they are suspect. I have a Chilean MD (and professor) friend who is a world class physician and researcher in Chile. She sends all of her papers to me for review before she submits them. MD’s (and economists) are horrible mathematicians.
@Richard.
I haven’t criticised your paper, I have criticised your trailing of the paper whereby you keep insisting that an as-yet-unpublished analysis supports your conclusion to the exclusion of all others.
As for pdf’s:-
DSTG figure 10.3a of 7th latitude (BTO only) indicates a global peak between 39-40 latitude, while 34S is indistinguishable from zero. Between BTO and drift probability distributions, I know which one I would place greater confidence in.
https://docs.google.com/document/d/1LjSd4F-8lt3Fx8gJ_vVftipyRnyFcUVqWYec9jKhys0/edit?usp=sharing
@Paul Smithson
The number of commenters on this blog wanting to know, what the results of our drift analysis are and when we will publish those results, are much greater than those like you who do not want to know.
On one hand you complain, that we are keeping the results secret.
On the other hand you complain, that we are trailing the paper, when we release some advance results.
Quite clearly, we are dead if we do and dead if we don’t in your book.
Comments about “uncanny accuracy and confidence” and “a particular favoured spot” are unhelpful criticisms.
@Kenyon
Acknowledge your reply. Thank you.
@David
Thank you for your reply.
This began as a (I then thought) simple query as to whether,
should the flaperon be in a torsional flexing flutter mode,
as to whether loss of the trailing edge would rapidly lead to loss of the whole flaperon
(by failure of the attaching componentry).
It has now led to a review of all that I may have accessible on the subject of the flaperon loss, including analyses from both of yourselves. But sleep and subsequent daytime commitments necessitate interruption.
David, in your final sentence in Comment# 29751 above you say you “prefer another explanation for the flaperon’s separation”. Part of the review mentioned above needs to include all the information ATSB were able to tease out of inspection of the damage or markings on the adjacent outer flap. If the flaperon had indeed been rapidly flexing and the outer PCU was the one not in hydraulic lock then perhaps (very little chance, but) the witness marks on the flap might be indicative.
And all this in (vain ?) hope that a potential future search need only be over a more restricted search area than otherwise would be the case.
@Sid Bennett
You stated, that we are: “closing off any objective dialog about the methodology.”
The paper published above in this post has been subject to ca. 2,000 comments from over 40 commenters on this blog, who have pointed out errors and flaws, made additions, corrections and alternative proposals, discussed methodology and results, agreed and disagreed with findings, tested assumptions, offered positive and negative criticism, reviewed, extended, explained, supported, contradicted, praised, condemned and questioned a large number of themes relating to the paper and other MH370 topics of interest.
I am sure that the next paper will be subject to the same level of scrutiny, including an objective dialog about the methodology.
@Richard
Re: drift model report
Was there some recent partial-results disclosure on an NoK site or something?
I saw a nice graphic saying the debris might in theory be getting back OZ, though the chances are very small that much debris is still floating.
@George G wrote “And all this in (vain ?) hope that a potential future search need only be over a more restricted search area than otherwise would be the case.”
Concerning the relevance of the flaperon detachment.
If the flaperon, or a greater part of the right wing, detached during descent it may be the case that the debris field is more distributed than would be the case if the entire airframe was intact just prior to impact with the ocean. That is very relevant to analysis or interpretation of the imagery produced by ensonification of the seafloor with side-scan sonar.
@ALSM, @DennisW, @ventus45:
Before checking comments here, I read through Peter’s thesis and found that he made many interesting points, without yet knowing where his conclusions were headed. Exploring antenna gain was only one of his research questions. His meta-analysis showed some surprising patterns, especially over time.
I was especially intrigued to see that his antenna-based headings for a northern route were a good match for the Java path past island airports, except that disambiguation by BFO flipped two of them to the opposite direction. Sorry to hear that the EIRP was compensated on transmit for predicted directional gain. I guess other factors made for the received variation in dbm. Still, I think Peter’s thesis is work looking at.
@Kenyon:
You appear to be researching a dichotomy between flutter or flaps-down-ditch. You wondered what other rearward force might detach the hinges. I’ve noticed that the damage to AF447 looks to be on the same order as that seen on MH370 debris. Photos are sparse, but some airfoil parts have lost their trailing edge and shattered. AF447 entered the water in a flaps-up stall, possibly pitched up but with similar forward and vertical speeds.
@Richard:
Thank you for considering latitudes all the way north to Java in your new drift report. I hope you will keep an open mind on not penalizing a northern origin for having debris arriving in an area long before it was discovered. I’m looking forward to seeing your results.
I’d like to request assistance from @Richard or anyone who has a drift model…
In Feb I posted a MODIS AQUA satellite image of a “sunglint” taken three days after 7th arc timing at 0623Z on Mar 11. It shows a cloud-free patch of ocean west of my Java candidate site, with curious striations on the surface. More details on sunglints and the images here:
https://370location.org/2018/02/a-strong-anomalous-acoustic-event-on-the-seventh-arc-near-java#sunglint
I made a naive estimate on drift based on the Nullschool model wind and current reports, guessing that debris field had moved only about 25-30 km in those three days, first west, and then north. This week I see from drift plots that the debris field may have moved much faster, maybe 180 km WNW in that time. If instead the debris was spread over an area some 70-90 km NW, those unique sunglint striations might be an image of it.
I realize that my acoustic candidate site implies piloted turns that don’t fit with straight path optimization, but I’d really appreciate any help on getting a best estimate of the location and dispersion of a debris field from a 7th Arc 8.36N origin to the time of the sat image.
A kmz overlay of the original infrared image is in the link above showing clouds, and here’s a heavily contrast enhanced overlay:
https://www.dropbox.com/s/jqd273zv26c0uwg/SunGlint-2014-03-11@0623.kmz
Thanks for keeping this forum going, and for the continuing insights!
— Ed
@TBill
The information given to the NOK was as a result of their request to know, whether it is possible that MH370 floating debris is still adrift and whether it is possible that debris might land back in Australia after a complete circuit of the SIO.
It takes on average 2.8 years to complete a circuit of the SIO from the 7th Arc to the coast of mainland Africa and back to the 7th Arc. Very few MH370 debris items will complete this circuit, the majority end up beaching somewhere or being caught in eddies and not going anywhere fast. Those few debris items, that complete the circuit, are caught by the winds of the so-called roaring forties or by the Agulhas Current off the South African coast, and head back East between 40°S and 45°S. They are more likely to head towards the coast of Southern Australia and Tasmania, when they get back to the 7th Arc, than they are to start a second circuit.
https://www.dropbox.com/s/mxzc2n81jzt9b3e/Photo%2029-11-2020%2C%2016%2032%2056.png?dl=0
@DennisW
Such colleague checks are prudent, but they are more effective if the colleague is not a co-author, and the same person reads the entire paper in its current state. We can see this in many fields of endeavor in the acknowledgements.
@paul smithson
Your comment regarding the possibility of an idle descent at the end is interesting. In order to reach the 6th arc at the correct time…
a. When would the descent have started? (I presume that this mode would have been pilot initiated.)
b. What is the response of the flight control system when an engine exhausts fuel during an idle descent? The the thrust imbalance is not as high as a full power mode.
@Sid, according to the tables, idle descent profiles look like this (from FL350):
M0.84/280/250 – -1400FPM(?), time 25 mins, distance 128 nautical miles, fuel required 680kg
M0.84/250 – -1250FPM(?), time 28 mins, distance 135NM, fuel 720kg
M0.84/310/250 – time 23 mins, distance 118NM, fuel 640kg
If you start off higher, you go further for longer in idle descent with not a great deal of extra fuel.
You would need to work out for yourself the effect on actual slow-down by converting CAS to TAS at the varying altitude and factoring in the changing headwind by altitude. I haven’t had time to do it yet.
I’m not sure where (altitude/speed) an idle descent profile is supposed to end. I’m someone here can comment.
@paul smithson: Are you assuming the FMS is automatically managing the descent towards a waypoint with a lower altitude? Or a pilot is replicating an efficient descent?
@Sid,
On the back of an envelope…
If you were “on time” at Arc5 I think it is difficult to see how you could fit in an entire idle descent before Arc6 and arrive there on time. Lets say your were at FL340 M0.84 with TAS ~480 about about 20kt headwind. In 25 mins you travel about 192NM over ground. On the idle descent the table says you travel 128NM (with no headwind). Although your are approaching the ping ring at an angle, that is still going to generate far too big a BTO deficit at 0011.
I think it is certainly possible to start slowing down well before 0019, and my initial estimates said you could do that from 15 mins earlier, but not 25-28 mins earlier. But then you can’t be descending at 0011 with normal ROD because it isn’t showing up in the BFO (which would be 20+Hz different descending vs constant altitude).
Both considerations count against explaining extra endurance via idle descent.
@Victor. Not assuming either but I think possibility of active pilot or pre-programmed could both be considered possible. I’m trying to find a theoretical possibility that could bridge the endurance gap.
If active pilot, the objective could be to stay (under control) in the air for longer. If you don’t begin descending when your first engine goes down you are going to be out of fuel in a few mins vs another 25+ mins of powered/controlled flight.
@370Location
You asked how far MH370 floating debris would travel from a crash at 8.36°S 107.92°E near the 7th Arc in the 3 days following the 8th March 2014.
I have linked below a chart of the Indian Ocean, close to Java, where the 7th Arc is marked in black and the trajectories of 49 drift simulation trials from the 7th Arc for crash latitudes between 8.34°S and 8.38°S for the time period 8th March 12:00 UTC to 11th March 12:00 UTC are marked in red.
https://www.dropbox.com/s/ttyvhuvui8jzy1d/Ed%20Anderson%203%20days%20from%208.36%C2%B0S%20107.92%C2%B0E.png?dl=0
The locations, where 33 MH370 floating debris has subsequently been found and reported, do not match a crash latitude at 8.36°S 107.92°E.
@TBill
Here is a link to a better chart, shared with the NOK, which includes the 7th Arc for ease of reference.
https://www.dropbox.com/s/o1mr6qbpn9gm4ja/MH370%20Floating%20Debris%20End%20Points%20after%201030%20days%20from%20crash%20latitudes%2034%C2%B0S%20to%2035%C2%B0S%2010%20day%20tails.png?dl=0
The black dots on the coast mark where MH370 floating debris drift simulation trials from a crash latitude between 34°S and 35°S have beached.
The black dots with coloured tails represent 10 days of trajectory between 1020 days and 1030 days after 8th March 2014.
This chart is not included in the upcoming paper, as it assumes a crash latitude between 34°S and 35°S, whereas in the paper we make no assumptions about the crash latitude other than it is in the vicinity of the 7th Arc somewhere in the SIO between 8°S and 44°S.
@all
Full moon tonight along with a penumbral lunar eclipse. High likelihood of a major earthquake tonight.
Peak eclipse early tomorrow morning local time (02:42 MST / 09:42 UTC).
@Dennis: “High likelihood of a major earthquake tonight” Am I missing the joke here?
Still probably better than the reflexive fake Native-American-named “moons” AP gives us each lunar maximum…
@Ikr
No joke. Just speculating.
@370Location
MH370 floating debris drift simulation trials (total 49) from the 7th Arc for crash latitudes between 8.34°S and 8.38°S for the time period 8th March 12:00 UTC to 11th March 12:00 UTC travelled between 158.3 km and 168.4 km on a bearing between 281.2°T and 291.3°T at a speed between 1.2 knots and 1.3 knots.
@370Location
MH370 floating debris drift simulation trials (total 20) from the 7th Arc for crash latitudes between 8.35°S and 8.37°S for the time period 8th March 2014 12:00 UTC to 29th December 2016 12:00 UTC travelled to Northern Madagascar, Northern Mozambique, Tanzania, Kenya and Somalia. However, the MH370 debris locations on Rodrigues, Mauritius, Reunion, Southern Madagascar, Southern Mozambique and South Africa were missed.
https://www.dropbox.com/s/qu06o46g54ydm7b/Ed%20Anderson%201030%20days%20from%208.36%C2%B0S%20107.92%C2%B0E.png?dl=0
@George G. “If the flaperon had indeed been rapidly flexing and the outer PCU was the one not in hydraulic lock then perhaps (very little chance, but) the witness marks on the flap might be indicative.”
As designed, had there been an inoperative PCU, the RAT being in operation, the APU not, it would have been the inboard. “Very little chance” as you say. It would have to be something off-design.
That said, while cyclic torsion generally might induce fatigue in a hinge I think the attendant lateral flaperon movement will be small in comparison to the flaperon/flap gap when housed (note the soft seal size). Besides as you will have seen, apparently the collision between the two was forceful enough to penetrate and break the flap. If a result of flutter most likely that would be at flaperon separation, discussed below for those interested; including Tom I hope.
https://www.dropbox.com/s/hw2rlbp681up7hj/Comments%20on%20the%20flaperon%20hinge%20fatigue%20from%20torsional%20flutter%20possibility..docx?dl=0
Also discussed are ditching fractures.
Overall outcome:
• Some clarification but nothing changed much.
• The prospects of flaperon separation being close to the 7th arc are higher than after a glide IMO and higher still after Tom’s paper but not so strong (as yet) that a glide can be dismissed. Lack of fuel to keep a pilot alive adds a deal to the probability though, at least at the UGIB site.
• I think the trailing edge would break off in a flaps down ditching. At the ensuing separation of the flaperon as that dug in more, the possibility remains that that would lead to hinge failures similar to those exhibited.
@paul smithson: A “pre-programmed” descent means a waypoint near the 7th arc at sea level was entered. Is that really what you believe?
@George G. Editorials made to the Dropbox article to improve readability.
@Victor
@PaulS
I like the idea of descent at Arc5, but my current vision is pilot setting a certain descent rate (300-400 ft/min) (not waypoint related). I am not talking about pre-program, rather active pilot action.
Victor- is there any way to pre-program a descent, other than at an airport?
@ David, my comments to your 30th November contribution:
Thank you for your efforts. To perform the FEA studies degrees of freedom were reduced to simplify the problem statement so that the fundament hinge failure evidence (as shown in the public photographs) could be better understood. There are no ordered sequence of events considered in the FEA analysis as you have offered in detail.
The FEA study assumes that the Flaperon leading edge structure dimensionally ties (for practical purposes) the distance between hinge top sections during the torsional movement therefore imparting similar fatigue/loads to both inboard & outboard hinges. A more dynamic FEA model would likely agree with your details regarding amplitude of loads making one of the hinges a winner in the race to catastrophically fail and the other an immediate second place. My study does not undertake the more detailed setup to determine which hinge failed first. It was not required to differentiate the two hinge failure modes.
“Probably intractable is whether in flaperon torsional flutter its outboard hinge point support arm would fail in fatigue before the hinge support.” Not sure I know which support arm is in question, however the support cantilever beams that anchor to the main wing structure (actuators, secures upper wing surface panels, connect pin-pivot system on lower hinges, etc.) are massive, stiffer, and stronger in comparison to Flaperon hinge system.
“To what extent have you allowed the possibility of different dimensions most likely leading different stresses in the hinges with, as you assume, both actuators operative?”
– All dimensions (as estimated) for the alloy Flaperon hinge (as well as temperature and material) are fully incorporated into the FEA Model. Actuator operation status was outside of the scope of FEA study. Various material selection and temperatures produce very similar results.
“A possibility here should you wish is that you assess the stresses having assumed the trailing edge separated, for an indicative outcome.”
– As you know (but for benefit of others) two basic setups were modeled in the FEA. One with fully-reverse lateral loads in the inboard outboard direction. The other with an upwards forced acting on the original (and damaged) trailing edge. The red % damage zones are all similar regardless if upwards force was applied on a new Flaperon TE or the damaged (resulting) TE.
– Keep in mind the soft-body Flaperon was given infinite strength in the FEA simulations. Why infinite strength? Because I’m unable to model the soft body structure beyond a conceptual engineering phase (same as CAPTIO unless they have access to Boeing B-777 design documents). Additionally, considering the Asiana Air Flight 214 right-side Flaperon example, the soft-body structure was virtually destroyed by forces applied beneath the Flaperon without separating the primary alloy attachments from the wing structure. FWIW, the infinite soft-body strength assumption gives benefit of doubt to the scenario that enough force was available to achieve alloy hinge tension failure through an upward over-rotation of the Flaperon.
@All The sketch to show a torsional flutter scenario is a quick cartoon (10 minute GIF effort) to convey the concept since just words in my report would be insufficient in conveying to many interested (non-technical) and contributing participants. The cartoon is not an output of the technical FEA analysis, dimensions etc. are not accurate, and a general trailing edge representation is shown. One could produce a dynamic representation but it would take considerable time and have no significant return on conveying the concept of torsional flutter.
@victor, I agree that looks extremely improbable. A live pilot opting for idle descent to extend endurance is tenable, I’d have thought.
Flaperon
Much attention has been focused on the flaperon. It was way back in August 2015 that it was handed over to BEA. Their findings were published in the ATSB`s update of 2 November 2016.
It is reproduced below:
Analysis
Damage to the internal seal pan components at the inboard end of the outboard flap was possible
with the auxiliary support track fully inserted into the flap. That damage was consistent with
contact between the support track and flap, with the flap in the retracted position. The possibility of
the damage originating from a more complex failure sequence, commencing with the flaps
extended, was considered much less likely.
With the flap in the retracted position, alignment of the flap and flaperon rear spar lines, along with
the close proximity of the two parts, indicated a probable relationship between two areas of
damage around the rear spars of the parts. This was consistent with contact between the two
parts during the aircraft breakup sequence, indicating that the flaperon was probably aligned with
the flap, at or close to the neutral (faired) position.
Numerous other discrete areas of flap damage were analysed. Some of the damage was
consistent with the flaps in the retracted position, while other areas did not provide any useful
indication of the likely flap position. It was therefore concluded that:
• The right outboard flap was most likely in the retracted position at the time it separated from
the wing.
• The right flaperon was probably at, or close to, the neutral position at the time it separated from
the wing.
From that my understanding would be, that the flaperon separated from the inboard section of the flap during the break up sequence and not for any complex reasons such as fatigue.
In such a scenario where flaps were retracted it is more likely than not there was no controlled ditching. I note that there is minimal compression damage to the leading edges of both the flaperon and its inboard flap section.
@Tomy wrote that the flaperon “ was handed over to BEA”
No, after recovery from the shore at La Réunion by the local gendarmes it was ‘seized’ by the investigation team established by the Paris Prosecutors office & shipped to the DGA/TA facilities in Balme, Toulouse.
BEA had no involvement at all.
@Kenyon. Thank you for your further remarks Tom. My efforts have to integrate and weigh the outcome of your paper with other evidence but in attempting to do that I need to understand the paper’s import.
Your Concept Sketch clearly illustrates bending at the hinge fracture zones though as I understand you now there is no stress due to bending in your model, simply straight tension and compression in the hinges, those leading to fatigue in one. I expect the other would fail in bending subsequently.
That would explain also why you do not discriminate between the two sides as to stress levels, supposing their cross sections resisting those stresses are the same area. If that is so I understand your Case 1 model better.
You point out the hinge support arms/cantilever beams are robust and will be stiff. However they are also long. Obviously with any load they will deflect, the question being by how much. That deflection under those compressive and tensile loads will introduce the hinge bending you illustrate in your Concept Sketch, which like you I utilise just for such illustration.
Besides stressing the cantilevers (though as you imply probably not to fatigue inducement) that bending will add stress in the hinges, altering your damage assessment I would have thought.
By how much I expect we will not know.
On your Case 2, you say, “Why infinite strength? Because I’m unable to model the soft body structure beyond a conceptual engineering phase (same as CAPTIO unless they have access to Boeing B-777 design documents).” Argiris Kamoulakos assessed the flaperon skin tension forces needed to break the trailing edge at its rear spar and found that they would be exceeded. While not knowing the precise Boeing carbon layer layout I think his estimation was thorough. For those who have not read it, it is below. I would suggest starting at page 12. His assumptions about the skin are at page 14, bottom.
http://mh370-captio.net/wp-content/uploads/AIAA-Aviation-Forum-2020-CAPTIO-paper.pdf
I cannot follow what the sequence was in the Asiana crash. The left flaperon appears to be broken chordwise with part of its trailing edge missing. It may be than damage was from collision with the missing outer flap or engine/parts therefrom. From a photograph I can post, the flaperon trailing edge on landing is above the bottom of the fuselage at the wing rear, wings level.
All: I have a new post on the topic of voting irregularities in the presidential election in Pennsylvania. Because this is a very different topic than MH370, I will not close comments here. Continue to comment here on MH370 and other aviation matters. Meanwhile, comments about the election results in PA should be added to the new post. I’ve tried hard for this site to not be political because I value the contributions of all, independent of political views. In that spirit, I tried to be factual and unbiased in the new post.
@David, thank you for taking time to research and offer feedback.
“If that is so I understand your Case 1 model better.” Yes you understand perfectly even though my report does not fully elaborate. This forum helps address open gaps. I could have done a better job with describing the premise, but unfortunately don’t have the bandwidth to write an exhaustive technical report.
Other thoughts:
– Without deeply researching my notes and drawings, the flange thicknesses on the cantilever beams were on the order of 4x thicker than the upper hinge flange. (FWIW the FEA analysis assumes isotropic alloy construction in all primary attachments.)
– Drawings and 3D Model of the Flaperon body structure were developed as part of my studies, but for other reasons than CAPTIO’s 3D model and FEA study. Argiris Kamoulakos and team did a great job with their drawings, FEA, and conceptual meshing as far as I can tell. CAPTIO’s Flaperon superstructure model is more advanced than mine, it appears to have put a very reasonable effort into the anisotropic materials. However, performance analysis of the soft-body structure was outside of the scope of the Hinge FEA.
– Observation of MH370’s recovered Left Flaperon soft-body damage, Asiana Air 214 Right Flaperon, and MH-17 wreckage is part of my February 03, 2017 (Rev 3.1) report. Asiana Air 214 did not flip over so the Flaperon took blow(s) from bottom and or side(s). The resulting vector loads transferred from the soft-body structure to the primary (alloy) attachments were not great enough to impart enough tension, compression, shear, or tear-out forces on the Flaperon alloy hinges to catastrophically fail.
@Kenyon, Thanks Tom and for staying up late.
@Richard:
Many Thanks for running multiple drift analyses for my candidate site!
From the details in your second post on the dispersion of the debris file, it appears that the red pixels of 49 trials in the first map are the whole 3 day track. I plotted the field from your info being roughly 10km wide E-W after traveling 163 km, with a somewhat N-S angular uncertainty of about 30 km. It does not match the area I’d hoped on the sat image, but is still intriguing.
I’m surprised that the field has not dispersed more. My simplistic understanding is that the surface current speeds are a combination of subsurface ocean current speed plus Stokes drift from wind-developed waves. With surface currents of 8-10 km/day I expected that the barely buoyant heavier debris (or oils) with no leeway windage would move closer to that slower rate. Apparently I need to hit the books again.
Your drift analysis of 20 full trials through to Dec 2016 is also very interesting. It shows endpoints farther north, similar to the CSIRO reports, although still compatible with some of the 33 debris finds. Other drift models have shown more direct travel from near my Java site to Madagascar.
Dr Oleksandr Nesterov was an early contributor to MH370 forums, and published a credible paper that was discussed here at the time.
DOI: 10.5194/os-14-387-2018
His drift model uses HYCOM for surface currents and GDAS for wind data. He does not directly calculate for Coriolis force or Stokes drift, but I believe those factors are accounted for by surface currents and winds (with some lag for fetch), plus his randomized windage factor. Oleksandr kindly simulated 50,000 random windage drifters for my starting point, and that result was very encouraging:
https://370location.org/wp-content/uploads/2020/08/200613-Oleksandr-Nesterov-custom-drift-Ensemble_108.00E_8.36S.mp4
His simulation appears to be in agreement with yours up to the bulk of debris traveling in the Southern Equatorial Current at the same latitude of around 10.2S. As you can see, his simulation then shows particles arriving early at all of the debris destinations, though Reunion and Rodrigues take a bit longer at cooler temperatures.
I realize that I may have to wait for your full report, but it would greatly help my understanding if you might outline how the 2018 model by @Oleksandr compares to your newly refined calculations.
BTW, Oleksandr also worked on incorporating GHRSST sea surface temps into his model, with an interest in matching reported barnacle growth with drift paths.
Thanks again for your work, and your help!
— Ed
For those wishing to conduct their own drift studies, the output files from CSIRO that we are using were made available for download by David Griffin. They are in the format of large Matlab .mat files, which can be imported and read with Matlab or python. (I used python.) The files provide the trajectories of 80,000 virtual particles that are injected in proximity of the 7th arc (but not exactly on the arc in order to create diversity) between 44S and 8S latitudes.
(Note: The dnum parameter can be converted to days after crash by subtracting 735666.)
Directory: http://www.marine.csiro.au/~griffin/MH370/data/?C=M;O=D [Directory now corrected]
Flaperon data: br15_MH370_IOCC_tp3l1p2dpf10_20_99_arc7_4408_15_tracks.mat
Generic (non-flaperon) data: br15_MH370_IOCC_tp3l1p2dp_arc7_4408_15_tracks.mat
Note: I doubt anybody has developed a more accurate drift model than David Griffin. That’s why we chose to directly use his results.
@VictorI,
Thanks for the explanation. That perfectly explains why some of the drift paths started east of the arc, and looked similar to the earlier CSIRO plots 😉
I’ll grab those .mat files, and can explore them in both MATLAB and python.
Much appreciated!
@370Location
I notice that Oleksandr’s model seems to show some particles eventually tracking back to Arc7
@VictorI:
Those tracks..mat files seem to be gone, and no .csv with the same name.
However, I did pull down his Nov 2011 non-flaperon track gifs for segments N of 35.25 along the 7th Arc. I stitched them into an animation:
https://www.dropbox.com/s/1w9fj2eineps4b2/20181101-DGriffin-br15_tracks_nonflap_36_08_25-mapwent_tp3l1p2dp_arc7_3608_25-all.mp4
@TBill:
If you’re referring to the @Oleksandr run for Java origin (vs his paper), it shows debris getting stuck in the Sunda Straight. Odd, as that’s more N than DGriffin but ends up more S. There does seem to be a bit of debris that’s in a gyre off of Java for months near the arc.
@370Location:
Try these Dropbox links:
https://www.dropbox.com/s/3jft6u8b8hkmgrh/br15_MH370_IOCC_tp3l1p2dp_arc7_4408_15_tracks.mat?dl=0
https://www.dropbox.com/s/300xyyqpj01hgkw/br15_MH370_IOCC_tp3l1p2dpf10_20_99_arc7_4408_15_tracks.mat?dl=0
[These Dropbox files have been removed, and the links to the CSIRO directory have been fixed.]
@All: Due to the size of these .mat files, I won’t keep them up on Dropbox for more than several days. If you want them, please download them now.
@All: I see I have supplied the wrong directory for the CSIRO files. Try these links:
http://www.marine.csiro.au/~griffin/MH370/data/br15_MH370_IOCC_tp3l1p2dpf10_20_99_arc7_4408_15_tracks.mat
http://www.marine.csiro.au/~griffin/MH370/data/br15_MH370_IOCC_tp3l1p2dp_arc7_4408_15_tracks.mat
I will be removing the Dropbox files.
@VictorI: Thanks for fixing the links. I’m able to load and plot tracks from both files, all 172,800 tracks.
Kudos also to DGriffin, CSIRO, Richard, and the whole team for your continued work on the drift analysis.
@370Location
You stated: “I’m surprised that the field has not dispersed more.”
The average current in the Indian Ocean is 0.426 knots, but this can vary between nearly zero and over 5 knots (measured over 24 hours) depending on location and time of year. In your case, for a crash latitude of 8.36°S 107.92°E and the first 3 days after the crash, there was between 1.2 knots and 1.3 knots, which is a strong current. There is less dispersion in a strong current, where floating debris tends to follow a more straight line.
As Victor has pointed out, we are using the CSIRO data, which David Griffin kindly made available. The CSIRO data is based on a 20 year data set (1993 to 2012) of ocean and satellite observations, a data assimilation algorithm and a 250 km domain localisation process. The granularity of the data sets results in a 0.1° latitude x 0.1° longitude grid. Anomalies are generated by calculating the difference between a 3-day mean and a 3-month mean, over the last 12 years of data. The CSIRO data additionally uses the actual surface wind and wave data, supplied by the European Centre for Medium-Range Weather Forecasts (ECMWF), US National Oceanic and Atmospheric Administration (NOAA) and the Australian Bureau of Meteorology (BoM).
I have compared the CSIRO data to that of other oceanographic institutes: Jansen et al. CMCC, Durgadoo et al. GEOMAR, Trinanes et al. NOAA, Pattiaratchi et al. UWA, Garcia-Garrido et al. CSIC, Corrado et al. CNR, …
There are multiple models used: GDP, OSCAR, ORCA, HYCOM, AVISO, …
I concluded that the CSIRO data provides an excellent and proven model covering all the Southern Indian Ocean. I have verified the CSIRO model against the GDP data from NOAA and the SLDMB data from AMSA.
I have not used the model of Dr. Oleksandr Nesterov, because:
(1) Prof. Pattiaratchi had already developed a model of the Indian Ocean using HYCOM.
(2) Dr. Oleksandr Nesterov is a specialist in Fluid Mechanics, Coastal and Marine Engineering, Sediment Transport, Dredging, Reclamation, Flood Modelling, Environmental Hydrodynamics and Water Quality Modelling and not a member of a mainstream oceanographic institute.
Unfortunately only one of the papers of the oceanographic institutes mentioned above consider a crash latitude of 8°S as possible. The most northern latitude included in any paper is centred on 14°S in the paper from Durgadoo et al. GEOMAR, which uses a backtracking method. This paper is based on the ORCA05 model, ARIANE software and the use of backtracking is problematic to say the least. The CSIRO data is based only on forward tracking.
As you have now downloaded the CSIRO model data, you can verify for yourself, the data I prepared at your request. I used the generic data for this purpose.
@370 Location: I’m glad you can work with the CSIRO data files. Just be careful to use the correct ones for flaperon and non-flaperon (generic).
@370Location
I previously sent the drift analyses for your candidate site using the generic CSIRO data.
Here are the same drift analyses using the Flaperon CSIRO data.
https://www.dropbox.com/s/ozqhtz2me9bjkds/Ed%20Anderson%203%20days%20from%208.36%C2%B0S%20107.92%C2%B0E%20Flaperon.png?dl=0
https://www.dropbox.com/s/887yrimxhg591ud/Ed%20Anderson%201030%20days%20from%208.36%C2%B0S%20107.92%C2%B0E%20Flaperon.png?dl=0
@Richard,
CSIRO has modelled three different classes of trajectory
1. Flaperon. This one is unique and peculiar to that particular item of debris because of its distinctive drift characteristics at an angle to the wind (the search for MH370 and ocean surface drift – Part II)
2. Flaperon-like debris (low windage). Other than flaperon and outboard flap, were there any other heavier, low windage items of recovered debris?
3. High windage items.
CSIRO Vol3 contrasts the drift trajectories of #2 and #3, finding that the latter is much more dispersed and that a proportion of fragments are projected to reach the Australian coast from all start locations along the arc (albeit differing fraction).
The results that you are have analysed and are discussing above are based on which category(ies) of item?
@paul smithson
We used two data sets provided by David Griffin (CSIRO). The first data set is a generic data set of 86,400 trials from along the 7th Arc, based on the leeway of undrogued drifters. The second data set of 86,400 trials is based on the results from the Flaperon sea trials, which showed a drift angle 20° left of the wind and an extra leeway of 10cm/s in excess of the Stokes drift exhibited by undrogued drifters.
1. Generic Data Set.
This CSIRO data is based on a 20 year data set (1993 to 2012) of ocean and satellite observations, a data assimilation algorithm and a 250 km domain localisation process. The granularity of the data sets results in a 0.1° latitude x 0.1° longitude grid. Anomalies are generated by calculating the difference between a 3-day mean and a 3-month mean, over the last 12 years of data. The CSIRO data additionally uses the actual surface wind and wave data, supplied by the European Centre for Medium-Range Weather Forecasts (ECMWF), US National Oceanic and Atmospheric Administration (NOAA) and the Australian Bureau of Meteorology (BoM).
The generic data is close to the drift characteristics of undrogued drifters, where the drift speed and direction includes the current and Stokes drift.
2. Flaperon Data Set.
This includes the results from the sea trials with an authentic Flaperon cut down to match the damage of the actual Flaperon found in Reunion. The Flaperon was found to drift 20° left of the wind and with an extra leeway of 10 cm/s in excess of the Stokes drift exhibited by undrogued drifters. The genuine flaperon was pitching over every few minutes during the sea trials and did not simply drift along with its tail raised to the wind. Other debris items all drifted with the same effective windage factor as undrogued drifters.
The Flaperon data is equivalent to the generic data, where the windage is modified with the extra leeway of 10 cm/s and the drift angle of 20° left of the wind.
3. Windage Models.
In addition David Griffin has provided data for windage models.
Three levels of windage are used:
a. No Windage – to mimic the drifters when their drogues are still attached.
b. Low Windage – to mimic undrogued drifters.
c. High Windage – to mimic ‘high windage’ items of aircraft debris.
The Non-Flaperon No Windage model is based on a current + 1.2%, 0 nm/day additional leeway and drift angle 0° left of wind.
The Non-Flaperon Low Windage model is based on a current + 1.2%, 4.8 nm/day additional leeway and drift angle 0° left of wind.
The Flaperon Low Windage model is based on a current + 1.2%, 10 cm/s (4.665 nm/day) additional leeway and drift angle 20° left of wind.
The Non-Flaperon High Windage model is based on a current + 3.0%, 4.8 nm/day additional leeway and drift angle 0° left of wind.
@Richard,
The details of your choices on drift modeling are much appreciated! You’ve fully explained the time steps and variations in the origin per track.
Thanks also for the extra two plots using the CSIRO flaperon-specific dataset. The full tracks appear to have shifted slightly S. Funny how the southernmost simulated flaperon heads straight for Reunion then takes a random walk around it 😉
Reading over the paper by @Oleksandr again, he also ran ensembles for each of the measured flaperon leeway and drift angle values. I suspect David Griffin also is using the same approach, with random leeway for the generic debris tracks.
Last time this topic came around, I explored the OpenDrift package in python, which can be configured for anything from oil spills to ships adrift. Unfortunately, I got distracted from pursuing that, but it might give me the time granularity for matching the sunglint image.
Interestingly, exploring the OSCAR model with earth.nullschool.net I just discovered that my site is on the fast edge of a clockwise coastal gyre, and moving just 3-4 km N on the Arc, the surface current is half the speed. It also changes little each day, so oil and barely floating debris might end up right at the interesting striations on the sunglint.
@Richard @TBill and some of you posed questions for me above, however I will no longer be participating on this blogsite and sharing information regarding my on the ground 370 investigation. In my view this blogsite has unfortunately become a forum for discussion, and promotion by some, of wild eyed conspiracy theories regarding politics and the US electoral process with which I do not want to be associated in any way. Those wishing to ask me questions about my 370 investigation are welcome to contact me privately.
@BG370: I have written a post about voting data that collects, analyzes, and interprets the data, and then asks questions about voting systems and processes. That’s exactly what I (and other contributors) have done with the MH370 data. I have not promoted a “wild-eyed conspiracy”. If you believe the quality of the voting data is low, the analysis is wrong, or you know the answers to the questions I have posed, I would be interested to hear what you have to say. Otherwise, you are only offering uninformed bias.
Professor Pattiaratchi puts the wreckage possibly wider than 50 miles either side of the 7th arc at 32 deg S.
https://www.airlineratings.com/news/mh370-not-crash-maldives/
@David
Right now I am in agreement with Professor Pattiaratchi. I am trying to understand how far away from Arc7 the crash site could possibly be, pending some fuel analysis. I am thinking in max fuel efficiency mode, it could possibly be quite far away from Arc7 along Broken Ridge. I would like to ask DrP how far away from Arc7 on Broken Ridge the crash site could be, consistent with drift analysis.
In this thread above is a link to an audio interview of Blaine Gibson with Mick Rooney from April 2020. Blaine mentions he and DrP favoring the 32S area and Blaine mentions Murphy’s Law as qualitative proof of the concept. I call it worse case scenario.
@Richard. Thanks for your detailed response – which was also my understanding of the CSIRO modelling. The reason I raised the question is, of course, the applicability of the datasets to the debris that we are discussing.
The “Flaperon” model is only applicable to the flaperon. Vol2 describes how idiosyncratic the drift characteristics were over short test drift durations. The long-term drift simulations that incorporated those characteristics produced markedly different trajectories and helped to explain how it could have reached Reunion on time (from multiple candidate start locations) where the original model – based on undrogued drifter – had difficulties explaining this result.
The “Non-Flaperon” model is, as you say, just that. Based on drift characteristics of undrogued drifter, it experiences stokes drift but negligble windage effect.
Its my understanding (from CSIROs writings) that undrogued drifter is considered (if not experimentally confirmed?) to be a reasonable analogue for larger/heavier items of debris.
However, its also the case that the vast majority of debris recovered is not of this sort. Honeycomb composites are light as a feather. Even if they lie quite flat to the surface, I would expect them to be heavily influenced by wind and wind-driven chop.
According to CSIRO, the high windage model predicts a more dispersed outcome, (including non-negligible beaching on Australian coast from all candidate locations along the 7th arc – making that a much less useful dependent variable for the purpose of latitude discrimination).
You state above that you used the Flaperon and Non-Flaperon aka Generic dataset. Could you explain briefly why you have elected to do so if the Flaperon model is applicable only for the flaperon, and the Generic model is not applicable (without addition of integral windage adjustment) to the found debris items we are using as “observables”?
@paul smithson
You stated: “Its my understanding (from CSIROs writings) that undrogued drifter is considered (if not experimentally confirmed?) to be a reasonable analogue for larger/heavier items of debris.”
This is not my understanding. An undrogued drifter weighs 4kg. The average weight of the 33 MH370 floating debris items was 4.881 kg. These are generally light weight items similar to an undrogued drifter. The exceptions are the Flaperon at 40 kg and the Outboard Flap at 39 kg.
1. The Non-Flaperon Low Windage model is based on a current + 1.2%, 4.8 nm/day additional leeway and drift angle 0° left of wind.
2. The Flaperon Low Windage model is based on a current + 1.2%, 10 cm/s (4.665 nm/day) additional leeway and drift angle 20° left of wind.
3. The Generic data is based on a current + 1.2%, 10 cm/s (4.665 nm/day) additional leeway and drift angle 0° left of wind.
4. The Flaperon data is based on a current + 1.2%, 10 cm/s (4.665 nm/day) additional leeway and drift angle 20° left of wind.
There is a very small difference between the Generic data and the Non-Flaperon Low Windage model of 0.135 nm/day.
Sea trials were performed by CSIRO using replicas of a number of the debris items including the Flaperon, Engine Cowling Name Plate “Roy” and No.7 Flap Fairing 676EB. The windage of these debris items was carefully compared to that of oceanographic drifters, whose travel times across the SIO are well known. Non-Flaperon debris items all drifted with the same effective windage factor as undrogued drifters.
To illustrate how significant – and how variable – leeway characteristics are, this is a good read. The annexes provide sourced data on the leeway characteristics of a very wider variety of targets in the water. Even those that lie “flat” on the water – like a wooden board, exhibit significant downwind leeway and typically also exhibit “non-zero cross-wind leeway”
https://apps.dtic.mil/dtic/tr/fulltext/u2/a366414.pdf
@paul smithson
Many thanks for the interesting paper on leeway.
Here is a table of the 33 MH370 Floating Debris Items with the material, dimensions and weight.
https://www.dropbox.com/s/e3jf4nn3vo8k4fq/Debris%20Dimensions.png?dl=0
It would be interesting to see what leeway each MH370 item exhibits.
@Richard,
Thanks for responding. I infer that you have used four model variants in some manner in your analysis: 1) Non-flaperon No windage 2) Non-flaperon low windage 3) Flaperon low windage 4) Non-flaperon high windage. Is that right?
Could you also clarify the terminology. Does the % in current + x% refer to the current? And the y nm/day refer to leeway? Why should windage and/or stokes be expressed in relation to OSC rather than wind vector? Why would leeway be a fixed speed rather than wind dependent? I suppose I must be misunderstanding something because this doesn’t seem to make sense if you have a real time wind integrated with the drift trajectory modelling.
@Richard. “It would be interesting to see what leeway each MH370 item exhibits.” It would indeed! This assumption is rather critical to the drift modelling undertaking and inferences derived from it.
I wasn’t aware that Roy and No.7 Flap Fairing 676EB had also been sea trialled. Could you please point me to that reference?
ps: I was very interested to see that a person in the water, even without a lifejacket, has quite appreciable leeway according to various sources cited by Allen & Plourde. I think this illustrates how counter-intuitive the actual drift behaviour can be.
@paul smithson
We spent 3 months discussing the approach, general method and data with David Griffin earlier this year and exchanged about 150 emails in the process. We have now spent a further 6 months analysing that data and discussing the results. We have exchanged 979 emails in the last 6 months. I am in the process of writing up the paper.
We use the 86,400 Flaperon trials only for the Flaperon and the 86,400 Generic trials for all other debris items. We have analysed all debris items from all crash latitudes and have found that the generic data produces consistent results. Each data set is 86,400 trials x 1,030 days = 88.992M positions or trial-days, where each position is defined by a latitude, longitude and time, from which speed and direction can be derived.
The Flaperon windage is different from the generic debris windage. The Flaperon did not sit flat in the water and flipped over often having two unstable positions. The majority of other debris items are light weight flat panels.
You will have to ask David Griffin why he chose the nomenclature for the windage files, but we do not use those data. I understand current + 1.2% means the actual current multiplied by 1.012 and additional leeway means the Stoke’s drift with the uplift of 10 cm/s or 4.8 nm/day.
The sea trials with non-Flaperon items are to be found in the CSIRO publication entitled “The search for MH370 and ocean surface drift” part 1 dated 8th December 2016 section 2.3: “We also constructed replicas of the piece of engine cowling ‘Roy’ (Fig. 2.3.3) and the fairing. As with the flaperon, care was taken to ensure that the waterline and shape of both were as realistic as possible.” Take a look at the Fig. 2.3.3 also.
The last piece of debris found was in June 2016, now more than 4 years ago.
Why is it that none other have been found washed up on some shore since then. Do those found share some common unique characteristic which renders them more buoyant. Nevertheless I would consider this observation may have significance so far as drift analysis is concerned.
Has there been any drift analysis on other objects found at the respective locations of the MH370 debris discoveries to confirm their points of origins and thereby confirm the reliability of the modelling.
@Richard: I believe current + 1.2% means the current plus 1.2% of the wind to account for Stoke’s drift.
@Victor
Many thanks for the correction! It has been too long since I last looked at the CSIRO windage model.
The velocity of a drifting debris item through the water depends on the velocity of the water (surface current and near surface current to the depth of the submerged debris item) plus the leeway (windage depending on the wind speed/direction and how deeply submerged the debris item is in the water and how much area is exposed to the wind) plus wave forces (Stoke’s drift due to the action of waves on the debris item).
CSIRO found that the typical MH370 floating debris drifted in a similar manner as an undrogued drifter.
CSIRO also found that the typical MH370 floating debris drifted due to the current and Stoke’s drift and, with the exception of the Flaperon, there was little effect of windage. This is different to the Search And Rescue (SAR) leeway or windage data for boats, surf boards, life rafts, people in the water, etc. CSIRO make the point that the SAR data does not include leeway or windage data for aircraft debris items.
The CSIRO nomenclature is in the format: current + u.u% wind @v + rw x.x nm/day (or cm/s) @y deg
where
current is the velocity of the current in the top layer of water near the surface,
u.u is the percent of wind velocity,
v is the wind height above the surface (metres),
x.x is the relative windage velocity or uplift compared to an undrogued drifter in nautical miles per day or centimetres per second,
y is the drift angle in degrees left of wind.
@richard. Another reference that will be of interest, demonstrating empirically the scale and deflection angle of wind and wave-driven effects at the uppermost surface layers. For the uppermost 5cms, he finds 3.6%-6% of windspeed and deflection 5-55 degrees to the right (deflection angle / ekman transport is hemisphere dependent). Scale and deflection angle changes rapidly with depth. Although this study focuses on high wind events in a particular locality, it includes useful overview of related literature on this topic.
https://os.copernicus.org/articles/15/1627/2019/os-15-1627-2019-t01.png and full article https://os.copernicus.org/articles/15/1627/2019/
@Tony
You stated: “The last piece of debris found was in June 2016, now more than 4 years ago.”
This is not true. The most recent item of debris was found by local fisherman on Riake Beach, Madagascar at the end of August 2018. It had probably been buried in sand and washed in and out for a while. It looks like a piece of a cabin divider panel and similar in size and material to several other finds of cabin interior items.
https://www.dropbox.com/s/py3dw91zankqye8/Blaine%20and%20local%20fisherman%20August%202018.jpg?dl=0
You asked: “Do those found share some common unique characteristic which renders them more buoyant.”
The honeycomb structure which traps air, as long as it is not damaged.
You asked: “Has there been any drift analysis on other objects found at the respective locations of the MH370 debris discoveries to confirm their points of origins and thereby confirm the reliability of the modelling.”
That is the whole purpose of the upcoming study on the drift analysis, which is currently focused on 34 floating debris items that are confirmed or highly likely to be from MH370.
Here is a link to a list of the finds so far:
https://www.dropbox.com/s/bgldtg3z7dh9bkd/Debris%20Observed%20Reports%20Overview.png?dl=0
@Richard. Thanks very much indeed for the clarification on nomenclature.
“The CSIRO nomenclature is in the format: current + u.u% wind @v + rw x.x nm/day (or cm/s) @y deg”
From this I understand that the underlying model is:
* Ocean surface current (from the models) – which pertains to OSC in the top ~20m depth
* Add % of wind [surface winds typically being measured at 10m height] to account for stokes drift contribution. Your description relayed above that this % is applied to wind vector, not simply OSC vector + % of wind speed.
* Add leeway as a fixed average distance per day in direction y degrees offset from prevailing wind. Though if local wind conditions are integral to the model I can’t understand why a fixed average would be used and it also makes me wonder how the deviation from wind angle was applied.
* For everything except the flaperon, your analysis was based on trajectories generated by the “generic” model, which is
“based on a current + 1.2%, 10 cm/s (4.665 nm/day) additional leeway and drift angle 0° left of wind.”
Have I understood correctly? I’ll also go back to read CSIRO relevant Volumes to check their description of how the wind vector is applied for the stokes component and the leeway component.
@paul smithson
You have understood correctly.
@Richard. Having gone back and re-read closely CSIRO The search for MH370 and ocean surface drift 08.12.2016, and Part II 13.04.17, I arrive at a different interpretation of the CSIRO models, as follows:
Generic/non-flaperon. Modelled at ocean surface current at 5m depth aka “V5” plus 1.2% of wind vector, which resembles drift behaviour of undrogued drifters.
The Flaperon model has an additional leeway (Vl and Vw per theoretical formulation) on account of its freeboard. This was modelled at fixed 10cm/s constant because this component was found to be non-linear w.r.t. windspeed and the flipping behaviour in higher winds. In Part 1, the direction of this “extra leeway” was assumed to be downwind. In Vol2 a divergence direction mean 16 degrees left of wind was obtained empirically and the models show results with 10 deg. left and 20 deg. left assumptions.
The High Windage model (as described in Vol.2) is applied to non-flaperon/generic model as V5+3% of wind vector with no additional leeway factor. I didn’t see any 10cm/s or 4.7NM per day mentioned.
It is also clear that underlying assumptions on the magnitude and directional offset effects of wind have a fundamental effect on the trajectories.
The Lodise paper that I shared earlier sheds light on the complexity of the wind effects, being dependent on buoyancy/draft, where in the world you are (sign on directional offset) and sea state. Higher winds generating waves paradoxically partially shelter the item from direct wind effect and cause vertical mixing that slows down the speed of the surface flim. To me the critical point to note is the gradient of wind effect with fine-scale depth. Essentially the top few cms of sea surface are subject to greater wind influence than lower depths [even something as shallow as an undrogued GDP drifter with ~20cms draft]. A highly buoyant object does not need to project above the surface to experience these effects, though if it does, you will add significant “direct leeway effect” on top. Additionally, quite significant directional offset to wind is the default, not the exception – and this is also complicated by preceding sea conditions and a time lag.
The take home – in my opinion – from all of this is that the trajectory modelling (and therefore inferences drawn from those results) is very much less deterministic than you have implied.
@TBill. “I am trying to understand how far away from Arc7 the crash site could possibly be, pending some fuel analysis. I am thinking in max fuel efficiency mode, it could possibly be quite far away from Arc7 along Broken Ridge.”
A pilot intending to arrive at any particular area would allow fuel for uncertainties. The chances would be high then that if aiming for Broken Ridge he would have arrived with fuel remaining.
But put that aside for the moment.
Fuel exhaustion will be at the 7th arc unless the pilot shut down the engine(s) while still running and then manually started the APU (the SDU thence being cycled), thereby saving fuel for a relight. Or else he cycled power and inadvertently the SDU, engines running. In all 3 instances the SDU would have been rebooted in a dive at the 7th arc.
In the two cases of no fuel exhaustion at the 7th arc, lack of another reboot and log-on at final fuel exhaustion can be explained, in the fuel-saving instance, by there being no further cycling of the SDU, supposing the APU ran to its fuel exhaustion. In the power-cycled case, a crash before the SDU was rebooted would be the explanation.
However since there was no IFE set-up after this final log-on, it is unlikely that the aircraft would have flown on far from the 7th arc. Had it, in the fuel-saving instance, the APU running on a normal pressurised left tank supply should have led to that connection.
In the other, the power cycling, the crash before IFE set-up would limit that distance.
Returning now to the second paragraph above, excess fuel on arrival at Broken Ridge would have been burnt before the 7th arc transmissions (while still there), not after.
Then as to a glide immediately after fuel exhaustion at the 7th arc, the quantity of residual fuel should have been enough for IFE connection. However a long glide without that could result from APU fuel starvation due to vapour lock, its fuel supply then quite likely being unpressurised, the vapour lock arising from the ‘g’ of recovery from the dive.
That explanation for lack of IFE connection could apply of course to all glides, not just at Broken Ridge.
‘Richar
re: lack of recent “new” debris landings
I recall reading recently in an article on plastic refuse in the oceans that a great deal of the floating plastic is sunk due to the growth of organisms on the surfaces.
@Richard mentioned that the recovered debris are pieces having a honeycomb structure, which would be more buoyant than solid plastic or fabric. This would selectively favor the honeycomb structures for long term drift.
@paul smithson
You stated: “The take home – in my opinion – from all of this is that the trajectory modelling (and therefore inferences drawn from those results) is very much less deterministic than you have implied.”
I sort of agree! But then I don’t agree! The drift analysis is not easy.
Please bear with me. In our upcoming paper we first present our initial findings.
At the end of that section, you will find the statement “It is obvious from the initial findings, that a more rigorous method is required to determine the MH370 crash latitude with a greater discrimination between crash latitude bins, that nevertheless provides statistically significant results, without introducing any crash latitude bias. In the next section, we describe such a method. ”
We are on the ball, the trajectory of the ball is complex and worse than a curve ball, but we have got it sorted.
The take home – in my opinion – from all of this is that the trajectory modelling (and therefore inferences drawn from those results) is much more deterministic than you think.
@Richard.
Just to give a rough idea of how much the results might change dependent on wind effect assumptions:
Per generic model
If you have a ballpark OSC mean of 0.15m/s and a mean windspeed of 12kt
OSC travels 7NM per day
If you have a wind effect of 1.2% of windspeed, you get additional 3.5NM of travel, this time in direction of wind.
But the references I have cited above show that the wind effects could easily be 3%-6% of wind. Even at the lower end, your wind vector is slightly larger than your OSC vector. At the upper end, your wind vector three times your OSC vector.
The generic model assumes a wind vector dead downwind. Lodise et al, cited above, show empirically that this is very unlikely to be true.
The potential size of the wind-driven vector in relation to OSC component and the likelihood that it is significantly offset from downwind means that trajectory modelling will be extremely sensitive to those assumptions.
You may find that the Griffin particle trajectory models behave in a deterministic fashion. But the model will only do so if you are very sure of your assumptions on wind-driven effects. I contest that in light of Lodise’s summary of “very-near-surface” effects, you cannot possibly assert these with any confidence, even within quite a large range (both speed as a % of wind and direction relative to wind).
@Sid wrote “the recovered debris are pieces having a honeycomb structure, which would be more buoyant than solid plastic or fabric.”
The structure and panel fragments originally manufactured as polymer skins + honeycomb sandwich use aramid paper as the core material. The aramid paper is, typically, treated with phenolic resin. Water resistance afforded by the phenolic resin will be overcome in time and any damage that exposes the aramid paper honeycomb will accelerate the ingress of water. At some point, waterlogging will cause the pieces to sink.
@paul smithson
There is another dimension to the drift analysis, which is reporting delay.
The reporting delay ranges from very small for a frequented accessible beach in an area of heightened awareness where a fully barnacled debris item was found to very large for an isolated inaccessible beach in an area of little or no awareness where a debris item clean of barnacles was found.
There are 34 debris items from 27 locations being reported at a wide ranges of times.
We know that the debris item arrived before it was reported.
Finding the most likely crash latitude that fits all locations and all reporting times is determinable.
@paul smithson
You stated: “I contest that in light of Lodise’s summary of “very-near-surface” effects, you cannot possibly assert these with any confidence, even within quite a large range (both speed as a % of wind and direction relative to wind).”
Your argument is with David Griffin, a world renowned oceanographer, assigned by ATSB and CSIRO officially to the search for MH370, whose advice we have taken and followed. He comes to a different conclusion than you.
All I can say is, that we have looked at the numbers in great detail for all debris items locations and timings and they align with the CSIRO data. I do not believe this alignment is an accident for 27 locations and timings of debris reports versus a single location and timing of a crash latitude.
Hi,
From Air China flight 006 (https://en.wikipedia.org/wiki/China_Airlines_Flight_006) we know that it is possible a plane looses some big parts from “abnormal flying” (the 747 came down 30000 feet in ~ 2min 30sec) and flies farther.
For MH-370 the BFOs mean a rapid descent but if (ok, a big if) the plane was piloted and the pilot regained control, there could have been two debris fields: one with big parts lost from the plane in flight and, later, somewhere else, perhaps miles away, the definitive high speed crash with thousand of small parts?
Is it possible to dispatch the parts in two categories and have the drift study supposing each came from a different place?
PL
@David
Yes I am envisioning possible active pilot at end, actively managing the fuel supply and SATCOM/IFE (Left Bus) connection.
If pilot was active, and we are “lucky”, fuel was indeed gone at Arc7 and pilot intended to crash dive at Arc7. This was suggested by William Langewiesche as one possible explanation.
If we are less lucky, the fuel was gone but the active pilot conducted an unpowered glide. If we are further unlucky, the active pilot presumably could have been intentionally conserving fuel for a even longer “powered” glide after Arc7.
@Richard. The room for material error in these critical assumptions is illustrated by the differences found between the behaviour of the replica flaperon (original/Part 1 report) and the actual cut-down flaperon (Part 2).
There are also important implicit assumptions regarding a) the “stickiness” of coastlines b) likelihood of beached items being found, recognised and reported.
The stickiness assumption, in particular, is subject to considerable uncertainty – as Griffin acknowledges (but you, apparently, do not). A current that appears to be converging on a coast does not “run into it”, it is influenced by fine-scale coastal topography – as you know all too well as a sailor. Additionally, would the probability of beaching alter depending on whether wind was onshore or offshore? Or whether it was spring tides or not? The model appears to assume that a particle last seen riding a current towards a coastline must beach on that coastline.
My issue is with the certainty that you appear to apply to assumptions – implicit and explicit – in the modelling exercise.
@paul smithson
Please do not assume because I have not mentioned something, that I am ignoring it.
The coastline at each debris location has been examined in detail.
@TBill: The logon request, the BTO, the BFO, the retracted flaps damage, and the lack of IFE logon all point to fuel exhaustion ending in a steep descent and impact with no pilot inputs. Now, a pilot could have been manipulating inputs to make it appear this was occurring when it was not, and we can’t dismiss this case. However, isn’t it more likely that there were no pilot inputs?
@VictorI
I might be persuaded by all of your statements except “with no pilot inputs”. Since we do have empirical evidence that modern planes can survive high speed descents, options could include (as suggested by @paul smithson) an idle descent prior to fuel exhaustion, glide recovery from steep descent etc. if pilot input was considered.
This complicates the end-game scenario considerably, but does not mean that excluding these modalities is indicated.
@Sid Bennett: What I said was the pilot input scenario at the end-of-flight seems unlikely, but we cannot dismiss it.
I’ve said before that the dive-glide-dive scenario is unlikely (but possible). You and @paul smithson are now proposing a glide-dive-glide-dive scenario, which is even seems to me even more unlikely.
If there was a live pilot at the end, (assuming everyone else had been killed earlier by depressurization) there are many possibilities.
There would have been no need for the pilot to remain on the flight deck.
The long flight south would have required the need for refreshments from the galley, a stretch of legs occasionally, and a toilet break or two.
What if he had not found what sweets he wanted in the forward galley, and had gone to the aft galley ? What if he had sat down to “have a much on something”, and “nodded off” ?
Even if he was on the flight deck, it is still possible, and plausible, that he could have “nodded off”. It used to happen in regular airline operations not infrequently, yes ?
It is therefore plausible, that the pilot may not have even been on the flight deck, at the moment of right engine fuel exhaustion, and even if he was, but asleep, the autopilot would maintain trim, and he probably would not have woken up from a deep sleep with just the gongs.
But when the left engine flamed out, that all changed.
The aircraft would enter a spiral dive, which would shake him up, and wake him up.
Wherever he was, he would wake up, and begin recovery as soon as he could.
The China Air 747SP incident referenced above clearly was a departure from controlled flight, with a 67 degree pitch down, a full roll, a mid event descent rate which reached 20,000 ft/min, and it was successfully recovered by the flight crew, below 10,000 feet, having shed a few bits and pieces in the +5g pull-out. It was then climbed and diverted to a safe landing.
It is notable that the crew had become totally disoriented, and a considerable time elapsed, about two minutes, before they broke out of clouds, and could see the ocean, before they got their act together, and recovered.
If it had have been transmitting during that event, we would have similar data as the seventh arc descent rate BFO’s.
In the case of 9M-MRO, since it now seems not only plausible, but probable, that the flaperon may have separated at height due to flutter, I contend that the continued use of the “final dive” idea as being somehow definitive, is clearly not supported by the known facts of China Air 747SP event, and is only being continually pushed by some as a means to justify a “high speed disintegrating impact” to the exclusion of any other ending, particularly a ditching, or at least an attempted ditching anyway.
Hi victor. I’m not sure where you get the idea that I fancy a dive-recover-dive. I don’t, and I believe the plane will be found very close to the 7th arc. It’s one major reason I favour segments of the arc that haven’t been searched.
@paul smithson: Thanks for correcting me. I should not have ascribed the glide-dive-glide-dive scenario that @Sid Bennett suggested to you. You only suggested the first glide-dive.
@TBill. In planning for a crash at a particular spot a principal aim of his surely would be for the intended crash not to be detected.
The best way to reduce that risk would be to minimise;
• crash noise, if he could not be sure there would be no fishing vessel within earshot and allowing that seas and wind might prove calm,
• visual evidence (ie do it at night, lighting off) and,
• wreckage (avoid massive break up but ensure the aircraft sinks).
The best tactics to realise that would be to shut engines down and ditch, flapless, like the Ethiopian 767 did at the Comoros Islands in 1996, except at night and remotely; and quite possibly without regard to direction.
If so, that would rule out a deliberate and planned crash in daylight.
If not so, as I put earlier, at Broken Ridge I do not think there would have been powered flight after the 7th arc transmissions.
As for a deliberate glide to some other place, why would he not have aimed for that in the first place?
Conjecturing, even in daylight his plan might have been to shut engines down when short of the chosen site, any reserve fuel remaining; start the APU for control; dive steeply (possibly with airbrakes to minimise descent visual time); then recover and ditch flapless when at the planned site.
More generally I note the above detection risk minimisation could be inconsistent also with a plan to commit suicide en route. That would leave a totally uncontrolled crash to result, with the possibility also, were bleed air selected off, that cold equipment unmonitored would affect with the aircraft’s subsequent route.
@Victor. You posed the question about the final descent, “However, isn’t it more likely that there were no pilot inputs?”
Yes, the problem being the quantification. What intrigued me about the Pattiaratchi conclusion was, to quote Geoffrey Thomas, “He says the next search should go wider from the seventh arc than the 50 miles on either side previously completed.”
I asked myself whether his drift analysis alone quantifies that, with confidence. Perhaps your drift study will help. But I will see if I can get a question to him about how his analysis led to that conclusion.
@Victor. Disambiguation. First line second last paragraph add please so that the first sentence it reads, “Yes, the problem being the quantification of that likelihood”.
Had the ‘Right Forward Nose Landing Gear Door’, found on Antsiraka beach, Madagascar, 12th June 2016, been the first recovered item of debris would we be debating that the landing gear was extended?
Had the ‘Door R1 Stowage Closet panel’, found at Rodrigues, Mauritius, 30th March 2016, been the first recovered item of debris would we be debating that a ditching had been effected and the door slides deployed?
Had the ‘Seat Back Trim Panel encasing IFE Monitor’, found on Nosy Boraha Island, Madagascar, 6th June 2016, been the first recovered item of debris would we be debating that there was an attempt to cast off unnecessary weight in a vain attempt to increase endurance?
Had the ‘Right Vertical Stabilizer Panel’, found on Ling Linga Beach, Mozambique, 18th July 2016, been the first recovered item of debris would we be debating that the aircraft impacted the ocean in an inverted attitude?
@VictorI
” glide-dive-glide-dive” is not what I thought I suggested. I was merely restating the idle-descent concept that I believe was offered by @paul smithson to rationalize the fuel deficiency associated with his proposed route. The route is otherwise satisfactory. The flight would have incorporated a idle descent as fuel became short with fuel exhaustion occurring in both engines at about the same time. (I assumed there would be no automatic rudder offset since there would be little unbalanced thrust). The addition of a dive-glide at fuel exhaustion is an option.
Which leads to @Don Thompson pointing out that we tend to grab on the latest new fact and postulate a possible cause. So, the first hypothesis tends to obscure alternatives. All of the debris would have been created within a 15 minute interval, regardless of the scenario.
For purposes of discussion, I could accept that @paul smithson has a good scenario, needing only a idle descent to fit all of the publicly available facts. (Richard…I appreciate the effort you are making to re-analyze the drift data, and am admittedly impatient, but the on-line discussion goes on…)
@Victor
Collecting my thoughts, but I tend to discount IFE for a variety of reasons. The BTO/BFO can be interpreted to support active pilot because we do not have a good way to explain a relatively sharp descent happening at that time without pilot inputs. If the pilot was messing around with elec configs and fuel, he could have accidentally or on purpose toggled Left Bus power at Arc7.
That leaves me with Flaperon/flap damage as the key question. If the flaperon trailing edge is in fact flutter/air damage, what altitude must MH370 have been flying? I am thinking quite high altitude dive, so that puts the crash on Arc7, with minimal glide. Most of my active pilot scenarios involve descent/slow down after Arc5, accounting for Arc6 timing.
High altitude dive would tend to make active pilot gliding beyond Arc7 hard to explain, although anything is possible (climbing to prepare for a dive) with active pilot.
@BillT said: …we do not have a good way to explain a relatively sharp descent happening at that time without pilot inputs.
In the Boeing simulations, there were certainly descent rates comparable to what the BFO suggests. What the simulations did not demonstrate was the downward acceleration of 0.7g at 2 minutes after fuel exhaustion. So either there was forward pressure on the yoke, or the Boeing simulations did not accurately capture system interactions at shutdown, or perhaps there was a speed-induced mechanical failure.
And of course, Boeing never considered the autopilot was off(secondary mode) when the right engine flamed out. That scenario, with the left engine still running would definitely induce a right-hand/ high ROD, structurally damaging spiral dive.
@Tim
If I understand your above scenario, the experts do not believe the aircraft can fly much distance without A/P (except with active pilot). So I believe we stuck with a spontaneous passive dive which is not totally explained by simulator studies to date.
Victor approximated in the PMDG model by pre-setting a bank, and I believe the UGIA report above suggests possibility passive pilot fell onto the steering column at that time. Which is an interesting idea, but one way to look at it, the passive case has the issue of explaining why the BFO went into a perhaps questionable spontaneous dive.
@TBill
The BFO shows that at 00:19:37 UTC there was an accelerating dive in progress. It is theoretically possible, if there was an active pilot, that there was a recovery from a deep dive.
If there was no active pilot, there was no recovery.
Other evidence, such as the average weight of 33 MH370 floating debris items at 4.8 kg indicate a break up of the aircraft in the order of magnitude of 36,000 parts, if the 33 items are typical of the disintegration of an aircraft with a ZFW of 174,369 kg. Furthermore, the debris comprise both interior and exterior parts, which implies the aircraft
broke up on impact. There were items found from every part of the aircraft, nose, tail, wings,
engines and cabin.
The other evidence leads to the conclusion that this was an uncontrolled impact and there was no active pilot.
@Richard @Victor @DrB
I am taking renewed interest in your report, re: fuel consumption.
Question- for the Simple FMT case (no descent before 1941) why would the Arc7 end point move over to 32.2 South? Are there any more details available on that case such as flight mode (LNAV etc)?
The debris evidence combined with the BFO studies suggest no in flight break up. The more likely scenario would be separation of control surfaces and outboard wing sections and parts of the emppenage in the event of excessive aerodynamic loads. The fuselage would have remained intact prior to impact with the surface of the water.
On the question of whether the aircraft was under the command of a pilot, is it possible to establish this from BFO only. Had there been any attempt to recover from a steep dive how would this be supported by the BFO analysis. Would it not be a requisite that such a dive would need to be sustained for a period of time sufficient to build up speeds well over VNE to generate the sort of aerodynamic loads for an in flight break up.
There are virtually endless scenarios for MH370’s End of Flight (EOF) although it seems that some are more probable than others. Several EOF scenarios have been presented and analyzed by contributors. The link below provides a graphic review of twelve (12) scenarios discussed on Victor’s blog. The three categories are:
– (1) Mike Exner’s (2014) Level D Right Engine First Scenario
– (1) Victor Iannello’s (2017) simulation of Banked Descent and No Pilot
https://mh370.radiantphysics.com/2017/06/04/mh370-end-of-flight-with-banked-descent-and-no-pilot/
– (10) Boeing (2018) simulations based ATSB conditions as obtained by Victor Iannello
https://mh370.radiantphysics.com/2018/08/19/end-of-flight-simulations-of-mh370/
Various levels of % Overspeed as well as at what Altitude can be observed. The flight envelope is not exceeded in some cases, some cases slightly, and some have very high excursions beyond the B-777 safe flight envelope. No attention to transonic or supersonic physics were tackled in this graphical exercise. The aim is to provide context on MH370’s opportunities to experience EOF conditions that exceed the safe flight envelope.
Clearly this small sampling of high altitude EOF scenarios presents opportunities for creating flutter conditions, shedding of components and even massive structural failure.
MH370 EOF Scenarios vs B777-200ER Safe Flight Envelope (Rev F)
My attempt at a link did not work.
https://www.dropbox.com/s/wupe9q15yp0xnor/MH370%20EOF%20Scenarios%20vs%20B777-200ER%20Safe%20Flight%20Envelope%20%28Rev%20F%29.pdf?dl=0
@Kenyon: Thank you for assembling all that data. What did you use for the flight envelope curve?
If we take a step back and look at the final BFO values, the plane was in a steep, accelerating descent, independent of what system interactions or failures put the plane in this attitude. Certainly, this would have led an an overspeed condition. Without pilot intervention, the plane would have crashed within a relatively short distance.
@Kenyon @Victor
Those are beautiful graphics.
Although all cases start from high altitude, some of the cases slow down at FL150 to FL200 and then go back into dive. That would seem to imply flutter conditions could be seen in a dive from FL200-ish. But action item would be to try that in PMDG sim.
Another possibility comes to mind: if the SATCOM came back online mid-descent during one of those speed “switchbacks” (eg; Case 4), maybe that is better match to the data? To date I think we have been assuming the BFO data is from Top of Descent, with some inference that we do not know exactly how that could spontaneously develop in that manner.
@Victor, the following was used for graphic representation of safe flight envelope:
https://www.dropbox.com/s/otpj2in4qo5jnhq/Pressure%20Altitude%20vs%20Mach%20B777-200ER%20Envelope%20Reference.pdf?dl=0
The data generated for your flight simulation was obtained by viewing video so it’s not perfect but hopefully representative.
@All, These charts were meant to be representative not precise. If someone has alternate data I could re-run and update charts. But it’s an iterative process and takes some time, not sure it would make a big difference…
@all
A bit slow around the site, but I am sure you are all still engaged. For my part I have just completed a very detailed review of the UGIB latest report. I can find no flaws in the analytics or assumptions. To me that leaves only three possiblities to which I have assigned “weights” below.
1> The wreckage was missed by the underwater search – 20%
2> The wreckage is farther from 7th arc than assumed – 20%
3> The satellite data or our interpetation is flawed – 60%
@DennisW
“Doppler spread is caused by the relative motion of the propagation path between
the transmitter and the receiver. In land mobile communications, the vehicle motion is
the source for this phenomenon. The Doppler spread is approximately given as (in Hz”
In the case of Mh370 I’m assuming that the Transmitter is Perth LES & the Receiver Mh370. As far as I understand it the BFO changes have been based on the transmitter being I3F1. But that’s not where the signal originates from. Or even Vice Versa. The Transmitter is Mh370 & the Receiver Perth LES. Is this the or not?
@DennisW: Any thoughts about (3)? Or does it fall in the category of “we don’t know what we don’t know”?
@Victor,
My personal bias is toward a large error in BFO bias, and then the “we don’t know what we don’t know”. The flights with ACARS checking are pretty compelling evidence that we are doing things correctly.
@Michael
I think we (you) have the transmitter and receiver identified correctly. The Doppler calculations are pretty trivial based on satellite and aircraft motion. The only unknown is the drift in the AES (aircraft) reference frequency.
@DennisW,
Your assumptions may not be flawed, but are restricted to an unpiloted straight flight path after Malacca Strait. If the sat data is correct, then case 2 being farther from the arc requiring a glide is in conflict with that basic assumption of an unpiloted plane.
If you are going to assign probabilities to search scenarios, then please also include the Java Anomaly site directly on the 7th Arc as pinpointed by hydrophones and seismometers. It’s compatible with the sat pings and flyable. The area was never searched by satellite, aerial, surface, or underwater methods.
Even if many have dismissed the Java noise evidence because it came 55 min late as the plane would have been sinking, there is also good acoustic evidence for a flyby at Christmas Island at approximately the correct time between the 3rd and 4th pings. That would still leave a wide range of possibilities, but it is certainly compatible with a pilot considering diversion airports (starting with Khota Bahru which was closed).
@All,
It occurs to me that a skilled pilot could extend the fuel endurance of the plane by flying at lower speed just above the ocean surface utilizing “ground effect”. That might happen after the 7th arc with any remaining fuel, or over path with turns like mine where the plane was below 350 kt most of the time. I’m not saying that was even necessary for my candidate or others, but it might be a way to nearly double the fuel efficiency and enable other scenarios. My apologies if I’ve missed that discussion.
@DennisW
So essentially if Perth LES is the Transmitter & Mh370 is the Receiver then the further away the aircraft is the higher the frequency. Doppler Fade is measured in Hz. When we look at the BFO or Doppler Data for Mh370 the Frequency does Increase & Decrease. We see the HZ as being Positive. But if they are Negative then the Data makes more sense.
From take Off the Hz is for arguments sake ÷80 this decreases to -160 as the aircraft moves away from Perth LES. Then effectively carries on decreasing to -276 before the turn back in the SCS. The BFO Hz then turn positive as the aircraft turns back towards Perth LES increasing to 148 then 102. Before the HZ decreases again to just over 250 Hz which would show the aircraft moving away from Perth LES.
Here is an interesting observation. So 0Hz is KLA. The 1st Hz reading is in my theory -90 so if we measure 90 miles from KLA along the Known flight path. Mark the position. The next position is a further 60 miles on. Again mark it. Move further out so you are 276 miles from KLA. Mark it. This is the exact position of the turn back in the SCS & is also the Hz Frequency of the Doppler.
So has anyone actually considered that the HZ of the Doppler decreases every mile Mh370 moved away from KLA? I would ask people to try the Theory before dismissing it.
@Michael Blades
The propogation path for the AES-GES signal bursts is AES -> I3F3 -> GES. Distance in that propagation path relates to Timing Offset of the Burst (BTO).
The difference of the measured frequency of an AES originated signal burst, measured at the GES, and the nominal carrier frequency is due to the velocity between the AES and the satellite. The Burst Frequency Offset.
In both cases inherent biases and offsets in the system can be, and have been, calculated.
Anything that might be derived from a direct vector between the AES and any point on the earth is irrelevant.
@Michael Blades: Not only does the BFO include the Doppler shift of the aircraft to satellite link and the satellite to ground earth station (GES) link, it also includes the pre-compensation provided by aircraft’s SDU and the post-compensation provided by the pilot receiver of the GES. You are over-simplifying a problem that has been well-studied and understood by many of us.
@370Location: Ground effect becomes significant when the height above the ground is less than one wing span. With no fuel, it can be used to reduce the airspeed and vertical speed at the point of contact with the water. It will not increase the glide distance in any significant way.
@Michael Blades,
BFO is unrelated to distance from KLA. As Victor said, the plane pre-compensated for doppler effects relative to the satellite, except that it did not take into account satellite motion or climb rate. The plane knew its position, heading, speed, and attitude, or it would have not been able to steer the high gain antennas correctly. Odd, I thought I saw a longer treatise on BFO with swapped transmitter on Facebook VeritasMH370 just a couple of days ago, but the post is gone.
@VictorI,
I wrote, “with any remaining fuel” on the assumption that ground effect flight could only be carried out for any length of time under power. I agree that “with no fuel”, any ground effect in a controlled glide would just be the flare at the end of flight. Ground effect does have the curious feature of increasing lift but not drag. A recent performance chart posted here showed that a B777 might fly over mach 0.5 at very low altitude.
@370Location: If the B777 was flown near the water surface under power, that means it would be flown for less time at a fuel efficient cruise altitude. I don’t see how this would increase the range.
@DennisW
Thank you for your comments and Seasons Greetings.
I would say 2 +3.
I am lately convinced the data (sat, debris, sim studies) points to an intentional active pilot flight to Broken Ridge, and if flying along BR was the pilot’s whole fuel savings strategy, and if our assumptions are wrong (about the meaning of Arc7) I can see possibly 250-300 nm more flight distance after Arc7.
Not saying definite, but I am thinking this getting to be the obvious, serious active pilot case. Blaine and Dr Chari feeling 32 South crossing and Dr Chari reportedly says we need to go 50 nm beyond Arc7 on BR…enough? Needed is detailed analysis to rule out this one obvious (from the data) active pilot scenario.
DrB’s prior 2018 flight path pin was 31.5 South at Arc7. Unless I am mistaken, that does not include certain fuel saving steps (notably reduction of bleed air). I am thinking more to save fuel could possibly be done if fuel savings was the whole strategy, such as turning off a generator or two.
PS-
Distance ISBIX to 34S at Arc7 = 2077nm
Distance ISBIX to Dordrecht Hole way off Arc7 = 2067nm
@TBill
Likewsie, seasons greetings to you.
I find it difficult to see why the PIC would have a great interest in saving fuel. The wreckage would not be significantly more difficult to find 100nm or 200nm further South. Also if the motivation was to complicate the search, the most obvious tactic would be to fly further from the West coast of Australia, the staging area for any search of that region.
To all,
Best wishes for a safe Holiday Season and a much better New Year….
Just to echo Sid’s sentiments, Season’s greetings to all and best wishes for 2021.
And thank you again to Victor for his efforts in hosting this site and facilitating the ongoing discourse.
Yes, it is a great place to visit. Lots of really bright people, with exceptional talent. Thank you, Victor.
@Victor
Thank you for running the site and being one of the most knowledgeable and open-minded experts on MH370. I started following MH370 because I got inspired by Blaine finding the NO STEP piece. But at the time, you and Richard (and Dennis) were the only ones thinking a little like me, and that was also most appreciated.
Echoing Dennis, it is an honor working with all of the contributors on this site, to try to solve the MH370 crash location technical problem.
Merry Christmas, all!
Thanks all for the kind words. Peace, Happiness, Health, and a Merry Christmas to all.
Happy Holidays to all, and may 2021 bring us all some relief from 2020—the worst year I can remember!
A Merry Christmas to everyone, as best you can in a pandemic and a Happy New Year, which has got to be better than 2020.
Merry Christmas to all, have a blessed time with your family and friends.
Wish everyone a safe and rewarding new year!
Thanks @All for your many insights and expertise.
Wishing everyone the happiest possible holidays!
Merry Christmas to all. 2020 will go down as the year to forget. Always look ahead to better times.
SSL Certificate Issues
Network Solutions, the issuer of SSL certificates for this site, is having problems delivering certificates for both the domain name (radiantphysics.com) and the subdomain name (mh370.radiantphysics.com), despite the fact that I have purchased certificates for both sites, and despite the fact that the both sites were properly configured in July 2020. As we (again) work through the issues, the certificates for one or both sites may be interrupted.
I opted to used Network Solutions out of convenience. For those interested in creating a secure website, there are other options for host and certificate servers that are less expensive and have much better customer service.
I appreciate your patience as these issues are resolved.
@Victor
Re: MH370 Home Flt Sims
As an personal action item, I am exploring if ZS used the FS9 addon FSNavigator.
FSNAV was very popular for FS9…and as it turns out, there is nothing quite like it. You get the wheels up, FSNAV does the rest. You get Improved flight map for FS9 and a flight path easy to move aircraft ahead on the path.
I regret not seeing this earlier, but of course Malaysia was suppressing the full sim data, so I did not realize the need we now have to explain how the aircraft icon was moved along on an apparent flight path, that was not showing in FS9.
Enter FSNAV, an extraordinary utility, custom made for FS9 only, that does just exactly that purpose.
@TBill: I haven’t installed FSNav, so I can’t replicate your findings. But, it is certainly possible that an avid simmer like ZS would install an addon like FSNav because the native flight planning capability in FS9 (and FSX) is very poor.
Long ago, I noticed that the sim data points 10N and 45S1 align well with McMurdo Station in Antarctica. A final waypoint in Antarctica is consistent with a route ending at the South Pole, which is what some of us believe was flown.
Good work.
HAPPY NEW YEAR
Hi all, I ran across this news article about these Chinese “Sea Wing” underwater drones that propel themselves simply by sinking or rising in the water column. Supposedly they have a month’s endurance and can dive quite deeply. Perhaps a flotilla of these would be a relatively cheaper way to continue the search.
Happy New Year!
https://www.news.com.au/technology/innovation/military/sinister-catch-exposes-chinas-underwater-spies-on-australias-doorstep/news-story/6e287a838871315584aaa57bbf443514
@Warren Platts: That’s interesting, although unless “soaring” like a glider in an updraft, there has to be a source of power to keep it moving.
@all
Reflecting on the 2020 MH370 forensics, I have to say that the UGIB “Final Resting Place…” report and the Godrey drift analysis have raised the analytical bar substantially.
https://www.mh370search.com/2020/12/23/mh370-debris-drift-analysis/
I am still troubled by the motive for the flight path, but the observables cannot provide any clues.
@DennisW: Unless there is a compelling need, I don’t visit sites that track activities and preferences with cookies, such as the link you provided. If there is relevant technical material that does not require a visit to the site, can you please provide links here?
@victor
I do not have an alternate link.
@Victor. Alternate link for the drift analysis referred by Dennis
https://www.dropbox.com/s/bzpwdjdiyz7yiry/MH370%20Floating%20Debris%20Drift%20Analysis%20-%201st%20January%202021.pdf?dl=0
@Victor
Re: NZPG
One flight sim trivia fact to keep in mind, the older version FS9/PSS777 (MSFS 2004) that Z had used in the simulator cases, cannot go to the South Pole waypoint format.
FS9 has a hard limit of going only as far as 89.3 South.
The newer FSX/PMDG model removes that limitation.
So that meant sometimes I had to use FSX if I am checking the newer IG path work.
The apparent use of NZPG by ZS in FS9 studies might have been based on practical considerations other than actually wanting to fly to that waypoint. Among other useful features, in FS9 it is an easy airport to click on and put on the simulator flight plan using the improved map afforded by the FSNAV utility.
@TBill: That’s interesting information about FS9. So in the sim, the limitations of FS9 prevent the user from selecting the South Pole as a waypoint, and for 9M-MRO, the contents of the navigation database prevent the pilot from selecting McMurdo Station as a waypoint. That might explain the discrepancy in the apparent final waypoints between the simulated route and MH370’s actual route.
@TBill
Re the last few posts, and remembering you used to talk about the fact that the sim Z and you both used, showed the flight path in google earth in a separate window, and you could drag the plane, I was wondering if the simple answer may be that Z simply dragged the plane to the south pole, then simply noted by eyeball where the Great Circle track crossed Broken Ridge, then just simply dragged the plane back to “near there”, thus creating S1/S2.
Plausible ?
I meant Mount Erebus, not the pole.
If you look at it, the track to Erebus is a better match to S1/S2, so he could have been using TE901 as a hint to the total loss of MH370.
TE901 was 28 November 1979. We have previously discussed the presumed planning time frame, it could have started late in 2013, not early 2014, as previously thought.
@Victor
I don’t currently see it as a limitation for ZS, because there are easy work arounds:
NZPG approx = 78S67 waypoint
South Pole approx = 8990S waypoint (for FS9 from sim case at N10 (1090E))
It is interesting to note the FSNAV map, if used by ZS, has all those oceanic waypoints on there, in case users have any trouble remembering the format. I am trying to understand if having an actual airport (NZPG) as destination in FS9 or FSNAV is a necessary or convenience requirement to make the flight path work. That could explain anchoring the sim path at an airport.
@Ventus
No I did not even realize Mt Erebus was near NZPG, despite the fact I am an honorary kiwi having lived in NZ for 5 months (back in the 80’s).
FS9 actually shows 5 destinations or waypoints at NZPG, including the Ice Runway. Victor has previously conceded that within the accuracy, ZS could have chosen one of those other waypoints near NZPG. But if you take the point N10 from the sim studies, and complete the turn south to get a new point N10′, it looks like it points right to NZPG via 45S1.
For the benefit of yourself and other readers, the reason I am re-reviewing the pilot’s sim studies is that we have recent new insights. Indirectly from ATSB, it appears there was not a flight path showing in the FS9 saved files. To me that implies ZS was using the FSNAV utility, which can best be thought of like an integral part/software update of FS9. In hindsight, FSNAV is the best and easiest possible way ZS could have placed the aircraft icon so accurately on the NZPG flight path.
Using FSNAV possibly gives a fresh perspective on the sim studies. Right now, whichever side you are on, there is some consensus that the sim studies clearly appear to represent flight MH150 to Jeddah at approx. 3PM daytime departure (normal time). For those of us believing that it shows an intentional diversion of MH150 to the SIO (which for me is starting to look pretty darn obvious) we have to say 45S1 implies an apparent intent to put the aircraft down in waters below OZ, generally looking at first like a flight heading to Perth, generally towards the Magnetic South Pole, and generally towards NZPG.
We know that MH150 was not actually hijacked, so if there was a clandestine plan, it was adapted instead to MH370. I have long felt BR *might* have been the objective of MH370, which would be along the same basic trajectory. Therefore I have long personally used the utility “Flight Sim Commander (FSC)” for its ability to tie FS9 flights into the Google Earth map to see Broken Ridge. But at the moment, there is no evidence that ZS used a Google Earth utility eg FSC.
So keeping talking, we have 5 main MH370 location theories-
1) Xmas Island Diversion – less supported by sim studies
2) 20 South Vicinity (Ed Baker others) – getting closer, but less supported
3) 34S South Vicinity – Definitely supported by sim studies, especially if you feel the curve towards Perth/NZPG was not a key element of the MH370 plan
4) 38-40 South Vicinity – same as above
5) 28-32 South and Broken Ridge – well supported by sim studies, especially if you feel some intention to curve towards Perth/NZPG was a key element of the MH370 plan
@TBill: If you believe the CSIRO drift calculations are even close to accurate representations of MH370 floating debris, then the analytical methods developed by Bobby Ulich show there is essentially no chance there was a crash along the 7th arc north of 29S latitude. I am jumping ahead a bit, but his formal treatment of the problem is very persuasive. It’s been a year in the making, but Bobby is very dedicated to doing it correctly.
@Victor
Being a believer in physics. I urge you to consider:
1> Discard BFO for anything but path South and rapid descent.
2> BTO is very reliable. The speed of light has not changed in several centuries.
3> 7th arc has not been searched beyond 25S. Continue the search North.
4> Drift analytics are fundamentally unreliable.
@DennisW: Using your observations, why not search to the south of what has been searched? @Paul Smithson is making a case for that, with the assumption that fuel models are less reliable than we believe.
@DennisW
Also we do have not much advocacy for 20-28 South at the moment. EdB has long qualitatively favored the less clouds/cloud line above 20-22 South, but most of us are thinking the aircraft kept flying South.
What I would like to ask you to reflect on, I know we have talked hypothetically about why MH370? I think we need to remove the hypothetical. It was in fact, for those of us willing to go there, apparently MH150 to Jeddah. Doesn’t this help a whole lot with the motive question? and other implications.
@Victor
Yes, I would support a search farther South.
As most here know I am not a scientist though not able to write a white paper. Most will also know I believe Mh370 came down in the NIO for reasons probably well known. What was pointed out to me from the outset is that ISAT Data was a fly in the ointment. So I set out to see if I could convince myself I was wrong. 7 years later & I can confirm that I am now satisfied with what I found out.
1: On Take off from KLA Mh370 was reporting at HZ of 88 instead of the correct 0.
2: After the SDU shut down & rebooted in the SCS this error was omitted.
3: Between the SCS & the Top of the Malacca Strait Mh370 attempted to reconnect with Inmarsat but was only successful at 18.25pm UTC.
4: There is no missing data.
5: The 1941, 2041, 2141 & 2241 unanswered pings were not the aircraft in flight between the NIO & SIO.
6: The last BFO reading was-2. This occurred during the SDU reboot in the SCS prior to the turn back.
I know what I say is hard to believe but my Theory is fact checkable & 100% verifiable. It’s simple math. Follow these simple instructions:
From KLA measure 86 mile South. Then draw a line North. The 1st point is 86. The 2nd is 152 & the final point is 252. All measurements in miles. The 1st is KLA. From the second draw a line West to the SCS. Do the same again with the 3rd. What you are looking at here is those lines are, 2nd position line is the intermediate point. The 3rd line is where Mh370 broadcast the last ACARS message. Whilst I appreciate that BFO isn’t positional I can assure you these lines are accurate indicators.
After the SDU rebooted the BFO calibrated correctly. Thus the start position for measurements is KLA. Again mark a point. Draw a line North. Marking a point at 88,90,111,141,168,204,216,219 & 252 again in miles. You will note a lot of these Markers are quite close together. So all go West but you will need to adjust accordingly. Effectively what they do is mark a path from the SCS down to the Malacca Strait then up the Malacca Strait to the top of Northern Sumatra. Again these are all BFO returns for the 19 to 00 pings.
I apologise for the lengthy post but I can’t stress enough that if you check what I have said you will note it is 100% correct. I can’t explain how it works. Only that it does.
Thank you.
@Victor
If one computes the distance from the terminal locations (LEP’s) and all the debris items (except the towlette), you get the following results for the mean and sigma drift speed.
7th arc 34.2S -> mean 6.61 km/hr sigma 1.34 km/hr
7rh arc 40.0S -> mean 5.57 km/hr sigma 1.14 km/hr
I know, not scientific, but the 40S data is much better behaved.
@Victor
oops! km/hr above should be km/day.
@DennisW: I don’t know how much information we can glean from calculating the average speed along a great circle path when the calculated (and observed trajectory of drifters) is north along arc and then west across the Indian Ocean.
@michael blades: I’ve reluctantly allowed your comment, but the content makes no sense. For one, the BFO is not the same as the uplink Doppler shift, which is why it is not zero at KLIA. But using the BFO values in Hz to infer distances in miles is incorrect.
@Victor
Yes, a lot of factors influence the actual drift path of any piece of debris. Seasonal current variations, variable windage, and tropical cyclones (23 of them) to name a few. As we know, not all of the debris finds were colocated. 🙂
The great cicle distance is simply a proxy for something that is impossible to accurately estimate. Minimizing the variance is a strategy for approximating a cross entropy approach.
michael blades: Victor is being kind. Everything you posted is nonsense. It shows you have no idea how the system works. I’ll leave it right there.
@Victor
Plus that, 34.2S is a “boring” place to search. That area has already been searched, and there are no ancillary reasons to search it again. The search North or South is much more appealing to me.
Think about what we would conclude and what we would gain from a negative result searching farther North or South relative to searching the 34.2S area again. You are advocating an inferior strategy.
@DennisW: Depending on how things pan out, there might be more than one area to recommend to search. With so much time before the next search, we don’t have to lock-in now. We might also be able to reduce the recommended search area around 34.2S, which makes it more practical to search other areas.
@Victor
At the moment I am in the 30-35S camp.
I am also in the outer range of Arc7 camp.
Unfort I fear that outer range might be pretty far out, esp at 30S
“Arc8” to me is a little like PaulS thinking, where the fuel+glide is done.
As far as work, I like to think we have example flight paths as a basis.
Obviously you have 34.3 covered. DrB’s prior pin 31.5 is a possible.
My inclination (still) to make some active pilot flight paths to explore distance.
As far as drift work, I am very interested in knowing probability “heat map” beyond Arc7 out to “Arc8” wherever that is, also acoustics out to arc8, which is also potentially much later than 00:19
@TBill: Unfortunately, with the CISRO drift data we have, we cannot discern distance from the 7th arc, as all the virtual particles are injected relatively close to the arc.
@VictorI
Yes, the drift studies are biased towards a crash close to the 7th arc and do not contemplate a glide.
Sid Bennett: I would not say “…drift studies are biased towards a crash close to the 7th arc…”. If you believe as I do that the 7th arc is based on solid data and physics…nothing else, then I would say drift studies are properly constrained by the facts as we know them. That is not a bias. It is just reality. Of course, you could argue the search area width should be wider, but not by much.
@ALSM
I agree. Plus that the drift studies do not have sufficient accuracy to influence the width of the arc search, IMO.
Even if we assume that the CSIRO drift data set is an excellent representation of floating debris, the virtual particles are all injected too close to the 7th arc to discriminate the distance from the 7th arc of the impact, i.e., whether or not there was a controlled glide after the final SATCOM transmission. I think that’s Sid’s point. Perhaps @Bobby Ulich can weigh in.
@Victor,
I understood Sid’s point and yours. I simply question whether the data and analytics can support a search distance qualification from the arc. Not trying to be argumentative here.
Plus that, I do share ALSM’s position that the data and physics support a termination very close to the arc.
@all
Decision theory is a relatively unexplored subject. You are taught to consider many “sides of the coin”. You are also taught to not consider a decision as a singularity. Life goes on. In the case of the MH370 search it is easy to consider a search of the 34.2S area based on the extensive and well done analytics of the UGIB. Is a decesion to search that area again the best decision? The best decision is one that optimizes the possible results, as I tried to explain in a previous clumsy post.
Consider the matrix below.
https://photos.app.goo.gl/7AydxNYxnZExcsfo7
@DennisW
You could add another column, “Search Arc Wider In & Out”
@Ventus
Yes, I could, but the result would be green and green. Searching unsearched areas are simply more productive.
@DennisW: If I am correctly interpreting your thinking, you start with the assumption that over a large range of latitudes, and within a short distance from the 7th arc, all impact sites have equal success probabilities before a search is conducted. Therefore:
1. All searched areas are less favorable than unsearched areas.
2. Analyses cannot be used to assign relative success probabilities, i.e., there are no hotspots.
If there is any validity to the UGIB results, there should at least be some additional “higher temperature” assigned near 34.2S. We could debate whether or not that additional temperature is sufficient to balance the “lower temperature” caused by the failed search, but I believe that is the essence of the debate. Of course, others believe there are other hotspots that have not been searched, so there is no tradeoff.
I think the drift calculations led by Bobby Ulich will provide additional insights when released. Bobby is extremely talented at extracting signal from noisy and sparse data sets.
Fortunately, we have some time before a new search is conducted.
One recent idea that motivates my thinking is “consensus”.
Mick Rooney and Blaine Gibson discussed the apparent lack of consensus in their April discussions.
We will never get total consensus but we might be able to develop a cohesive argument for those willing to be open minded.
I am thinking we are starting to have consensus for the 30-40 South region, ie no diversion to north of 30 South or so. Not saying impossible, just saying not the priority.
I personally feel like the BFO drift could be less supportive of 35S+ region. But I could be wrong and would not mind getting Inmarsat thoughts (assuming they would be willing). I would not mind getting Boeing or NTSB/FBI guidance on how the plane works, and active/passive assumption. We know Tony Abbott is saying to consider active pilot, I think he was probably reacting to input from the 38-South crowd.
@Victor
Thanks. Your response was well measured.
As we approach 7 years of effort we have little to show for it. The only real progress we have made is the ability to rule out the area already searched with a 90% or so probability. My search recommendation above reflects a desire to appropriately weight real progress versus analytics.
@ DennisW,
You say: “Searching unsearched areas are simply more productive.”
With due respect, would you wish to rephrase that ?
The only productive physical search will be one that locates the wreckage.
And this will only be at some future time.
The search for the most likely region in which to conduct the physical search may be the more productive or fruitful activity in the near future. The discussions here, including your statistical analyses, all potentially contribute to to minimising (reigning in) the region in which to conduct a physical search.
Unfortunately, you have not convinced me that consideration of surmised probabilities actually contributes to reigning in the physical size of any likely region.
Considerations must include uncertainties in the results of previous physical searches.
You say: “The only real progress we have made is the ability to rule out the area already searched with a 90% or so probability.” Perhaps you have underestimated the uncertainties in the results of previous physical searches. ?
@Mike Exeter I have always tried to talk to you with respect & I find it laughable how you can attack Dr B on social media for his pro Trump views when you yourself act Trump like when you think someone isn’t worthy of your time. You can’t control the narrative with me & the result is shown by your childish response towards me.
@All There seems to be a general consensus here that unless you are qualified in the subject then there is no way you can understand it. And accordingly your views will be dismissed without consideration. I do understand how both the BTO & BFO work. I just don’t agree with the interpretation of the handshakes. In terms of the Handshakes it isn’t the actual recorded Data I have issue with. What people here generally fail to realise is or maybe they do realise & are being ignorant or arrogant about, is that both the BFO & BTO Data point to a specific part on the 7th ARC, which became the priority search zone. There is a little bit of wiggle room in the data to consider other parts of the 7th ARC but I’m confident that the SWG have exhausted these possibilities thus the refusal to continue searching. The biggest question mark IMO is the fuel extension range. Because that is what the 7th ARC is largely based on. In terms of BFO, the flight path was consistent from FMT so no deviation from a direct route is possible.
In terms of my own beliefs. It isn’t about what BFO may or may not show. What the satellite imagery that caused the outset of so much derision in the first place actually meant. It is about looking at the Data as a whole & considering all possibilities. When we look at the BTO rings it certainly seems feasible that aside from the final 2 rins the other rings do indeed fit between the SCS & NIO. There is also a remarkable coincidence that we have missing Data from 17.07 to 18.25pm UTC & additional Data or Handshakes after 18.25pm UTC. The question I ask is:
“Disregarding the time stamps, basing interpretation on the Data itself, it seems entirely plausible & possible to me that those Handshakes could have fitted between 1707 & 1825 UTC. The BTO fits perfectly. If we assume that -2 BFO was reboot of the SDU in the SCS then is it not also plausible that the alleged previous Handshakes could have been Perth LES attempting to reconnect with Mh370, something that it didn’t manage to do until it was about to head out into the NIO. Which is entirely coincidental as well because if the plane was purposely diverted by the Shah as often assumed here it seems, then the aircraft not transmitting it’s position between SCS & NIO is entirely understandable”.
I’m sorry if I cause so much offence by simply trying to make sure no mistakes have been made & no possibilities have been over looked.
@michael blades: People here could care less about your qualifications. Your analyses make no sense. That’s why you get the strong negative reactions here and elsewhere.
@Michael
I felt you did the correct thing as far as seeking input. We have MH370 book authors writing bizarre books never stopping for reality check before publishing. Sometimes you have to have a thick skin around here, and on idea this radical, I would be doing behind the scenes checks before going too far with it.
It is hard to question timestamps because we know hardware design is hourly pings, and we know from the highly detailed and voluminous data logs that the passage of time behaved exactly as we would expect, as it pertains to the complex electronic workings of the aircraft . Among other things the Sat Calls from MAS impacted the pings times as expected. The data logs are virtually impossible to fake in their extreme lengthiness and complexity, and it rules out electronic spoof or anything unusual like that. And the experts here poured for hours over every line of data looking for any clues or data irregularity. I looked too but its usually hard to find anything IG missed.
@VictorI
Forgive my tardy response. I was distracted.
Thank you for clarifying my remarks. I try to address the specific subject being discussed and minimize the bandwidth.
@airsealandman and I differ as to the possibility that the flight path was extended by a glide. Historically, the IG focused primarily on the satcom data and the conventional wisdom at the time that most of the flight after the diversion was either under some physical emergency conditions or eventually as automatically controlled. These constraints led to an interpretation of the final two pings at the 7th arc as representing a uncontrolled descent after fuel exhaustion. This assumption was also embraced and defended by the “authorities”.
By converting a deterministic problem into a statistical problem, the ATSB created a heat map of possible locations on the 7th arc and a narrow band around it as official search area. That arc was thoroughly searched, and even though there is a real possibility the debris was missed, such a probability would be consistent with the estimate of 10% that I recall being stated. Whether this should be accepted as excluding the already searched area is arguable, but should be considered when we are able to agree on other areas that deserve searching.
It is demonstrably true that a modern aircraft with a skilled pilot at the controls can recover from a dive condition consistent with the satcom data and glide for up to about 140nm. Did it happen in this instance? I don’t know, but if we do not acknowledge that it could reasonably have happened (absent any evidence to the contrary) we are not examining the options dispassionately.
There are still aspects of the flight control system that we do not understand and cannot obtain clarification from the authorities (or the suppliers).
The debate that has accompanied the UGIB paper and others has uncovered details and possibilities that have not been fully understood or considered in the past.
To reiterate, the original IG estimate has never been objectively dismissed except as not leading to a successful result. It is not that the UGIB recommendation lacks substance, but it suffers from the same defects.
@Paul Smithson has made a case for a much further south impact point. There are two objections that might be made: that there is insufficient fuel and the data points in the time period at about 18:25 have not been explained satisfactorily. But, I would wish that one of the contributors to this discussion who has the expertise to do so would explore the possibility that the pilot wanted to extend the flight to the maximum extent, including an idle descent or other technique.
Too many of the posts recently have expressed opinions without substantial analysis.
@George
You asked.
You say “Searching unsearched areas are simply more productive.”
With due respect, would you wish to rephrase that ?
I will stand by my comment as is. It is consistent with modern decision theory.
You say: “The only real progress we have made is the ability to rule out the area already searched with a 90% or so probability.” Perhaps you have underestimated the uncertainties in the results of previous physical searches. ?
The 90% is not my number. It originated with Larry Stone (Metron Chief Scientist) in his summary of the search for AF447. It has also been a common number by others on this forum.
A physical search can be productive in several ways. Finding the wreckage, as you say, is one. But eliminating a search area with 90% probability is another.
@DennisW
Acknowledge your reply.
P.S. my weird sense of humour sees irony in your statement of January6:”Decision theory is a relatively unexplored subject.”
@George
If you really want stretch, check out the paper by Gell-Mann and Peters which explores expected value. It really does define a new, and I think correct, perspective.
https://www.santafe.edu/news-center/news/peters-and-gell-mann-author-most-read-chaos-paper-2016
@Sid Bennett. From your post to @airlandseaman.
“These constraints led to an interpretation of the final two pings at the 7th arc as representing a uncontrolled descent after fuel exhaustion. This assumption was also embraced and defended by the “authorities”.
About that interpretation there are of course the unknown unknowns. I advance one of those to the known unknowns, as yet. Could an artifact in the SDU lead to this if power were applied to it by the APU from cold for less than a minute, then reapplied shortly after, as a pilot cycled switches after fuel exhaustion for some reason?
Another unraised possibility. In the case of IFE non-connection, premature APU failure could result from positive g (spiral, phugoid) in a descent (an earlier vapour lock analysis I did did not address this). Thence with fuel forward in the tank, vapour lock could halt APU suction from its fuel line.
I agree with ALSM and others that as it stands most likely the aircraft crashed violently close to the 7th arc, piloted or not. We need to be modest with probabilities though when there are known unknowns and, lurking, unknown unknowns.
At the same time the advantages of an early wreckage find have to be balanced against probability purity. Had the fan from Air France Flight 66 not been retrieved, that requiring quite extraordinary persistence, most likely the cause would have been attributed to maintenance.
The search for the fan was iterative with developing the required techniques. The benefit from that retrieval would have lost value, quickly, with delay.
In MH370’s case any further searching will bring forward the probability of a find.
Having pronounced on all in the general, I should add a personal overrider. Based on what is known, my judgement is that the likely gain to be had from finding the wreckage in the MH370 case is marginal. But I allow I might be wrong.
For 737 Max followers. From Aviation Week.
Boeing Agrees To $2.5 Billion Settlement Over 737 MAX Fraud Probe
Guy Norris Sean Broderick January 07, 2021
Boeing has reached an agreement exceeding $2.5 billion with the U.S. Justice Department (DOJ) to settle criminal charges that two of its employees defrauded the FAA’s Aircraft Evaluation Group (AEG) about safety issues connected to two fatal 737 MAX accidents.
The $2.5 billion includes a criminal penalty charge of $243.6 million as well as $1.77 billion in compensation payments to 737 MAX operators. It also includes the establishment of a $500 million crash-victim beneficiaries fund to compensate the families of the 346 passengers who died in the October 2018 crash of Lion Air Flight 610 and the March 2019 crash of Ethiopian Airlines Flight 302.
The DOJ concluded two Boeing 737 MAX Flight Technical Pilots specifically deceived the FAA AEG about the Maneuvering Characteristics Augmentation System (MCAS), a flight control system modification that later became central to the MAX accident investigations. “Because of their deception, a key document published by the FAA AEG lacked information about MCAS, and in turn, airplane manuals and pilot-training materials for U.S.-based airlines lacked information about MCAS,” the DOJ said Jan. 7.
Shortly after the initial accident, the FAA AEG “learned for the first time about the change to MCAS, including the information about MCAS that Boeing concealed from the FAA AEG,” DOJ said. “Meanwhile, while investigations into the Lion Air crash continued, the two 737 MAX Flight Technical Pilots continued misleading others—including at Boeing and the FAA—about their prior knowledge of the change to MCAS.”
On March 13, 2019, three days after the second accident involving Ethiopian Airlines Flight 302, the FAA joined other worldwide regulators in grounding the 737 MAX.
“Boeing’s employees chose the path of profit over candor by concealing material information from the FAA concerning the operation of its 737 Max airplane and engaging in an effort to cover up their deception,” said David Burns, acting assistant attorney general of DOJ’s Criminal Division. The accidents exposed “fraudulent and deceptive conduct,” he added.
“The misleading statements, half-truths, and omissions communicated by Boeing employees to the FAA impeded the government’s ability to ensure the safety of the flying public,” said Erin Nealy Cox, U.S. Attorney for Northern District of Texas, where the charges were filed. “This case sends a clear message: The Department of Justice will hold manufacturers like Boeing accountable for defrauding regulators–especially in industries where the stakes are this high.”
DOJ determined that while two Boeing employees deceived the FAA, “the misconduct was neither pervasive across the organization, nor undertaken by a large number of employees, nor facilitated by senior management,” according to a court filing. “Others in the company disclosed MCAS’s expanded operational scope to different FAA personnel who were responsible for determining whether the 737 MAX met U.S. federal airworthiness standards.”
Several technical reviews have faulted a lack of effective communication within the FAA during the 737 MAX’s certification for helping set the stage for the accidents.
Of the $2.5 billion settlement, Boeing says $1.77 billion has already been included in amounts reserved in prior quarters for 737 MAX operator compensation and adds that it expects to incur earnings charges equal to the remaining $743.6 million in the fourth quarter of 2020.
“I firmly believe that entering into this resolution is the right thing for us to do—a step that appropriately acknowledges how we fell short of our values and expectations,” Boeing CEO David Calhoun wrote in a note to employees. “This resolution is a serious reminder to all of us of how critical our obligation of transparency to regulators is, and the consequences that our company can face if any one of us falls short of those expectations.”
Flight SJ182, a 737-500 out of Jakarta, has crashed about 4 NM from the coast to the northwest of Jakarta. After takeoff and climbing to around 11,000 feet, the plane rapidly descended to the sea.
https://twitter.com/flightradar24/status/1347865210317627392
SJ182 ads-b plots:
https://twitter.com/Airlandseaman/status/1347868827858608132/photo/1
https://twitter.com/Airlandseaman/status/1347871845907800064/photo/1
Same data as ALSM’s above, but with time explicit on the abscissa.
https://photos.app.goo.gl/ihCNUzrJp5gEP1tY9
@VictorI, @Richard, @DrB,
In October @VictorI variously wrote:
“One thing we’ll see coming out of the drift analysis is that it predicts near impossibility for any crash latitude north of Broken Ridge.”
“… crash latitudes north of Broken Ridge seem very unlikely, as the debris would have arrived much earlier than what was observed. Complicating the observations is the possibility that debris was reported some time after beaching. We are using the prevalence of barnacles as an indicator that a part was not beached long before discovery.”
“There is nearly zero chance that the crash occurred north of 25S”.
And on Jan 3 you wrote,
“If you believe the CSIRO drift calculations are even close to accurate representations of MH370 floating debris, then the analytical methods developed by Bobby Ulich show there is essentially no chance there was a crash along the 7th arc north of 29S latitude”.
I think there must be something wrong with your methods. The source of your CSIRO data, David Griffin, has an entry on his web log dated 17 September 2018 titled,
“The extraordinary tale of drifter 101703”.
http://www.marine.csiro.au/~griffin/MH370/
Described is a likely undrogued drifter that just happened to cross the 7th Arc on Mar 8, 2014 at latitude 23.6S. It quit transmitting around 60E near Reunion Island around the time the flaperon was discovered. Griffin says that this is fully compatible with his model.
So, here is an actual example of a drifting object that really did travel from north of broken ridge to the area where debris was found with just the right timing. It happens to be the only actual example that we have.
It thoroughly refutes the above quotes and claims, which incidentally had ruled out my specific 7th Arc Java location based on acoustic evidence. I didn’t see any such claims being made until I presented my case here.
The reason for the exclusion of more northern sites is as you wrote above. Your March paper (at the top of this page) adds a penalty for early modeled arrival in an area where debris was actually found. The same penalty is applied in Richard’s newly released drift analysis, with 90 days before exclusion. Much effort is attended in the paper to detailing the time between beaching and discovery based on barnacle abrasion, to the accuracy of 5-10 days. This completely ignores that debris could have arrived in an area, even drifted away and returned again before it beached and was found. The paper even cites that “many locals reported” in Madagascar that debris of the same type had been around for a month or more. It shows that much of the debris eventually found was ignored until volunteers raised awareness.
This appears to me as a cognitive bias towards your own preferred scenario. That straight path scenario has been narrowed further by including 90 turns matching only malicious intent to evade radar.
The same sort of bias is seen in the March paper of masking statistical results or multiplied probabilities. It did not even include any latitudes north of 20S. Areas along the 7th Arc yet to be searched should have a higher ranking in the likelihood probability, but somehow got ranked near nil at the northern end of the graph, while areas already searched by several methods ranked high.
Ditto for a bias towards a straight path for the probability charts. You assign nil probability on sat data match for anything N of 28S, and below 10% for fuel endurance N of 20S and falling off the end of your chart. Many slower path with turns past diversion airports can exactly match BTO with minimal speed changes and mine matches BFO as well as many proposed straight paths. Fuel endurance is a very close match.
Multiplying all of these biased nil probabilities together, it’s not surprising that you have convinced yourselves and now others that a site farther north on the arc is virtually impossible.
I’ve been reading about the many ways that we fool ourselves with our various cognitive biases. The scientific method is designed to counter that, but it is rather specific to being able to experimentally test a hypothesis. Still, statistical analyses in many other scientific fields adopt whatever methods they can (double blind, placebo, etc) as a check against our known tendencies to fool ourselves with our overactive imaginations. Speculation is one thing, but declaring statistical significance from warped studies is another.
I’d like to recommend an interesting vid. Recently the identity of the man who found the Forrest Fenn treasure was revealed. He had put out a video on his thinking about cognitive bias, not long before he traveled to his deduced location and directly found the chest of gold. The crux of his thinking was that he was not up against a puzzle master or genius of deception, but merely needed to take all the clues at their face value without layering on any complexity. By keeping his cognitive biases in check, he succeeded in a very short time where thousands of others had failed, including several who lost their lives trying.
Best Wishes for a Better New Year — Ed Anderson
Before impact, the descent rate exceeded 40,000 fpm, the speed was around M0.85, and the descent angle was greater than 50 deg from level.
We can only speculate as to what caused a plane to go from stable level flight to a steep descent so quickly.
And here is the link missing above to a vid on cognitive bias!
https://www.youtube.com/watch?v=XFzM7Nn7_AY
The granular ads-b data provides more detail.
https://twitter.com/Airlandseaman/status/1347920498559123456/photo/1
https://twitter.com/Airlandseaman/status/1347925491429175296/photo/1
@370Location: Some comments:
1. The trajectory of a single drifter proves nothing other than that path is possible. That does not refute the drift model results.
2. You should not equate the calculation methods of Richard Godfrey with those of Bobby Ulich. Bobby treats the problem with statistical rigor and in a way that accounts for reporting delays without assumption. The paper is not yet been released, so I think it is not productive to debate this at this time. That said, if you believe that it is impossible to discriminate latitude along the 7th arc using arrival time, the drift model says that just about ANY impact point on the 7th arc is possible.
3. The BTO and BFO curves are smooth from 19:41 and later. How do you explain paths with multiple maneuvers matching the smooth BTO and BFO curves that are consistent with great circle paths? And those great circle paths are consistent with a plane flying at cruise altitude and cruise speeds with fuel exhaustion occurring near 00:17 UTC?
4. In essence, you believe the only two data sets we can use are the 7th arc and your acoustic data. At the same time, we still don’t know what caused the acoustic event you identified, and how to explain its timing.
All that said, I have not dismissed your preferred impact point, and I really do appreciate all the work you have done.
Sympathies to the NOK of those on SJ182, with thanks for the early alert and FR24 data. One report says the pilot was last cleared to FL290. A decreasing ROC from FL100 going into a slow left turn before the dive might indicate an inability to correct for the loss of the left engine. Very sad. Will pay closer attention to the news.
@Victor,
Your quotes below:
If you believe the CSIRO drift calculations are even close to accurate representations of MH370 floating debris, then the analytical methods developed by Bobby Ulich show there is essentially no chance there was a crash along the 7th arc north of 29S latitude.
The trajectory of a single drifter proves nothing other than that path is possible. That does not refute the drift model results.
When an observation contradicts a model, most people would regard that as a very good reason to be suspicious of the model. Perhaps “contradicts” is too strong? Maybe something along the lines of – the behavior of drifter 101703 was an extremely unlikely event might be better?
I have already expressed my opinion of the value of drift modeling (and satellite data modeling as well for that matter). I will anxiously await DrB’s paper.
@VictorI, on your points:
1. Actually, having an example of a drifter that provides factual evidence does refute claims that it’s highly improbable for the event to have happened. I won’t get into proof against a negative hypothesis, but your data source explicitly pointing out that it’s NOT improbable shows that there’s a problem with your interpretation of his data.
2. There are ways to discriminate latitude probability on the 7th Arc without arbitrarily ruling out an origin that delivers debris directly to the destinations where it was found, and nowhere else. True, the animation that I made from the same data shows that debris from nearly anywhere in the SIO could make its way to the found sites. Besides ranking according to how accurately a modeled origin delivers the finds, there might also be a penalty for origins that deliver significant debris to the Australian coast and even Tanzania and NZ. The early arrival penalty affects a minor proportion of southern sites, but it is not ruling out all the remainders as it does from much farther north.
3. I have already explained about fitting points to what looks like a smooth BTO curve. We know that points before 19:41 are not on that curve, but are effectively mirrored about it due to the FMT south. The same coincidental effect applies to the later points. The timing of acoustic detections near airports and noise on the 7th arc were not chosen by statistical methods. They are rare anomalies in the middle of the night that also match that same BTO curve exactly, possibly even better that a straight path. It is no more improbable that they match a perceived curve than for points before 2nd Arc. Too much coincidence is not cause to dismiss acoustic evidence.
4. Please don’t try to distort what I believe into a straw man argument. I have incorporated far more that just the 7th arc and acoustic data. I believe that the barnacle growth and drift data may also have been misinterpreted, because they seem to be quite compatible with a tropical site on the 7th Arc. The noise event there is an anomaly, different in several ways by comparisons to natural geologic events. I’ve speculated about the source of the noise, but that’s all that can be done until a relatively localized search of a very specific location is made to rule out the candidate. That has effectively been the course of all previous searches for the MH370.
I hope my comments about bias aren’t taken as simply accusations. I’m hoping to raise the bar and improve our collective approach. Bias is a ubiquitous human fraility that I recognize in my own efforts. (For example, the sun glint. I know that’s based on a wishful visual pattern match, but it’s only mentioned as a supportive clue). I’ve actually gone to great lengths to cross-check and test counter-examples of my claims. It’s frustrating to get a new algorithm zeroing in on what looks like a solid event, only to have it evaporate when testing against a barrage of other methods. I’m hoping others might think more about how they could counter-test their own hypotheses.
@DennisW: I think there is some confusion over what the CSIRO model predicts relative to that drifter. David Griffin said:
All that drifter 101703 proves is that if MH370 had crashed at 23.6°S then at least one of the thousands of pieces of the aircraft might have taken the same path and time to cross the Indian Ocean. Our model agrees with this, and helps to explain why so little can safely be concluded. The track of drifter 101703 is well within the envelope of 120 model counterparts (all initially within 5nm of the drifter and thus equally representative) – but that envelope is very wide.
My point is you can’t draw meaningful statistics from a single drifter due to the randomness of the ocean and weather. The path of this single drifter does NOT refute the CSIRO model.
@370Location: Your methodology succeeds or fails based on whether the acoustic event near the 7th arc was MH370. The other data sets are simply used as qualifiers, as the impact point is solely determined by the localization of the acoustic event. If you are using the other data sets to determine the position of the impact, I missed something. Now one may argue that is a strength rather than a weakness, but that depends on the probability that the event was truly MH370.
Good discussion.
@Victor
I understand your point.
The analytics (both drift and ISAT data) don’t allow excluding certain possibilities, and provide nothing more than broad ranged probabilities.
@Victor
My last comment did not come out very well. One has to consider the ensemble of many pieces of found debris to infer the most likely LEP with high confidence.
@DennisW: Agreed. The more recovered debris, the better. A single drifter observation is insufficient to discriminate latitude.
@Victor
I am proposing a tentative final answer to the strategy of the ZS sim study data points.
I assert that the sim data represents a 180S CMH flight path to the Magnetic South Pole, from DOTEN or 1090E waypoint. Of course it appears to be based off MH150 to Jeddah and not MH370. At sim point N5, fuel is added which is just enough to get to the Mag SP. There is no flight path line because there is no way to forward project a CMH180 with 25knot wind flight path.
ZS must have known the properties of that FS9 flight path, and he perhaps also knew that both CMH180 and NZPG LNAV paths both pass thru 45S1. ZS still could have used the NZPG path to move the aircraft to 45S1 and/or N10, whereas the FSNAV utility would offer that map/capability.
Although the interpretation is mine, Mick Gilbert and I have been working on the sim data. Mick has made several “discoveries” including that we might infer fuel jettison starting at N10, inferring from the time it takes to do that 40-45 mins to the end of the run.
The implications if any for MH370 would have to be deduced, but CMH181 to 31.5 S was DrB’s prior pin. Something like that looks potentially good.
Some prelim documentation on Twitter:
https://twitter.com/HDTBill/status/1348035261335269379?s=20
As a consequence of the tragic crash of SJ182 I now have ADS-B data and long range WSPR data of that Flight SJ182 (2021.01.09 07:40 h UTC)in addition to data from AF447, MH17, Germanwings 9525 in order to validate the stored WSPR data of flight MH370 in 2014 while still lacking ADS-B data for that night of March 07/08, 2014 (cost of purchase ADS-B data for the region will be more than 4.000 US-$).
Flight QFA114 JNB to PER on 2020.11.13 also seems to be a good valida-tion candidate for WSPR track of MH370 as it was cruising in close proximity to the IG LEP of MH370 at 22:48 h UTC. (ADS-B data and long range WSPR data available for flight QFA114).
End of January 2021 and February 2021 the antarctic sightseeing tourist flights to McMurdo station in Antarctica will allow long range WSPR tracking from Australia to Antarctica with support of ADS-B data. Initial test happened on new years’s eve 2020/21 with flight QFA2902.
@Rob: Excellent work. Please keep us posted.
Updated SJ182 analysis here: http://bit.ly/3nwjICq
@ALSM
Interesting. The vertical acceleration (~11.25 m/s^2) looks close to gravity. Slightly greater since the engines were still producing thrust.
Re SJ182: The estimated true airspeed increased steadily from 150 kn to 528 kn. The descent angle at times exceed 80 deg down from level flight, i.e., almost vertically down. At the time of the start of the descent at 10,700 ft, the total energy (kinetic plus potential) was 11,900 ft. At 150 ft, the total energy was 12,2578 ft, which means on average, the engine thrust exceeded the drag.
It looks as though the nose was pushed down, either from pilot input or from runaway automation.
@Victor
My guess is a failure (jack screw binding ??) in the vertical elevator control mechanics. There is some previous history of that although not on 737 aircraft type.
@VictorI,
Of course a single drifter track cannot predict MH370 latitude. A single simulated drifter out of thousands of simulations is quite different than an observed drifter.
I made no claim of that drifter refuting the CSIRO model. Just the opposite. My point is that the source of your data says that real drifter starting at 23.6S is in agreement with their model. Please look again at your quote from Griffin.
Contrarily, you have been repeating that anything N of various latitudes around Broken Ridge can be ruled out entirely, and for the stated reason that debris arrives too early. CSIRO does not have that constraint, and timing of the one drifter shows that it does not even arrive early. It shows a flaw in the added constraint.
@DennisW: My guess is spatial disorientation after experiencing turbulence in IMC. Luckily, we’ll know soon, as the FDR and CVR were recovered.
And again we have a case in which the ELTs failed.
@Rob,
Thank you for the WSPR clues. If my guess on your ACS method is right, it’s a very intriguing approach, and the doppler drift rate could be extra selective. Flight schedules might be an alternative to ADS-B for ruling out false positives, and cross-checking timed positions along certain specific paths might partially validate one or another. Hoping to hear more!
@370Location: You are missing my point. We agree that the CSIRO model predicts paths that bound the observed path of drifter 101703. However, Bobby’s statistical model, which uses the CSIRO drift results, essentially rules out latitudes that far north. That’s based on an analysis of all the recovered debris and all of the virtual particles. You can’t look at a single drifter in isolation and draw meaningful conclusions. My advice is that you wait for the paper to be released and then provide comments.
@Victor
RE: “And again we have a case in which the ELTs failed.”
Aircraft accident investigation agencies have issued several safety recommendations regarding ELT crashworthiness standards. In response, RTCA, the body responsible for ELT performance specifications in North America, published a new Minimum Operational Performance Standard in December 2018, which addresses issues such as crash survivability. The new MOPS has been adopted by both the FAA and EASA, but I believe it only applies to new installations.
From @airlandseaman 2nd graph, final longitudinal accel was 2.5g. Inexplicable.
@David: According to my calculations which neglect the light winds, the plane accelerated from a TAS of 288 kn to 611 kn in 21.5 s, representing an average longitudinal acceleration of 0.8g. Over that same time, the descent rate increased from 2791 fpm to 50,134 fpm, representing an average downward acceleration of 1.1g. Those both seem reasonable.
I’ll try to find time today to reconcile the calculations.
[The original comment had errors which were corrected.]
@David, @airlanseaman:
Something is wrong with the data. Even after smoothing the VS and GS curves, the rapid increase in total energy below 4,000 ft cannot be physically justified. I suspect the GS reporting is in error.
@Andrew: Recognizing that we don’t yet have access to FDR and CVR data, what’s your guess as to the cause of the crash?
@Victor
You speculated:
@DennisW: My guess is spatial disorientation after experiencing turbulence in IMC. Luckily, we’ll know soon, as the FDR and CVR were recovered.
With a vertical acceleration of 11.2 m/sec^2 the flight crew (and everyone else in the aircraft) would be floating without seat restraints. A condition incompatible with being disoriented.
@DennisW: With no visual reference, and either faulty, ignored, or misunderstood instruments, spatial disorientation easily occurs, even for experienced pilots. Pilots are trained to trust their instruments and not their perception. That’s not always done.
When an elevator jack screw failed on a flight off LA the PIC tried to fly inverted. A very good decision that did not work out.
https://photos.app.goo.gl/MPYrKtT4JT8Vtes98
@DennisW: It is too early to rule out any scenarios, but considering the rain, the low ceiling, and towering cumulonimbus in the vicinity, my guess is weather-induced turbulence initiated the upset, possibly disengaged the autopilot, the pilots became disoriented, and failed to control the plane. Admittedly, this is 100% speculation.
For now, I am not trusting the GS data below 4,000 ft, as the rate of total energy increase (potential plus kinetic) is too high. I think the VS data, derived from the smoothed altitude data, is more believable.
@Victor
My scenario is 100% speculation as well. 🙂
If we knew what flight plan was cleared and what ATC instructions were received after that, we could determine the first deviation, which is probably when the initiating event occurred.
Does anybody have that?
@DennisW
Re: ‘When an elevator jack screw failed on a flight off LA the PIC tried to fly inverted. A very good decision that did not work out.
Yes, that was Alaska Airlines flight 261, nearly 21 years ago now. Hollywood took that failure and the crew’s attempt to save the aircraft as the inspiration for the sequence in the 2012 movie Flight.
@Mick
Interesting. I thought trying inverted flight was very creative idea in a desperate situation.
@Victor. SJ182 descent data. Thank you.
@DennisW
I thought trying inverted flight was very creative idea in a desperate situation.
Oh, absolutely. When your aircraft is trying to kill you by pitching the nose down turning that into a pitch up by rolling inverted was extraordinarily clever, particularly when you consider the stress of the moment.
The CVR transcript from that crash is both saddening but interesting. Once the they’ve got the aircraft inverted the Captain says,
are we flyin?… we’re flyin… we’re flyin… tell ’em what we’re doin.
They were still flying at that point but sadly not for much longer.
@Victor
RE: “Recognizing that we don’t yet have access to FDR and CVR data, what’s your guess as to the cause of the crash?”
I don’t like to speculate, but loss of control caused by spatial disorientation (as you suggested), or a horizontal stabiliser failure (as Dennis suggested) are likely candidates. According to zoom.earth, there was significant convective weather near the crash location at the time of the accident. If the crew encountered a CB and the autopilot disengaged, they might have become disorientated and lost control of the aircraft. They might also have had some kind of technical problem that resulted in autopilot disengagement and disorientation, similar to the Adam Air accident in 2007. I don’t know the history of the accident aircraft, but COVID has effectively grounded a large number of the world’s airline fleet, along with their pilots. Gremlins quite often appear when grounded aircraft resume flying, which might be problematic for pilots who are not particularly current.
@Andrew: That all sounds reasonable, including the possible contribution of pilot rust.
@Andrew
Re: ‘ I don’t know the history of the accident aircraft, but COVID has effectively grounded a large number of the world’s airline fleet, along with their pilots. Gremlins quite often appear when grounded aircraft resume flying, which might be problematic for pilots who are not particularly current.
Andrew, apparently the aircraft (PK-CLC) was inspected for a return to service in mid-December and commenced commercial flying in late December. It had flown something like 130 sectors since then, including four sectors earlier on the day of the crash.
CLC’s first flight on the day of the accident departed at 0500 local so of it was the same flight crew they would have been at it for over 10 hours coming into the crash flight.
@Victor
According to reports, the FDR was recovered earlier today:
https://www.bbc.com/news/world-asia-55628294
https://www.flightglobal.com/safety/flight-data-recorder-recovered-from-sriwijaya-737-crash-site/141917.article
@Mick Gilbert
Thanks Mick. Hopefully we’ll learn more once they retrieve the data from the FDR.
I am less skeptical about the horizontal speed below 4000 feet. At 07:40:23, the plane was pointed almost straight down (75 deg below the horizon) going 440 kts and accelerating. Assuming the controls of this older plane would allow a pilot to do so, pulling back hard on the yoke could easily produce more than 2.5 g’s, resulting in an almost immediate decrease in descent angle and rapid increase in horizontal speed. So I don’t see any problem with the ADS-B data at this point. The FDR will tell us if this is what actually happened.
@airlandseaman: You have to look at both the horizontal and vertical speeds and their contributions to TAS. Assuming winds are light (which needs to be assessed), both the horizontal component of TAS (the GS) and the vertical component of TAS (the VS) increased in magnitude, resulting in a large increase in TAS. While rapidly descending, of course you can produce 2.5g perpendicular to the flight path by pulling up, which would cause the VS to decrease in magnitude (become less negative) as the GS increases in magnitude. That’s not what occurred here, as the magnitudes of both GS and VS increased, and TAS correspondingly increased.
As @David said, the >2.5g acceleration of TAS is inexplicable. For vertically down flight, 1.0g can be contributed by gravity. Even with no drag, to reach 2.5g, the engine must contribute the balance of 1.5g. There is no way that the 737 engines can contribute an additional force equal to 1.5 times the weight of the plane.
It looks as though either there is another large force acting on the system (violent weather) or the data is in error.
@Victor Iannello
Re: ‘For vertically down flight, 1.0g can be contributed by gravity. Even with no drag, to reach 2.5g, the engine must contribute the balance of 1.5g. There is no way that the 737 engines can contribute an additional force equal to 1.5 times the weight of the plane.
It looks as though either there is another large force acting on the system (violent weather) or the data is in error.
If the data is correct might it suggest that the aircraft was inverted for at least the terminal phase of the descent?
@Mick
I don’t see how the aircraft configuration can alter physics. Victor has a solid point.
@DennisW
Re: ‘I don’t see how the aircraft configuration can alter physics.
I’m not talking about altering physics, I’m just suggesting that by inverting the lift force such that you end up with thrust, weight AND ‘lift’ all contributing to the downward vector that would change the equation somewhat.
You can typically achieve a more rapid descent by rolling inverted and pulling the nose toward the ground than you can by pushing the nose down.
Rightside up in a dive lift and drag are countering weight and thrust whereas inverted it’s only drag that is impeding the descent.
@Mick Gilbert: Lift is perpendicular to the flight path, and cannot change the total energy (kinetic plus potential). Only thrust and drag can do that. Said another way, the lift force cannot contribute to the >2.5g acceleration in TAS, and gravity can contribute at most 1g.
An abnormal attitude could explain the bad data.
After reviewing the SJ182 ADS-B data posted at ADSBExchange, I agree with Victor that at least some of the SJ182 data posted at FR24 appears to be in error. You can see the obvious anomalies in the data as you step through the ADSBExchange positions here:
http://bit.ly/3qj69YA
I reviewed the total energy analysis using FR24 ADS-B data again and I can’t find any errors in the math. But as Victor and others point out, the implied increase in TE after 7:40:23 is not physically possible (too fast). This could be due to bad GS numbers (more likely) or bad altitude numbers. The ADSBExchange data, which contains Vspd values, suggests the crew may have been dealing with some instrument failures.
A one page summary of the ADS-B Exchange data can be found in the SJ182 folder here:
http://bit.ly/3nwjICq
R.E. SJ182, the flight path from just after takeoff deviated signicantly from what I think is the SID and unlike the path flown by the same flight on Jan 4. Normal departure involves a sharp right turn to head back NE towards DKI. The flight in question turned to a track WNW, then a turn to the NNE, all the while climbing and accelerating. avherald reports: “Departure control subsequently noticed that the aircraft was not on its assigned heading of 075 degrees, but tracking northwesterly and queried the crew about the heading at 14:40L, but received no reply, within second the aircraft disappeared from radar.”
Any ideas?
@sk999
Zoom.earth shows there was significant weather to the west of the airfield, as can been seen here: https://www.dropbox.com/s/cj43w470jtemple/SJ182%20Sig%20wx.png?dl=0
I’ve updated the image with the location of the airfield and a very rough drawing of the track. My guess is they were manoeuvring around weather and at some point were assigned a heading of 075°. The aircraft seemed to be turning towards that heading just before it crossed the coast, but then deviated towards the NW and then sharply E.
Re: SJ182
As far as thoughts, it seems a little like Atlas Air.
Thoughts are I hope it is not Boeing issue.
Question- could an AirBus dive like that (Atlas) or is the rate if descent moderated?
I am growing suspicious about the ADS-B reported positions and speeds during the last 8 seconds or so. If the plane rolled to the left and descended inverted, almost straight down, the ADS-B top mounted GPS antenna would be pointed towards the ocean, not zenith. Thus, it is possible that the GPS derived positions and speeds could have been the result of tracking some direct and some ocean reflected signals (multipath), resulting in bogus positions and speeds. The FDR data should clear this up.
@alsm
Good summary.
Looking at the first plots you posted five days ago, I was then tempted to comment: “Looks like they almost retrieved it”, but thought better of it, deciding that the amount of data was insufficient to draw any conclusions.
@ALSM
Multipath is my guess as well. Low altitude inverted flight would be especially susceptable to it for satellites with low elevation angles.
@airlandseaman, @DennisW,
ADS-B is a digital encoding with a 24 bit checksum. GPS vertical accuracy is pretty bad without averaging. On big aircraft, it probably gets supplemented by the Inertial Reference System, but who knows what sort of voting algorithm is used.
Similar issues caused AU pilot Mike Collins to put out an MH370 book, “A Tale of Two Planes”, full of conspiracies about two identical planes flying within 600m of each other. It apparently stems from assuming that ADS-B and ACARS were both fed by GPS only. The inertial nav had simply drifted 600m east since startup alignment.
@airlandseaman, @DennisW,
Sorry, of course the GPS would be susceptible to losing satellites. I mistakenly thought you were talking about the ADS-B signal, which would be on local 1090 Mhz near the airport.
The Mode S 1090 MHz communications link worked fine to 250 feet. Pressure Altitude (which is the altitude reported by FR24) is measured by an independent pressure transducer, not GPS. We know the TE could not have increased as much as the FR24 data suggests. Since the altitude data is not susceptible to multipath, and GPS is, it is likely that the TE error is due to an error in GPS positions (and thus Gspd) after 07:40:22 (when the GPS antenna was pointed at water).
I substituted a constant 100 kts for the Gspd’s after the FR24 Gspd dropped to 115 kts, and the TE looks realistic, consistent with the rate of TE increase observed during the 3 minute climb out from the airport.
@airlandseaman,
Thanks, Mike. Multipath on multiple GPS sats or losing some to get positional error makes perfect sense. Your energy calcs are an interesting validation check on the ADS-B numbers.
Most recent SJ182 news.
Not much to add to what we already know.
https://www.reuters.com/article/us-indonesia-crash/indonesia-finds-casing-of-crashed-sriwijaya-air-jets-cockpit-recorder-idUSKBN29K0I7
NY Times:
Indonesian Plane Went From No Flights to 132 in Less Than a Month
A few observations on SJ182 collected here.
Most notably, the RoC data scraped/transcribed from ADSBexchange.
Perhaps the ROC went very positive after the plane inverted or was nearly vertical so that the sign is wrong?
Re SJ182 ADS-B data: There’s another odd fact in the FR24 data. The altitude dropped at a near constant acceleration (1.27 g’s). The vertical speed increased linearly to 550 knots. It such a constant acceleration seems unlikely.
For Info:-
https://www.6pr.com.au/mh370-widow-still-searching-for-answers-6-years-on/?fbclid=IwAR0cHj5wpbFP0U3y-D6LcPRA3F82ejL35QIC4SFaaMDpNQSLv1LqSEKB1JM
Victor,
I suspect that roll >90°
@ventus45: I feel sorry for Danica Weeks, who lost her husband Paul. Unfortunately, she and others have been hoodwinked by Sergio Cavaiuolo, whose false analysis of the handshake timestamps predicts the plane crashed in the Maldives.
@Victor,
I didn’t intend for that comment to be so terse, finger slip on 4.7″ screen!
The ADSBexchange data does exhibit some level of reduction in the playback but baro altitude & position correlates well with FR24’s ‘granular’ data.
That the RoC has changed sign does suggest the aircraft inverted early in the descent. PK-CLC appears to have undergone an aftermaket upgrade for full Mode-S & SSR surveillance interoperability while withdrawn from service during 2020, that upgrade may have included a flight instrumentation upgrade if TCAS was wrapped into the upgrade.
Locating the CVR memory module will be critical to understanding how the ‘upset’ developed.
The interview was 17min 23sec long.
It also included some comments from Byron Bailey from 9min 54sec to end.
@Don
You said:
“That the RoC has changed sign does suggest the aircraft inverted early in the descent.”
I can think of no other explanation. My speculation is that the inverted flight was induced by the crew in response to a horizontal stabilizer failure. Victor’s “pilot disoreintation theory” is lame.
RoC is derived from changes in static pressure. It shouldn’t be affected by attitude.
@ALSM
It appears that RoC was derived from GPS in this case. How else would you reconcile the observables?
Dennis: I don’t believe GPS is ever used to derive RoC. But regardless of the sensor used, dA/dT is not affected by attitude.
Correction…not affected by attitude…
@ALSM
@DennisW
The vertical speed data for the flight instruments on the B737-300/400/500 is provided by the IRUs. The Captain’s VSI receives its data from IRU 1 and the First Officer’s VSI receives its data from IRU 2.
@DennisW: We’re just speculating of course, but a deliberate 180 degree roll to inverted to counteract nose-down elevator would be extraordinary flying for a transport pilot. On the other hand, spatial disorientation in turbulent IMC has occurred many times in aircraft of all types, and is responsible for many crashes. It may or may not have occurred, but to characterize it as “lame” possibility is strange.
Andrew: Thanks for that info on the B737-300/400/500. I should have qualify my point about the sign of the RoC by noting that I assume a properly operating sensor, whether GPS, IRU or pressure transducer. Obviously, if the RoC sensor is putting out bad data, the RoC indicated (and transmitted via ADS-B, etc.) will be in error, which raises this question about the IRUs in the B737-500. What happens to the gyro’s in the IRUs if the plane rolls 180 degrees? Will they “tumble”? Are they mechanical, or laser ring?
@Victor,
Inverted flight in response to horizontal stabilizer failure was actually done in Alaska Airlines flight 261 which crashed off Los Angeles and was well known by aviation cognescenti.
A descent rate of 40,000 feet per minute would not be masked by disorientation.
@Andrew
How do you explain the positive RoC data?
Alaska Airlines Flight 261, the pilots were aware of the stabilizer issues, and battled to control the aircraft for over 30 minutes. The roll was a final effort to arrest a steep dive. On the other hand, SJ182 went from level flight to crash in about 20 seconds. That would leave precious little time to assess the failure and attempt a recovery by deliberately inverting.
On the other hand, spatial disorientation in IMC and rapidly progressing to high descent rates are not uncommon. Somatogravic illusions, in which longitudinal acceleration is mistaken for nose up pitch, led to the crash of FlyDubai Flight 981 at Rostov-on-Don, Russia, and the more recent Atlas Air 3591 near Houston, Texas. I won’t claim this occurred for SJ182, but it remains on the table as very possible. Of course, mechanical failures are also on the table.
Because spatial disorientation has led to so many accidents, as part of training, after spatial disorientation is induced, all pilots must learn to recover from abnormal attitudes without using outside visual references. Without the discipline to trust their instruments, or possibly after one or more instruments have failed, uncontrolled flight results. It occurs surprisingly quick.
@Victor
Well, the stats are certainly on your side. Pilot error is by far the most common cause of commercial hull losses. SJ182 does not fit that mold IMO.
@ALSM
The IRUs have laser ring gyros. As far as I’m aware, they don’t tumble at extreme attitudes, unlike conventional gyros.
@DennisW
I can’t explain the positive RoC, other than a sensor fault.
The Adam Air accident had some similarities to the limited data we have for SJ182, notwithstanding the RoC anomaly. The report makes for interesting reading:
https://www.atsb.gov.au/media/24500/Final_AdamAir_PK_KKW_17032008.pdf
@Andrew said: I can’t explain the positive RoC, other than a sensor fault.
Or a problem in how the ADS-B data is generated or interpreted. Maybe there was an overflow which swapped a sign bit.
Regardless of what the RoC data from other sources suggest, the FR24 granular altitude was going down the whole time (ignoring some minor noise) and accelerating at a near constant vertical rate (~-1.3 g’s). Raw data here: https://bit.ly/3qyjkVC
@Ventus45
Interesting, but we are 7th anniv right? or did I add a year?
It was sad NoK Danica Weeks thinks the Maldives has merit.
Bailey was much closer to the mark as far as what likely happened.
The most interesting comment he made was that the FBI had the “flight plans” and that he Bailey was in receipt of the confidential plans. Apparently a reference to the simulator data, but we all have that. We know ATSB was “complete” sim data so he could have that. If FBI had a interpretative flight plan, that would be very interesting, and it save a paper in progress.
@Victor. It is possible I think that the appearance of a +ve RoC was a system linearity inserted between the two extreme descent and climb points, those being separated by the 7secs that it took to roll inverted? No intermediate readings appear to have been transmitted
The descent continued after that indicated jump.
Possible cause. I expect the static port would be below the fuselage’s widest point. Whereas the positioning of that is to obtain the best static reading over the aircraft’s ‘normal’ +ve AoA range, if inverted and with negative AoA that port point will be partially in the lee of the fuselage. That should induce a negative pressure, a suction, the perceived altitude increasing thereby.
Following that roll to inverted the static pressure will have an altitude ‘index error’ caused by that though subsequently will sense a descent once more.
Even so that would not explain the flattening of the descent rate at the end.
David: Using FR24 granular data, I do not see any “flattening” of the descent rate at the end. #SJ182 accelerated all the way to impact (if the FR24 data is accurate). http://bit.ly/3p50LYS
@ALSM. Yes, though it was the RoC graph I was alluding to. That levelled at ~20,000 ft.
Adding to my earlier, as to why there might have been no transmission between those RoC extremes, with a static port on both sides of the fuselage there would have been a “disagree” during the roll. That might have inhibited it.
@David
The vertical rate data on the B737-500 (& many other ‘modern’ airliners) is inertial. It is not provided by the air data system.
@Andrew. OK. Thank you.
Even so the purported +ve RoC may be an illusion.
@David: FR24 does not report all the ADS-B data transmitted by the aircraft, and what is reported is subject to interpolation, extrapolation, and other manipulations. We saw that in comparing the ADS-B data received by Malaysian ATC to what FR24 has published (despite many people accepting the FR24 data in lieu of the ATC data). So we have an imperfect chain of exchange between the flight kinetics measured onboard the aircraft and what FR24 releases to the public.
@Andrew: The accident report for Adam Air makes for an interesting read, and highlights how distraction, hand-flying, poor training, and spatial disorientation can lead to tragedy.
@Victor
Did you mean to Adam Air? If so, I agree, absolutely. Sadly, similar accidents have occurred on a number of occasions where a crew became distracted by a problem and nobody was minding the ship. Airmanship Rule #1: Fly the aircraft!
@Victor. “So we have an imperfect chain of exchange between the flight kinetics measured onboard the aircraft and what FR24 releases to the public.”
Thanks.
@Andrew: Yes, I meant Adam Air. I fixed the comment.
@Victor
Try as I might, I cannot reconcile the RoC data (provided by Don T.). Something is just flat very wrong.
@DennisW: The data set is not consistent with flight dynamics and physics, and is not even internally consistent. We are trying to use ADS-B data as manipulated and stored by tracking sites in ways never intended. If that is all the data available, then I think it’s worth the effort to understand the problems with the data. Fortunately, authorities have the FDR. It’s been reported that the authorities already have a general understanding of the accident, but are hesitant to release information until the CVR data is in hand. That means with or without the CVR data, we should know more soon.
Bloomberg is reporting that authorities are investigating whether thrust asymmetry from a faulty autothrottle might have contributed to the crash of SJ182. Note: Pilots are trained to apply rudder to counteract the yaw induced by thrust asymmetry.
https://www.straitstimes.com/asia/se-asia/boeing-jets-throttle-becomes-focus-in-indonesia-crash-probe
WSJ also reporting autothrottle issues:
https://www.wsj.com/articles/indonesia-plane-crash-probe-centers-on-engine-control-problems-11611214371
“Pilots on a previous flight in the same jet experienced a similar autothrottle problem, according to one person briefed on the matter, but the discrepancy apparently wasn’t written up as required in the jet’s maintenance log. A spokeswoman from the airline declined to comment.”
Thank you, @airlandseaman.
I should have expanded my comment to say that pilots are trained to apply rudder to counteract thrust asymmetry, but if both engines are producing thrust, the autothrottle can be disengaged, the thrust can be balanced manually, and the flight can continue. I don’t think the autothrottle is required, per the MEL, unless a particular approach requires it.
@Victor
I apologize for categorizing your disorientation theory as lame. Blame it on vino tinto. The circumstances of this event indicate an aircraft issue of some sort. Disorientation had little to do with it, IMO.
@Victor
Autothrottle issues have been a factor in at least two accidents that spring to mind: the China Southern B737-300 accident at Dalian in 1992 and the Tarom A310 accident near Bucharest in 1995. The first accident occurred after the autothrottle failed to increase the right engine thrust when the aircraft levelled off during descent. The crew failed to notice, the aircraft rolled to the right and the crew lost control. The second accident occurred after take-off. The captain became incapacitated at much the same time as an autothrottle fault retarded thrust on the left engine. The FO was distracted by the captain’s incapacitation, failed to notice the rapidly increasing left roll and subsequently lost control.
Pilots are trained to apply rudder to counteract thrust asymmetry, as you mentioned. However, due to the regulatory requirements, most asymmetric training is conducted by failing an engine shortly after V1, while the aircraft is still on the runway. Some airlines do very little asymmetric training under different scenarios, where the autopilot might be engaged, for example. Autopilot engagement can complicate matters, because it will control the aircraft by applying a lot of aileron to counteract the roll caused by the asymmetric yaw. If the pilot is distracted or is poorly trained and fails to notice the roll input, he/she might fail to apply the correct rudder input. If the autopilot struggles to control the aircraft and disengages, the roll input suddenly disappears and the aircraft quickly rolls on its back.
The autothrottle may be inoperative per the MEL, provided the approach minimums (generally low visibility operations) do not require its use.
@DennisW: Don’t discount the possibility of a number of contributing factors. A failure could have been the initiating event which provided the distraction. A faulty autothrottle shouldn’t cause a steep dive unless coupled with other factors like weather and disorientation.
@Andrew: I take it the yaw damper can’t supply a hard, steady rudder? I also assume there is no TAC on that 737.
@Victor
In most flight phases, the AP only controls two-axes, pitch and roll. On the Boeing types that I’ve flown (B747, B777), the AP also controls the rudder during low visibility approaches with LAND 2 or LAND 3 annunciated. However, on the B737 I don’t think the AP controls the rudder in any flight phase.
There is no TAC on the B737.
@Victor
Sorry, I just noticed you mentioned the yaw damper. The yaw damper on the B737 only helps with Dutch roll prevention, gust damping and turn coordination. There’s no rudder pedal movement and insufficient authority to counteract large thrust asymmetry.
@Victor
Yes, a crash scenario is often complicated by a number of contributing factors. I am completely open minded (and unqualified to opine) on SJ182.
@whomever
As a certified medic I am required to take 48 hours of continuing education every two years. It is a real drag.
An advanced degree in the sciences (which I also have) has no such obligations relative to maintenance.
Why do you suppose that is? Is it a good situation? Probably not, IMO.
Sorry for the out of context post.
Hi, i’m just wondering something(sry if my english is not very good), the french report about the flaperon mentionned that the crustaceans which were found on the piece have grown in warm waters, they said like minimum 24 degrees celsius but your zone seems to be much more at the south where the water temperature is beetween 10 and 15 degrees and i’m wondering what do you think about that?
Hope to have a reply and keep investigating we need to find this plane.
Have a good day.
@DennisW
Tell me about it! As a professional pilot I’m required to undergo multiple check & training events and other evaluations every year to prove my competence, even with 37 years of flying experience. It’s all part of the job, but to be honest, it’s a drag at times and something I have not missed while being stood down from flying for the last 12 months.
@Hugo RENAUT: Thanks for your interest.
If you look at the predicted paths of floating debris, even for those paths starting in the mid 30 southern latitudes along the 7th arc, the paths are generally to the north to warmer waters before and during the transit to the west across the Indian Ocean.
@DennisW, @Andrew: I think society tries to asses the risk to safety imposed by various professions, and re-certifications and continuing training are ways to minimize that risk. The risk is greater when the practitioner is making time-sensitive, independent decisions that affect lives, like a pilot, a surgeon, or an emergency medic.
As an engineer creating something for others to use, there are other ways risk is mitigated, like design reviews, safety reviews, certification stamps, etc. As an engineer, rarely have I had to make a quick, independent decision that affected safety.
@ Victor,
transit to the west across the Indian Ocean, methinks you meant.
@Victor
I agree; ongoing evaluation and training is definitely necessary for those of us in safety-critical roles, where we are often the last line of defence.
@George G: Yes. I meant to say transit to the west towards East Africa. I fixed the comment.
@Andrew @Victor
Good responses. Thank you. Sorry for being whiney. Perhaps the covid constraints which make CE much more difficult are getting to me.
As far as MH370 is concerned I am leaning farther South and wider as the best search plan. I remain annoyed by pic motive and mindset ignorance.
@Victor @Andrew
Yes, numerous studies support that in a stressful situation you depend most heavily on your training, not your thinking. Still, it is a pain the butt.
As a mathematician/physics guy I found it demeaning for an instructor to tell me “We are not training you to think. We are training you to follow the script.”
@Andrew: How much hand-flying under IMC does an airline pilot see other than in training in a simulator? That seems like the kind of skill that requires constant practice to retain proficiency.
In the Engineering world people are injured and or die when bridges, buildings, platforms collapse. There are process hazards that include fires, deflagrations, detonations, exposures to hazardous chemicals and radiation. People are injured and die from electrical hazards, arc-flash, electrocution, safety system failures. Planes trains and automotive have design faults that cause injury and death.
Code requirements in the USA vary by state and change constantly. US Federal codes and regulations are in constant flux. European and US codes differ so tech transfer is challenging and knowledge of both code realms is necessary. Hazard mitigation technologies improve and new better ways to solve old challenges come into play.
Training requirements for Professional Engineering licensure help keep engineering service providers up to date with current codes and best practices. Major disasters and fatal accidents drive change in codes and regulations to improve safety. It’s a constant improvement. Good to keep up, necessary to keep up.
@DennisW: This reference from Australia is a good summary as to why training for manual flying under IMC to counteract spatial disorientation is so important. The two videos included in the reference are excellent.
https://www.flightsafetyaustralia.com/2016/01/178-seconds-to-live-vfr-into-imc/
Thx, Victor.
@Victor
RE: ”How much hand-flying under IMC does an airline pilot see other than in training in a simulator?”
Not a lot! Many airline pilots do very little manual flying under IMC, except in the simulator during check & training events. It has become apparent that pilots need to do more manual flying to maintain their skills, but even so, many airlines discourage pilots from doing so in anything less than benign conditions. Indeed, there are stories of airlines that require their pilots to use the autopilot to the maximum extent possible.
Basic IF flying skills become ingrained with proper training; however, a pilot’s instrument scan rate tends to suffer without regular manual flying practice. That certainly affects manual flying accuracy, if not safety.
@Victor
I previously said ”The yaw damper on the B737 only helps with Dutch roll prevention, gust damping and turn coordination. There’s no rudder pedal movement and insufficient authority to counteract large thrust asymmetry.”
Note, that comment applies to aircraft with ‘conventional’ flight control systems and yaw dampers. Some FBW aircraft types have yaw damper functions or other design features that help control asymmetric yaw. For example, on Airbus FBW types, the yaw damper function will react to the side slip caused by asymmetric yaw. In the event of a thrust asymmetry, the flight control system maintains stabilised flight with a maximum bank angle around 5° without any pilot input. The yaw damper function on the B777 is more conventional, but, as you know, the TAC function helps control the yaw in the event of a thrust asymmetry. The B777 also has a wheel to rudder cross-tie function that will deflect the rudder up to 8°, to help control the initial effects of an engine failure using control wheel inputs only.
Re SJ182: The memory module to the CVR still has not been recovered. A preliminary report is due on or before Feb 8 that will reflect the data from the recovered FDR.
WSPR: Can it do longe range detection and possibly support tracking to help in search for MH370?
Monday, 2021.01.18 Icebreaker and exploration ship Polarstern arrived in Antarctica (WSPR Call Sign DP0POL/mm, 2 Airbus H145 helicopters D-HAOE and D-HAPS on board. They haul staff and goods for Antarctic winter season to Georg-von-Neumayer III station(WSPR Call Sign DP0GVN).
So lots of activity at the Northern boundary of Antarcica as well as unusual flights from Falkland Islands (737, VQ-BOS to CPT, business jet VPBLU to SEZ)passing over CPT, CPT to Troll airfield (QAT)with two Daussault Falcon 900EX, ZS-DEX,ZS-SCI flying from CPT to QAT and flying back North to CPT (Capetown).
Is it possible to detect aircraft from New Zealand (NZ), 180 degrees azimuth across Antarctica from a distance of app. 7.600 km distance on HF? The answer is yes!
Example: 2021.01.21 08:30 h to 9 h UTC(also other times) reception at ZL2005SWL in New Zealand (NZ) with app. SNR – 15 dB (very strong compa-red to other times at app. – 25 dB in average)and frequent detections on 10 MHz and 14 MHz. Both DP0POL and DP0GVN have been logged numerous times by ZL2005SWL in NZ.
Normally one big airliner has to be in the air close to the receiving station (in this case D0927, B747-87UF, at 2,375 ft from DHL, AKL to HKG, just lifting off from AKL Auckland airport, NZ,at 08:28 h UTC).
Receiving station, ZL2005SWL, in grid locator RE68mx, close to Nelson, at the Northern coastline of the Southern Island of NZ. In addition NZ289 AKL to CHC (B787-9, ZK-NZG) just about to pass over Nelson from the North at 40,000 feet. Tests from WSPR receivers in Australia will follow.
Refer to database http://www.wsprnet.org (Type DP0* in “Call”, ZL2005SWL or ZL20* as “Reporter”)! Goto FR24 and double check at Antarctica close to East of Troll station (QAT) at these time intervalls and you will see Falcon 900EX, ZS-DEX, flying North from the shoreline of Antarctica towards CPT.
Obviously there is a ADS-B receiver down there in the vicinity of 500 km (At Neumayer?, as you can also see the two helicopters commuting between ship Polarstern and GVN station numerous times during the week). There have been many days after 2020.12.30 with rare or no reception at all in NZ from DP0GVN.
The are also other examples (AI6VN/KH6 Hawaii). Research will continue!
Still looking for ADS-B data March 08, 2014. Busy week! Jan 26, 2021 Qantas will fly from PER to Antarctica McMurdo Station tourist round trip flight for app. 13 hrs. Last flight to that destination was on 2020.12.31 from MEL to MEL, 13 hrs.
Special flight LH2574, A350, on 2021.02.01, 13,700 km non-stop from Hamburg bringing 92 scientists and staff to Mount Pleasant Airfield exchanging ship crew of Polarstern and others. Return flight LH2575 to MUC on 2021.02.03. So lots of opportunities for long range WSPR tests. Tools in use are http://www.wsprnet.org, FR24, http://www.flightaware.com and http://www.voacap.com/hf.
After that back to MH370 research and application of lessons learned.
@Rob: You really may be on to something great. This could be a very promising lead on the MH370 search. Please keep us posted.
For your entertainment:
https://www.thesun.co.uk/news/13831291/new-book-malaysian-flight-mh370-shot-down/
@Victor
On the surface sounds much like the book a former blog participant was promising to write.
@TBill: For a long time I’ve suspected that FdC has been fed disinformation from intelligence and other sources. We’ll see whether any of her claims are backed by sources that are willing to go on the record. She and others tend to reject the most solid evidence we have (radar data, satellite data, debris data) and replace that with the weakest evidence we have (unsourced anecdotes and rumors). Now, if we have named sources that others can contact to verify the claims, that changes things.
@Victor
FdC is a journalist. You cannot trust a journalist in any matter. Their training and analytical skills are near zero. They are motivated by mouse clicks.
When your objective is to earn income through the sale of books or news articles, then there is a conflict of interest on whether the contents should be evidence based or be conspiracy based……….
@DennisW, @Nathan: Agreed.
Nathan: I hope the families understand the nature of this book.
Dennis: There are some investigative journalists that seek the truth. Miles O’Brien comes to mind. Florence de Changy is the polar opposite. 100% mouse click driven.
@airlandseaman: Miles took a lot of heat for talking about the simulator data, which he was aware of from government sources.
MH370 family member KS Narendran has received an advance copy of FdC’s book and offers a review:
https://linesabouttimes.wordpress.com/2021/01/25/mh370-credible-new-evidence/
Naren is skeptical of FdC’s proposed scenario, but is generally kind toward her efforts and the book.
To reject the satellite, radar, and debris evidence requires evidence even stronger than what we have. I am doubtful that exists, but without reading the book, I can’t know for sure. If that new evidence isn’t presented in the book, then others won’t be as generous as Naren.
I still suspect that FdC has been deliberately led astray by intelligence and other sources. There is cooperation but also rivalry between French and Five Eyes intelligence entities, and some of the more outlandish theories I’ve seen coming out of France finger the US and their Five Eyes allies as the culprits.
@Victor
I am bored I guess. When are we going to get DrB’s drift analytics? When are we going to get SJ182 FDR data? I need something to think about.
@DennisW: The drift analytics are going through another round of checking. Bobby would rather be late than be wrong. I understand your frustration, but I think his methods are sufficiently novel that they deserve the extra scrutiny. The documentation of the methods also is taking some time.
As for SJ182, we should know more on or before February 8. My very uninformed guess is the CVR memory module will not be found in time for inclusion in the preliminary report.
Victor,
Such articles are very unkind to the NOKs.
It digs up old pain and suffering without any solution or even rudimentary proof/verifiable fact.
The anger and vengeance builds up again as fingers are pointed at different parties.
This will never end until the plane is found and this madness brought to a closure.
@Victor
Sigh… Thank you. Sorry to be a pest.
@Nathan: I’m trying to be open and not condemn the book until I read it, because there may be some small pieces of the puzzle that are presented. However, based on Naren’s review, I’m not hopeful that any new information is revealed.
Bernie and MH370:
https://pbs.twimg.com/media/Esi1aw6U4AAYbUk?format=jpg&name=medium
@Victor
Bernie really likes those mittens.
https://www.japantimes.co.jp/news/2021/01/22/world/bernie-sanders-inauguration-meme/
@DennisW: It’s one of the few things everybody agrees on. Those memes are funny.
Another review of FdC’s book by The Telegraph:
https://www.telegraph.co.uk/news/0/really-happened-flight-mh370/
Based on this article, and without access to the book, here is the evidence she offers of a crash in the South China Sea:
1) Lack of a single radar image conclusively showing the plane heading west then south, even though two major military exercises were taking place near its alleged route. [The lack of publicly-released radar data showing the plane traveled south is true. This does not prove it crashed in the SCS.]
2) Contemporary Vietnamese news reports that the plane crashed in the South China Sea. [To evaluate the strength of this evidence, we need to see it, including sources and witnesses.]
3) A mysterious message from Vietnamese air traffic control to its Malaysian counterpart at 02:40 saying ‘the plane is landing’. [To evaluate the strength of this evidence, we need to see it, including sources and witnesses.]
4) Chinese media reports of an SOS from the pilot at 02:43 requesting an emergency landing because his plane was disintegrating. [These reports were based on a comment on Weibo from a fake account pretending to be the US Embassy. Years ago, in private communications, FdC explained to me why she believed the account was fake, and the comment was disinformation. I’m not sure why now she believes the comment is credible.]
5) Two large oil slicks allegedly spotted off Vietnam’s coast. [There is no specific link to MH370, especially in heavily-trafficked waters.]
6) Villagers and fishermen along Malaysia’s north-eastern coast reported unusual sights and sounds including explosions early that morning. [That’s not consistent with a shoot-down near Vietnam.]
7) New Zealand oil worker, Michael McKay, reported seeing a ‘burning plane’ in the sky from his platform off the southern tip of Vietnam. [There’s no definitive link to MH370, although at least here we have an identified witness.]
The strength of this evidence has to be compared with strength of the radar data (military and civilian), satellite data, and recovered debris. Her theory rests on the fabrication of all these data sets in a multi-agency, multi-national conspiracy.
@Victor
Re: your 1) [The lack of publicly-released radar data showing the plane traveled south is true. This does not prove it crashed in the SCS.]
We have the civil radar data (Leaked?) and military/civil radar data disclosed by Malaysia in a “sanitized” form. When you say not public released, we do have Malaysia reports showing that data, right? So the point being we do not complete disclosure of secret military data in a raw form, and although we do indeed have raw form of civil data, that is considered leaked info and not certified true (by conspiracy theorists)?
Of course we also have the cell phone call at Penang and sat data confirmation of radar path.
Regarding “3) A mysterious message from Vietnamese air traffic control to its Malaysian counterpart at 02:40 saying ‘the plane is landing’.”
This article provides more context:
https://www.the-sun.com/news/2197544/new-book-malaysian-flight-mh370-shot-down/
“At 2.37am, they told Kuala Lumpur control: ‘The aircraft is landing at (unintelligible).'”
“Two seconds later, Kuala Lumpur replied: ‘Say again. Say again for Malaysian 370.'”
One can track this exchange down to Appendix 1.18F of both Factual Information and the Safety Investigation Report. HCM ACC and KL ACC were communicating via direct line. For the first communication, “they” is HCM ACC. The second communication is mis-attributed to Kuala Lumpur but is, in fact, HCM ACC again. KL ACC was explaining to HCM ACC that, according to “the company” (MAS), the plane was still sending position reports, and, with some difficulty, KL passed along the most recent “position” (which turned out to be bogus.) The phrase “The aircraft is landing at …” may well be a transcription error, since it makes no sense in the context of the surrounding exchanges.
@TBill: I interpreted that item to mean there is no radar after 18:22 showing the plane did turn to the south, which is true.
@sk999: Thanks. Poor communication between ATC in KL and HCM added to the confusion of KL getting false info from MAS operations that the plane was over Cambodia.
I wonder if FdC tried to sort this out by interviewing the ATC personnel instead making assumptions about what they knew and what they intended to say. On the other hand, a book like this thrives on ambiguity.
Here’s a link to the SarawakReport, which reviewed FdC’s book.
https://us2.campaign-archive.com/?e=d1d431b4fb&u=57b26bbe9d2acafa19363b0d2&id=fa518261f5
Poor Florence. Whatever her intentions, she confuses so many facts that without hard evidence, it is hard to assign any credibility to whatever new information she believes she has uncovered.
@Victor
OK thanks…no radar for the FMT turn south.
@TBill says: January 31, 2021 at 9:20 am
@Victor OK thanks…no radar for the FMT turn south.
Victor Iannello says: January 27, 2021 at 10:45 am
It’s one of the few things everybody agrees on.
@Victor
…former MAS pilot/official comments on FdC. I like the way he definitively handles the issue of various purported radio contact with MH370: There were none. and garbled sounds “could be anything.”
https://focusmalaysia.my/top/mh370-changys-book-is-all-theories-assertions-all-over-the-place/?fbclid=IwAR3dynwcl1bIFXQQeBbBP6TaOcR8rgXDUOjST-z7oaD91tcejI25tTYWc7k
C’mon already. Where is the DrB drift analytics? Get on with it.
Chari Pattiaratchi believes the crash was close to Broken Ridge:
https://www.airlineratings.com/news/passenger-news/mh370-lies-southern-indian-ocean-says-oceanographic-expert/
MH370 and WSPR last week in January 2021:
It was a very busy week with so many aircraft and helicopters to be detected in Antarctica.
In addition now an Iljuschin IL-76TD-90VD, R-76503,flying from CPT to QAO as flight VI9018 and today back as VI9020 (today’s flight still to be analyzed). WSPR data from South Africa, New Zealand, South America etc. have been logged!
Flights from East to West (2021.01.29) in Antarctica and back to QAO by the IL-76. I had not seen the IL-76 in FR24 at first, but observed anomalies of WSPR signals in NZ and then studied FR24 just to detect the IL-76 in Antarctica on 2021.01.27 at 12 h UTC approaching Antarctica Northern shoreline from CPT .
Two Qantas sightseeing flights QF2902 on 2021.01.31 from MEL to MEL via Antarctica for 13 hrs. and QF2904 from PER to PER via Antarctica on “Australia Day” 2021.01.26.
Now at least 3 different jets have been detected (2 Dassault Falcon 900EX and now the IL-76)not regarding the Qantas 787s and maybe one out of 4 helicopters (D-H….from ship Polarstern; ZS-HNC, ZS-HND from QAS)in Antartica.
In addition airline LAN flights between SCL and SYD and retour approaching Antarctica when flying East to West (SCL to SYD).
So in summary HF WSPR long range detection of aircraft seems to work. Even some rules for possible detection of aircraft have been established.
I will not comment on contributions from FdC, Blaine Gibson and others recently.
Anyway there is one major thing that puzzles me.
There have been no flights JNB to PER for WSPR validation due to COVID-19 and I just got one by chance!
On 2020.11.13 I tracked Qantas repatriation flight QFA114 (B787)from JNB to PER passing close to IG’s estimated LEP. I had numerous HF WSPR signals from South Africa to Western Australia and vice versa during the whole flight duration as well as “major circle” detections more North to South. Nice signals all the time as expected from a textbook, also at 22:48 h UTC in the vicinity of IG’s LEP for MH370.
In contrast on March 07/08, 2014 I had almost none from South Africa. Surprising as March 2014 was close to the peak of solar cycle 24. So conditions for propagation were excellent. Some WSPR signals from South Africa before 21 h UTC. Strange? Admitted there were less WSPR stations than in 2020.
Maybe I have logged the U-turn around 17:20 h UTC with WSPR signals from Thailand and Southern Australia with frequency drift on the WSPR signals. More yet to be analyzed. App. 8 h flight duration of MH370 created a lot of data to be analyzed.
In order to validate assumptions I briefly started examination of SAR flights 2014 from ATSB west of Australia. Not a very detailed effort for SAR flights end of March 2014.
On April 1, 2014 I have logged WSPR signals from South Africa during the SAR missions in SIO searching for MH370 numerous times on that very day.
That really puzzles me if MH370 really was in the expected region of SIO (West of Australia) between 22 h UTC and 00:30 h UTC?
HF propagation conditions were good, many WSPR signals on 28 MHz from Japan and USA received in Australia at night, Europe earlier on 14 MHz, 7 MHz. If there is also backscatter in the ionosphere involved? Still to be resolved. There are DST reports from Australia on that issue not regarding MH370. In case of ionospheric backscatter or long path (LP) lots of possible LEPs close to IG’ LEP.
So an event such as the publishing of the book from FdC and the upcoming 7th anniversary of the disappearance of MH370 maybe a trigger to reconsider ones’s thoughts and assumptions?
@Rob@Victor
FdC, Chari Pattiaratchi,the IG’s latest analytics (all analytics for that matter) have a common theme – speculation with no attempt to address motive.
Lets consider a few facts and avoid mixing them with speculation.
1> Consider the “amazing tale of drifter 101703”.
This drifter is real and was recovered at Reunion Island within a week of the flaperon find at Reunion. What makes this drifter amazing is the fact that it crossed the 7th arc at 23.6S on the same day MH370 was lost. People who insist that latitudes North of the latitudes searched are not possible should at least recognize the problem that drifter 101703 creates for them.
2> The BFO at 18:25:27 is in perfect agreement with other data.
The other data, principally radar data, suggests an MH370 location of 6.8N 95.9E, a track of 296 degrees, and a ground speed of 510 knots. When one computes the BFO associated with those parameters the result is 142Hz – the value logged by Inmarsat at that time. This “coincidence” suggests the SDU was in a stable cabin environment, and the ADIRS was functioning properly. There is nothing to suggest the aircraft was depressurized prior to that time. The PAX were likely very much alive.
3> No qualified mental opinion of Shah suggests he was suicidal.
The prior history of his family and social interactions suggests he was happy and loving his life and profession. He was a Malaysian patriot extemely annoyed by the antics prime minister, Najib Razak, an advocate of action and a supporter of Anwar Ibrahim. “Democracy is dead.”
4> Most SIO flight paths have no opportunities for landing after the FMT.
Paths near 180S after the FMT have no “bailout”. These paths can only be associated with a murder-suicide mindset. A path towards the Cocos, first suggested by Victor, makes much more sense. That path flies past the Cocos and terminated near 22S on the 7th arc. Surprisingly close to the drifter 101703 arc crossing on March 8, 2014.
5> The median latitude of all the debris finds is 23.7S
Why not make the simple assumption that the debris will spread symmetrically in latitude as it makes its way West across the Indian Ocean? Of course, there may be some North or South current bias, but for the most part it is West.
@DennisW: Some questions and comments:
1) I agree that drifter 101703 deserves special attention. It is also unwise to put too much emphasis on a single drifter. As David Griffin says, the drift models predict 101703 would be an earlier than expected arrival, but not impossible.
2) Why do you accept the BFO at 18:25:27 (for which there were indications of a packet collision) and ignore the later, multiple BFOs which show a characteristic frequency trend of a warming oscillator?
3) The RMP pronounced that the captain showed no signs of abnormal behavior. This is the same RMP that said there was nothing suspicious about the simulator data and also said Najib did not steal from the 1MDB. Yet, just prior to the disappearance, the captain broke off a relationship with a woman (Tim Pardi) and her family he was close to, expressed his extreme frustration with the Najib regime, and also exhibited reckless online behavior. None of this proves the captain was unstable, but it is also untrue that there were not some signs that the captain was troubled.
4) The debris path is not one of fanning out from impact towards East Africa. Rather, for hypothetical southerly impact latitudes, the debris floats to the north along the 7th arc and then west across the Indian Ocean. In light of the complicated trajectory of debris, it’s simply too simplistic to take the average latitude of debris finds and declare that is the latitude of the impact.
@Victor
My post is simply referencing documented observables.
In my opinion drifter 101703 invalidates the IG drift analytics done to date. You cannot filter which data you will or will not accept.
The BFO at 18:25:27 is in perfect agreement with our best estimate of MH370 flight parameters using other data. The chance of the 18:25:27 BFO being corrupted is very close to zero.
I am not qualified to opine on Shah’s mental state. However, no qualified individual, including Littlefoot, has characterized him as suicidal.
Drift analytics are not capable of localizing the crash latitude. The median debris find latitude is as reasonable a postulate as any other. Recall the Cocos flight path and the ~22S termination is your suggestion.
https://mh370.radiantphysics.com/2018/06/08/an-mh370-flight-path-ending-further-north-on-7th-arc/
I will resist further commentary until DrB publishes his drift analytics.
@DennisW said: You cannot filter which data you will or will not accept.
Yet you accept the BFO at 18:25:27 (where there is evidence of corruption due to a packet collision) and reject the multiple, subsequent BFO values (where there is no evidence of corruption due to a packet collision and also a characteristic frequency trend of a warming oscillator).
I am not dismissing drifter 101703. I said it merits more attention. But I am also stating that it is a single drifter, and you can’t use it in isolation to predict the impact latitude.
@Victor
Yes, a single drifter is not a reliable impact latitude predictor. It is reliable to use it to reject claims of an impossible LEP North of 25S which is all I am using it for.
I am not rejecting the BFO values subsequent to 18:25:27. I simply do not have a sound explanation for them. Yes, there is evidence of corruption in the 18:25:27 Inmarsat data. Yet none of the other warm up logs presented by Dr. Holland show similar transient behavior (an initial accurate value followed by an abrupt rise and subsequent settling to normal). Sample 6 in his paper represents the data taken at Kuala Lumpur prior to MH370 departure. Indeed, it is very similar to the BFO log starting at 18:25:27, but without an initial accurate value.
Frankly, I think it is imprudent to reject that BFO value given the accurate agreement with other observables. Just my opinion.
I don’t think my comments represent “arm waving”. I regard them as reasonable interpretations of the observables.
@DennisW said:Yet none of the other warm up logs presented by Dr. Holland show similar transient behavior (an initial accurate value followed by an abrupt rise and subsequent settling to normal).
The other values in the Holland paper were not corrupted by a collision. You are rejecting multiple values after 18:25:27 in favor of one that is known to be suspicious because of the collision. And the final value in the sequence also agrees with the speed and track previously observed.
We’ve had this discussion before. I doubt we will resolve it now.
@all
Link to a Dr. Griffin web page. Interesting read.
http://www.marine.csiro.au/~griffin/MH370/
@Victor
AFAIK, we do not have Inmarsat data for the “other” logs presented in Dr. Holland’s paper. Do you have that data?
Yes, we are probably not going to resolve this issue. I am merely pointing out that it is not resolved.
@Rob
I sure don’t know much about WSPR, but as a test case, I believe there was flight EK425 departed Perth 8_march-2014 about 6AM and crossed Arc7 approx. 20-22 South about the same time as MH370 would have been there (had it gone that far north).
@TBill
WSPR was tried by a number of organizations for cell phone location. It was never shown to be able to work reliably.
Inmarsat was not designed for navigation, and we have run into similar difficulties.
We don’t have any data to infer the MH370 path from a system designed for navigation. We are grasping (flailing?) because of it. Time to face reality and toss in the towel. I have.
@victor
You need to make a new header post even if it is stupid, I will not critize it. Us folks with very limited rural bandwith find it takes a very long time to log in, and use your site.
OK, I admit I have a very low regard for your recent posts.
@Victor Iannello
Victor, regarding ‘Yet, just prior to the disappearance, the captain … and also exhibited reckless online behavior.‘
Do you know when the Captain’s online exchanges with the twin models ceased? I thought that his last postings on their FB page was in 2013.
@Victor
I am not rejecting the other values in the 18:25.27 log in. I simply do not have an explantion for them, and I am not going to fabricate an explanation – IG style.
Dennis: I’m surprised that a OCXO/TCXO guru like you is having difficulty with the 18:25.27 BFO value. It is a pure coincidence that the transmission at that time took place while the OCXO was still in the process of coming to thermal equilibrium. The frequency happened to be passing through the stable frequency operating point at that time, but was increasing at that time, then peaking, then decreasing over the next several minutes. We know this from prior data showing essentially the same warm-up frequency pattern. It is not an IG fabrication.
The following chart shows the 18:25 warmup compared to the previous cold start on the ramp at KL, circa 2014-03-07_12:50, available here:
http://bit.ly/2VJht2y
@Mick Gilbert: Throughout 2013, the captain made 97 Facebook comments directed at the twins, including invitations to meet him in Kuala Lumpur. That’s reckless behavior. The breakup with Tim Pardi occurred just prior to the disappearance, as I said.
@DennisW: As Mike said, there is no need for the IG to fabricate an explanation for the transient behavior of the BFO at 18:25 – 18:28. Ian Holland explains the values quite well based on the transient behavior observed at other power-ups.
I do agree it is time for another article.
@victor
Yes, please post another article.
@ALSM
I do not disagree with your analtytics with regard to the 18:25 login. I am merely expressing doubt about our understanding of that event.
@TBill: Thanks for the info: flight EK425, which time zone are you refering to with 6 am? I only use UTC, all the different time zones worldwide will drive you nuts otherwise.
EK flies the route PER to DXB on a daily basis, also ADB, DOH and other places, so just go to http://www.kiwisdr.com, select, map, choose a SDR, i.e. in Indonesia, such as SWLOI33, select WSPR in extension. Playing with a live WSPR receiver will give you more (optical et. al.) insights. You just need a PC and Internet access.
I recommend to start with s.th. like 6 pm UTC on 7 MHz, monitor the band and very likely you will see radio signals from PER, i.e. VK6CQ, and others popping up, when flights (refer to FR24) are heading out or in from the Western Australian shore line. Also signals from Thailand, Singapur, Australia, etc. can show up. I did that in the beginning dozens of times and for hours. Watch enormous signal strengths (SNR) when an aircraft is lifting off or landing in Jakarta. All of a sudden more signals from all directions will become observable. Unfortunately SWLOI33 was not connected to the WSPR database when SJ182 accident happened in the “front yard” of this WSPR KiwiSDR SWLOI33. Same for JORN on March 07/08, 2014, as it would certainly have located MH370.
I even did WSPR detections with the ISS, which is not the subject here.
You cannot just choose a target latitude and longitude in WSPR as it is no navigation system as Dennis remarks correctly. Transmission is 2 min. about every 10 minutes. As it is an HF system you have to take care of the ionosphere, that means frequency, season, solar cycle, solar flux, daytime, nighttime as with a OTH radar. So it is a bit challenging but it works. http://www.voacap.com/hf will support in these efforts. There you can choose the exact propagation conditions of the night when MH370 vanished as well as Grayline conditions for short path (SP) as well as long path (LP).
It is very helpful to play with the tools in order to develop a gut “feeling” for the WSPR system to assist in detecting aircraft, which is not the original purpose of WSPR (Weak Signal Propagation Reporter).
@DennisW: I have no clue how WSPR should work regarding the location of cell phones. You need a special coding of the transmitter and a special decoding algorithm for the required RF signal processing gain (up to 30 dB) which does not reside in the firmware,software of cellphones.
I agree with you Inmarsat and WSPR are not designed for navigation or better radio location or Direction finding purposes such as a radar, but we do not have better tools at the moment. WSPR comes closest to a multistatic OTH Radar (over-the-horizon) as the Australians (JORN)use it. You can see the Australian OTH Radar in WSPR when in operation (even in the Philippines, sometimes Hawaii). Many transmitters, many receivers, many antennas, lots of signal processing as the WSPR network does.
JORN (Jindalee Operational Radar Network).
I was sceptical myself a couple of months ago, but gained a lot of confidence after hundreds of live tests with aircraft in the vicinity as well as thousands of nm away.
Antarctica tests helped a lot as there normally will not be too many aircraft there (ranges >7.500 km)to get confused. Sometimes I can even predict what will happen next out of experience. That was the case with IL-76 in Antarctica which I did not see or realize initally, but just studied WSPR receive signals in NZ. Admitted, random effects can happen but statistics are in favor of my observations, just too many aircraft detections over the last couple of weeks.
All sources are open: http://www.wsprnet.org,(WSPR database since 2008),www.kiwisdr.com (app. 550 WSPR receivers worldwide with Internet access),www.voacap.com/hf (HF propagation tool), http://www.flightradar24.com, http://www.flightaware.com,…...
So use the tools and sources, gain your own experience and I will be very happy to discuss WSPR and MH370 related issues as close to a scientific procedure as possible. I will not participate in discussions on conspiracy, rumours etc, even if they seem to be entertaining occassionally.
In summary: WSPR might be able to provide some physical clues. I was searching for IG LEP for months. The results of flight QFA114 in the vicinity of IG LEP, the coarse (quick and dirty) detection results in WSPR on April 1, 2014 (SAR ATSB flight mission) from South Africa and no WSPR signals from South Africa between 22 h UTC and 1 am UTC in the night March 07./08., 2014 make me wonder.
I will continue in that region but from now on will also focus more towards the region around Christmas Island. There we have at least one WSPR signal around midnight from Thailand to PER in that very night as far as I remember. The RF trajectory just goes thru the Christmas Island region. We will see and look for more (joint or common?!)progress.
This live Blog helped a lot for better understanding the various techniques, findings and issues related to flight MH370! Still struggling with some acronyms. As I mentioned before I’m still a rookie with 7 months of experience now on MH370. Thank you very much!
Support and assistance (still lacking good ADS-B, ADS-S data in 2014)in addition to criticism will be greatly appreciated. Good luck to all of you in 2021! Stay safe!
I have followed this discussion for a number of years.
I have extensive background in Radar and EW. (Cold Warrior).
Is anyone here willing to explore a totally different theory from **anything** yet in print? One supported to a perfection by data and timing?
I will warn up front – the implications of this theory involve some very spooky actors at the highest possible levels. Tom Clancy stuff, even…
What was known more than three weeks before the loss – was that there *would be a loss*, resulting in stock price spikes for IRSN – the competitor of Freescale… (Look it up.)
Also of note: The price of silver peaked for a three year window, on exactly 3/11… (Look it up.)
Is there interest here for something new – that’s actually old?
WAH 2/2/21
@Rob: Follow the data, and don’t be discouraged if you see nothing near the LEP. I think it would be really cool if you detected something further north along the 7th arc near where Ed Anderson detected the seismic event. That would be a coincidence that would be very hard to ignore.
@WA Harrington: Yes, we would definitely be interested in some new ideas. Just look at the great ongoing work by @Rob and Ed Anderson, who are both using novel techniques to estimate the point of impact.
That said, if we need to dismiss the best evidence we have (radar data, satellite data, recovered debris), the rationale for doing so would need to be very strong.
@Victor Iannello
Thanks Victor, I’m well aware of the 97 FB posts in 2013.
What I asked you was ‘Do you know when the Captain’s online exchanges with the twin models ceased?‘ Do you know the date of the 97th and last FB post?
@Mick Gilbert: I hope you are asking the question because you truly don’t know the answer.
I don’t know the date of the last post to the twins, nor do I think it matters if the captain was radio silent in the months before disappearance. The 97 comments in 2013, including invitations to visit Kuala Lumpur, means he had issues. On the other hand, we know that the break with Tim Pardi’s family occurred in the weeks prior to the disappearance, which is what I said. You truncated my comment with ellipses in a way that implied I said something I did not.
@Rob
I assume you have access to archived WSPR data from 7th-8th March 2014. I have details of flights across the Indian Ocean and their crossing time at the western boundary of the Melbourne FIR in this period. Should that information be useful please indicate that to Victor so that he might pass an email contact to me.
@all,
I am curious about this latest ‘account’ of the MH370 saga that is to be published in the UK, Feb 4th.
Is the readership here aware of any contact from the author, alleged to be an award winning investigative journalist, to aid their research while writing the book?
@Don Thompson: It’s been some years since I have exchanged information with Florence de Changy. She knows that I am not a fan of her theory.
@Don Thompson: Yes, I do have the WSPR data of that night, public access is available at http://www.wsprnet.org in section “download”
Any reference data are more than welcome! Victor has the email contact.
Thanks a lot!
@Rob, @VictorI,
Your WSPR detection near midnight around Christmas Island is VERY interesting. Plotting a great circle from Perth past my plane position around midnight would point to western Thailand. Finer maidenhead grid squares and an exact time would let me figure the error distance.
I’ve explored your links, and now awaiting WSPRnet approval for db access.
Details on my flight path timing are here: https://370Location.org
(Endpoint may shift west if a Java signal at 00:12:30 UTC is a surface impact).
Thanks for your WSPR work, and I really hope you’re onto something!
Ed Anderson – KE6IZN
@Victor Iannello
Thank you Victor, I don’t make a habit of asking questions that I already know the answer to.
In terms of what you wrote, it was ‘Yet, just prior to the disappearance, the captain broke off a relationship with a woman (Tim Pardi) and her family he was close to, expressed his extreme frustration with the Najib regime, and also exhibited reckless online behavior.‘
To state the blindingly obvious, you stipulated a time-based condition -‘just prior to the disappearance‘ – and then rattled off three events. Any ordinary reading of that sentence would lead someone to believe that all three occurred ‘just prior to the disappearance‘.
Two of those events did not, one of them occurred about twelve months prior and the other ceased at least three months prior.
Your statement was misleading; kindly don’t accuse me of contorting it to imply you said something different.
@Mick Gilbert: Whether or not it was intentional, you edited my sentence and changed the meaning I intended. I am a very good judge of what meaning I intended. Period.
@VictorI@Mick
No point in getting abrasive here. Mick is a well-respected contributor here, and I have no doubt he did not intend to contort your meaning.
The IG is losing credibility fairly rapidly. Your analytics ignore the 40%+ information theory advantage of searching areas not already searched. You ignore the likelyhood of debris being deposited in WA from a crash site in the 30S to 35S latitude range – a shore area more aggressively searched than any other SIO shoreline. Might be time to reset your thinking.
@DennisW said: Might be time to reset your thinking.
I’m open to new ideas based on facts and data. I am very interested to see whether the WSPR propagation anomalies coincide with the seismic event. Running over the same old data has us stalled for some time.
@VictorI
Yes, WSPR (known as RFPM, RF pattern matching in a previous decade) analytics are interesting. Back in the day when cell phone location was a hot button with the FCC it was investigated by a number of organziations. To the best of my knowledge it has never been successfully implemented.
https://transition.fcc.gov/bureaus/pshs/docs/summits/911%20Location%20Acuracy/Norman_Shaw.pdf
@Victor
Here is a paper from me on latest thoughts re: sim data. I embarked on this effort in a “final” attempt to determine if the sim data held any clues (flight path etc) to help the search.
Although the interpretation/speculation is mine, I have been collaborating with Mick Gilbert who has made a number of findings/inferences from the data.
New_Interpretations_ of_the_Pilots_Flight_Sim_Studies
WSPR idea followers:
I confess, I still don’t quite understand how WSPR historical reports can help find the MH370 POI. But I’m willing to try. To that end, I downloaded the WSPR data for March 2014. The file was so large I could not open it in Excel. So I opened it in a text reader and zoomed in on the data for March 7th, then copied a 26 hr segment to Excel. This file covers 2014-03-07 00:00 to 2014-03-08 02:00. If you are interested in WSPR, starting here will save you some time. http://bit.ly/3cFWJCZ
@TBill: I don’t really understand your inferences about fuel. You believe enough fuel was loaded to reach the South Pole, but then the remaining fuel was removed (either by jettison or a manual change in simulation parameters) and the plane moved to 45S1. Why would he do this, and what insights does it provide?
@370Location: Hello Ed, thanks for your interest. You should not need any approval from http://www.wsprnet.org to get access to the database (download section).
Anyway please send me an email via Victor and you can get access to my own database with comments already included and major data extracted. In addition I wrote a preliminary working paper as a draft version on the whole subject of WSPR and MH370. Work in progress.
The event you are refering to happened at 00:36 h UTC. It is one specific out of many. WSPR might also contribute to estimation of the final time regarding end of flight MH370.
HS0ZKM (Thailand) in OK03gr sent a WSPR signal (strength 37 dBm) on 14.097146 MHz that was received bei VK6ZRY in OF78vd (Perth) at noise level threshold with SNR: -30 dB. Frequency drift 0; 5,323 km distance; VK6ZRY at 162 degree azimuth from HS0ZKM.
How to interpret the signal? Probably s.th. was up in the air along that line between transmitter and receiver. The signal path trajectory passes the Christmas Island area, but please do not conclude, the event necessarily happened there. One will easily fall victim to one’s own wishful thinking.
Could have been anywhere between Thailand and Western Australia more or less along that line. Major airports such as SIN are located along that line, so please keep that in mind.
The surprise is it happened only once during the whole flight duration, so I will exclude these busy airports. An aircraft with changing aspect angles could cause such a signal.
It is the only signal of its kind but there are many more at that time period in other areas, especially between Tasmania (VK7)and PER (VK6). An additional class of signals is from North America (USA) at 28 MHz to Australia (excluded for the time being as they are difficult to interpret for the case of MH370 before and at sunrise).
These signals below 28 MHz are either due to air traffic between PER and MEL, ADL, SYD, HOB or if backscatter really occured they could be “reflected” from MH370 at IG LEP, but this is a very complicated scenario based on specific interpretation of the ionosphere and backscattering of the B777. In the moment I regard it as unlikely.
On the other hand these signals did not show up all day long, probably MUF took care of that at 28 MHz (MUF: maximum useable frequency is lower at night).
Validation: Just recently I did tests with flight QFA2902 (B787 heading North from Antarctica towards PER) a sightseeing flight to and from Antarctica on Australia Day with JH3APN in Japan as receiver(was also on the air in that night of tragedy in 2014) and VK6CQ in PER as transmitter.
Reception in Japan was influenced by QFA2902 at a distance of greater 1,000 km South of PER (remaining flight time 1.5 hrs) or less. Other tests exist with flights from PER to HKG between the flight sections Western Australia and Java. Aircraft, Transmitter and receiver form a trajectory up to a certain degree.
I’m working on an interpretation. Help from experts on RCS at HF, HF propagation and ionosphere will be more than welcome. ADS-B data or other location data of the area as reference for that day would be deeply appreciated.
In addition one (maybe interesting) remark to FdC’s book to be published these days:
Regarding FdC and statements regarding a non existing U-turn around 17:20 h UTC, in case I understand the quoted statements correctly:
WSPR data comprize app. 300.000 lines with connections worldwide during flight duration of MH370. Probably 95 % or more are of no value for our research. Difficult to identify the important ones. Anyway:
At 17:22 h UTC HS0ZKM (same station as above) in Thailand was received in Australia by VK3DXE (MEL) and VK1CH (SYD) simultaneously with a frequency drift of -1 Hz/min..
Frequency drift can happen by aircraft changing their headings as can be easily validated on aircraft flying holding patterns or after take off, i.e in MEL (take off to the West and heading in North Eastern direction) , with rapidly changing heading causing variations in Doppler frequencies (drift in Hz/min.). If drifts are more than app. 4-10 Hz/min the WSPR algorithm will no longer be able to decode the receive signal. Happens every day numerous times. So the amount of data in the WSPR database represents app. 50 % of all WSPR signals that occured in reality (decodes and non decodes).
Proof of statement: Monitor several KiwiSDRs in WSPR mode in Oceania detecting the signal in demand, at least one SDR (often residing in the Philippines) will decode the signal in question). Watch for non decodes having awkward and odd shapes (should be straight vertical line). Very often observed in NZ on WSPR signals close to MEL “distorted” by the flight pattern of the aircraft after take off (www.kiwisdr.com).
Before that very event previous reception of HS0ZKM at 17:10 h UTC by both stations in Australia there was no drift, next reception after the event at 17:26 h UTC also no drift recorded.
As a consequence we might have observed the U-turn of MH370 at 17:22 h UTC (keep in mind duration of WSPR transmitt signal is 2 min.) Sequence of tranmission period app. every 6 to 10 min. cannot be influenced by third parties. So we cannot nail down an exact time, although most WSPR SDRs are controlled by GPS signals. Illustration and verification of the individual trajectories were done using http://www.voacap.com/hf
So, in conclusion please make up your own mind. That’s it for the day.
Thank you very much for your interest and good luck! Stay safe!
@Rob:
Thanks for the details on the WSPR detection. The path is compatible, but unfortunately the time of 00:36:00 (00:35:00 center of 2 min transmit window) puts the bounce some 15 minutes after the last response from the plane at 00:19:37.
That 00:36:0 signal might be compatible with the plane flying a hold pattern off the Java coast before a late ditching, but the consensus points to fuel exhaustion and power interruption triggering the last SDU logon.
The Melbourne and Sydney detections are a bit east of IGARI, but I suspect there is some allowance for bounce with an angular deflection. Any evidence for consecutive aircraft bounce detections?.
I have the Mar 2014 database now, and will sift through the data for detections that might coincide with any aircraft over the SIO.
I’m intrigued by your WSPR research, and hold out hope that there might be an earlier skip signal (with doppler) seen over the SIO.
You’re most welcome to connect via the contact form on my website, and we can follow up by email from there.
— Ed Anderson – KE6IZN
It’s incredible how many amateur radio operators are contributing here. I’m AJ4AQ, have an SDR, and have made many contacts on the HF bands, although I am less active in recent years. Mike and Sid also have talked about their past interests in ham radio.
@Rob, @370Location:
I also took interest in the WSPR research, though HF propagation in atmosphere is not really my area of expertise.
I noticed that the signal to noise ratio at 2014/03/07 22:46:00 between HB9CZF (Switzerland)and VK6ZRY (Perth) is a bit higher than the other signals between the same transmitter and receiver. The great circle path between them also happens to go less than 10nm from the estimated position of MH370 at that time (16.12S, 97.46E) according to my fit to the BTO/BFO data (towards NZPG, 7th arc crossing at 27.55S, 100.17E).
Is this what we should be looking for when sifting through the WSPR database for that night?
Also thanks @airandseaman. Your Excel file of the relevant segment of the WSPR data did saved me some time.
@Victor
I started my ham endeavors with vacuum tubes. Have not touched the hobby for 50 years. 🙂
All vacuum tubes back then. 572Bs and 4CX1000s for linear apps.
@Victor
Speculation, but seems to me there is a basic Plan A design to head towards the Magnetic South Pole from 1090E, and ZS knows that fuel requirement. There is also an apparent plan design to jettison excess fuel, to end flight at 45S1 or other end point (which could depend on flight, fuel available, time of day etc.). ZS knows he will be jettison fuel anyways so just being directional on fuel loading for MH150. Plan A seems to circumvent Sabang radar by going out to 1090E(eg; during daytime).
MH370 was Plan B – not circumventing Sabang radar. MH370 case has less fuel thus fuel jettison may not be part of that plan.
Linear amps with vacuum tubes are still very common. I have one with 4 811As that I upgraded to 4 572Bs. Without an upgrade in power supply, it puts out 800W PEP on a good day.
@TBill: I appreciate what you are trying to do, but it makes no sense to me. What we know is he selected a point in the SIO with no fuel and then manually selected a lower altitude. I don’t see the tie-in to reaching the Magnetic South Pole, nor do I see how you can prove it.
@Arto L: Thanks for your interest in the WSPR data. I think if enough of us continue to ask questions, we can help @Rob determine if there is anything there of value.
For my sr yr HS independent study project, I built a linear with 4x572Bs in grounded grid config. Home brew 3000vdc supply. Easy 2000 w pep. My science teacher had no clue what I did, but gave me an A. 1000s of phone patches with Pacific islanders, Antarctica, military ships, hospital ships, etc.
@ALSM
I think the internet has dampened interest in ham radio. I don’t need a license to make a post. Plus that, it is much more convenient. I realize that a major catastrophe is better responded to by ham radio, but I am ready to “fold up my tent” in the event of a major catastrope, I am not in the survivlist camp.
@Victor, @TBill:
Bill’s analysis shows that the sim route may have been using CMH180 instead of LNAV towards NZPG, as the two paths intersect at 45S1. However, in MH370 case CMH180 will only fit the BTO if the plane slowed down (descended) at least 20 min before 6th arc. Otherwise the plane would have reached arcs 6 and 7 too early.
Bill mentioned at Twitter that a possible reason for such a descent would be to prevent contrails that could have been seen from passing ships (if it wasn’t for the clouds) or other aircraft in the area after sunrise. This would of course require either active piloting late into the flight or Z programming the descent into the FMC beforehand. I suppose it is possible.
@DennisW said I realize that a major catastrophe is better responded to by ham radio, but I am ready to “fold up my tent” in the event of a major catastrope, I am not in the survivlist camp.
When the land-based telephone system goes down, there’s still satellite phone. My observation is that during natural disasters, the hams try to make themselves useful, but they don’t help much. Yes, there could be a REALLY big disaster in which only hams running on portable power are able to communicate, but in that case we are all screwed in so many more ways than just communication.
Driven by internet connectivity and cell phones, amateur radio is a dying hobby. It used to be a thrill to make contacts with people from around the world. No longer.
@Arto L
Thank you.
I see a number of possible reasons for descent after Arc5. But twilight is happening by 23:00 and there are very high winds aloft below 22 South.
I see the WSPR signals are impacted by weather and time of day, so I would ask if the high winds are a factor for the areas below 22 South.
Before I wrote the new analysis, I was working on another paper suggesting the apparent “straightness” of the MH370 path was possibly due to steps taken by the pilot to address the high winds below 22 South. That’s when I realized I wanted to know the exact date the sim planning studies were run, and that’s when I decided to re-analyze the sim data.
@TBill:
I’m not really sure how weather and winds affect the WSPR signals, but I would expect the effect to be minor. Thunderstorms and lightning could certainly lead to increased background noise, thus I would expect largest weather related effects on signals that pass through the equator or day/night terminator.
Time of the day and space weather on the other hand are major factors due to their effects on the ionosphere. I took a quick look at the GOES data (Geostationary Operational Environmental Satellites) for March 7th 2014, and space weather conditions appear fairly quiet and stable that day, considering it was during the solar maximum. Just two minor C-class X-ray flares and no significant solar energetic particle events. A typical period of relative quiet during the maximum.
You can find the full archives of GOES data from the link below:
https://www.ngdc.noaa.gov/stp/satellite/goes/index.html
Been sometime since I read posts on this forum. Has there been any further confirmed debris finds.
@Comments: Unfortunately had no time to work on all the comments yet.
WSPR: For those interested, there will be 3 occasions in February to do some testing with WSPR, aircraft and Antarctica.
Sunday, 2021.02.07 Qantas will conduct an Antarctica roundtrip sightseeing flight B787 from BNE, most likely towards McMurdo station and back to BNE for 13 hrs. Flight will be in daylight so very very early morning in UTC.
You can monitor the aircraft’s position in Antarctica on FR24 as the aircraft will have ADS-B for satellite communication (blue aircraft symbol in FR24).
http://www.wsprnet.org: Look at ZL2005SWL as “Reporter” in New Zealand and DP0GVN at the opposite side of Antarctica as “Call” in http://www.wsprnet.org. Normally ZL2005SWL in NZ will not receive the exploration station NeumayerIII at a distance of app. 7,500 km at the Northern shoreline of Antarctica.
Try to see live WSPR signals as on a spectral analyzer using the global KiwiSDR network at http://www.kiwisdr.com. Set “extensions” at the lower right to WSPR and select 20 m on the window popping up.
On 2021.01.31 the B787 from Qantas QFA2902 MEL to MEL via Antarctica in the morning and in the afternoon an Iljuschin IL-76TD doing a roundtrip flight from QAO (Russian station in Antarctica) were detected in WSPR by ZL2005SWL monitoring DP0GVN.
This time the B787 from Qantas will enable the propagation path on HF (14 MHz) between DP0GVN and ZL2005SWL as it will approach the direct trajectory between transmitter and receiver, if the ionosphere will cooperate on Sunday.
Special issue on Sunday: Icebreaker Polarstern having WSPR station DP0POL on board is heading from Falkland Islands to QAN (NeumayerIII station). So there will be two WSPR stations in the Antarctic region this time. Watch the signals from DP0POL in Hawaii at AI6VN/KH6 with aircraft from Tahiti and other places.
FR24 and wsprnet.org have playback functions so no need to get up in the middle of the night unless you want to see real WSPR signals at http://www.kiwisdr.com.
These tests up to now (amongst others such as AF447, MH17 et al.)have proven that long range WSPR detection of aircraft is feasible. Next step is to apply lessons learned to MH370, i.e. U-turn and other events during the entire flight duration.
@Rob
The WSPR approach to location has been carefully looked at by a number of very well-qualified organizations who have never been able to commercialize the approach. It is going nowhere. You are beating on a dead horse.
Dennis: Re “The WSPR approach to location has been carefully looked at by a number of very well-qualified organizations who have never been able to commercialize the approach.”
This sounds like a disconnect. Are we talking about the same technologies? I am not aware of anything remotely similar to the WSPR technology that was ever studied for use as a Cellular location method. Can you elaborate?
As I understand it, WSPR technology has been used for EME and meteorburst communication (using meteors and the moon as passive reflectors). Passive reflections off aircraft have also been observed. This is apparently what Rob is studying. How could passive reflection observations off of anything be used in connection to cellular location?
@Mike
I did try to elaborate with the post to links to rf finger printing. I won’t repeat it.
Not all vacuum tubes 50 years ago. More than 50 years ago I build a single [vacuum] tube linear amplifier on 144 Mhz. 30W RMS output. Everything else I built was solid state. 14Mhz receiver with FET front-end, which I still have, Tx and Rx on 144Mhz, and converters for 144, 432 and 1296. To lazy to learn Morse properly. Learned a lot about electronics and antennae though.
Dennis: RFPM is not anything like WSPR. Completely different.
@Hams!
Ah, the olfactory memories of painless RF singe. I was very lucky at age 14 to be taken under the wing of the Bell Labs ham club. I’d already built a keyer, (still can’t write cursive after block print to 40 wpm), and had found an old teletype. The Labs club project became a PLL chip RTTY decoder, on our own circuit board layout (full labs access, including PDP8’s!). Spare money in high school as a chimney monkey installing TV antennas, and fixing whatever that came in the door of the repair shop. HS AV geek. Hidden transmitter foxhunts as soon as I could drive. RFI made me nocturnal, with a wall of DX QSL cards. RFI also killed the hobby as an urban dweller, until I got hooked into relaying AMSAT for my buds’ Antarctic expedition.
Yes, it’s ironic that the internet now has me blocking spam from exotic locations.
It doesn’t surprise me how many engineers and scientists have dabbled in ham radio.
— Ed – OM KE6IZN (YM WB9KGJ)
@ALSM
I would invite you to provide an example of WSPR use for location estimation. It would be a “jump start” to my understanding.
Dennis: I never suggested that WSPR can be used for location estimation. Frankly, I don’t think it can. But I am interested to learn more about Rob’s quest.
What I did say was that your suggestion that RFPM and WSPR were somehow equivalent was not a fair comparison. RFPM is basically a failed attempt to use a catalog of a priori urban multipath data to improve location by triangulation from cellular towers. That technology involved cell phone location using active round trip time measurements from multiple towers to locate a cell phone (adjusted for multipath). OTOH, WSPR involves the detection of passive reflections (off of aircraft, the moon, etc.) of a low power spread spectrum packet sent by one amateur radio station and received by another. There is no “triangulation” involved, which is why I have doubts about it having any use for finding MH370. It appears that aircraft reflections of WSPR transmissions have indeed been observed, but there is no way to know where the aircraft was along the ray path. At least, that is my initial understanding. I’m hoping Rob can help me understand what he is doing with the data that could shed more light.
Triangulation is not possible from a single transmitter/receiver pair, but if we could detect an aircraft crossing the transmission path, and then relate that to the presence or absence of MH370, that could be significant, especially if detection occurs across a path where there is not a lot of aircraft traffic.
@ALSM
South Koreans made a lot of effort to use RFPM with TV signals, paging towers, radio stations,… and, of course, cell signals. The basic idea was that the RF environment is location dependent. It is, but trying to use that collection of signatures to locate a receiving device proved to be too difficult and unreliable even with a large readily accessible database. As usual, I am guilty of assuming that if I never heard of something it does not fall into the “useful” domain. Sorry, the ravages of age.
Victor: Agreed. I’m still interested in WSPR. But it will be very challenging to derive any useful info.
In general, the direct end-to-end VHF/UHF/microwave path is limited to about 800 km max for an aircraft at FL400 reflecting the signal. I can see some possibilities in this case, using direct rays. But we need much longer range. HF (10, 15, 20m…), signals reflected multiple times by the ionosphere, propagate much further. But detection of aircraft reflections at such long wavelengths seems unlikely at best, and even if it did happen, I don’t see how to extract any location information from such a signal reflected many times by the ionosphere.
@VictorI
You might be able to combine a timed TX/RX WSPR observation with ring info to infer a position. Still, as Mike says, it seems very dicey to me.
Flight QFA2906, VH-ZND, B787-9, from BNE to BNE on its way South to Antarctica heading towards McMurdo station.
@Rob
So, tell us what you are doing. Post a paper so we can contribute.
Rob: Why are you interested in QFA2906? Why that flight specifically?
Rob: FR24 has no record for the QFA2906 flight.
QF2906 works. Currently flying the coast of Antarctica.
QF2906 just landed back at YBBN.
Flight log:
https://www.radarbox.com/data/flights/QF2906/1530673783/log
@Victor
FdC bogus claims from the Curator radio show (link on her Twitter):
I. No U-turn IGARI
a. The Xponder was jammed. The Thailand/Vietnam/Malaysia loss of XPONDER signal was separated by 37 seconds which would have been instantaneous if XPONDER was Switched off by the Captain. USA AWACS aircraft (two) in the area have phenomenal jamming capability, she has been told.
b. U-Turn as recorded by radar is impossible to conduct by a B777
c. Certain experts agree the radar track over Malaysia is a smaller/faster plane and not a B777
d. Vietnam primary radar definitively captured MH370 at BITOD, thus proving no U-Turn at IGARI
e. Butterworth joint military base was on-call to intercept any wayward aircraft within minutes, and this did not happen
f. No other Country’s radar saw MH370 (Indonesia etc) and FdC rejects as an invalid excuse that the radars were not operating at that hour.
II. Inmarsat Data is Invalid
a. There is absolutely no corroboration of the Inmarsat inferred flight path (no eyewitness and FdC of course rejects the SIO debris findings)
b. Inmarsat’s technique to analyze BTO/BFO is “unheard of” has not been proven correct
https://monocle.com/radio/shows/the-curator/486/
QF2906 took off from Brisbane (east coast of Australia) and went south towards McMurdo Station and returned to Brisbane. I don’t understand how path would intersect the same transmission path used to detect MH370 off the west coast of Australia.
https://www.flightradar24.com/data/flights/qf2906#26c399fe
@TBill: I have a copy of the book. There is so much to say that I can’t summarize it in a single comment.
I’ll start with saying that I am the source of her claims about the impossible U-turn at IGARI. In Sept 2015, I wrote a paper with comments and questions before we had any civilian radar data. The questions relative to the sharp turn were:
Q4: The depiction of the turn after IGARI as a sharp turn to the left seems to be beyond the performance limitations of a B777. Was the turn accurately depicted in Figure 2 of the ATSB report [4] from June 26, 2014?
Q5: Is it possible that the sharp turn to the left after IGARI is actually the crossing of the radar returns from two aircraft?
In the Safety Investigation Report released in July 2018, there are descriptions of simulations performed by Malaysian investigators using “entry and exit waypoints” for the turn at IGARI. They conclude that flying over those waypoints requires a bank angle greater than what can be performed on autopilot (25 deg), and therefore the turn was hand-flown. So the Malaysians essentially said the turn was within the performance limits of a B777.
I performed my own simple simulation of the turn using the FSX/PMDG777 model. Assuming the turn started a bit before the entry waypoint, and assigning small position errors to each waypoint, I showed that the turn could be flown with the autopilot engaged with a selected bank angle of 25 deg, and that path aligns with the start of the civilian primary radar data from Kota Bharu. Others like Paul Smithson have come to similar conclusions.
In summary, I believe the turn at IGARI that has been graphically depicted is only a qualitative sketch that filled in the dots between sparse and inaccurate radar captures. The Malaysians won’t release the actual military radar data, so speculation about that sharp turn continues. I suspect the simulations performed by the Malaysians were designed to at least partially squelch those claims about the impossible turn.
@airlandseaman:
Good question! I was always interested in the fate of MH370 as I still do not understand and wonder how a modern airliner can just disappear!?
In February 2020 I started WSPR activities as I did not want to struggle with neighbors due to antenna towers, beams, PA, BCI, TVI,….and also stay under 10 Watt EIRP in order to avoid the hazzle with documenting safety features requested by the authorities with regard to possible radiation hazards. Man-made noise was another issue.
WSPR (Weak Signal Propagation Reporter) was designed by Joe Taylor, K1JT, physics Nobel laureate in 2008. Primarily it is not a communication tool but for propagation tests. It also provides the only permanent database for links in ham radio since 2008. Otherwise the work on MH370 app. 7 years into the past would not be feasable. It is not suited for Meteor scatter etc. as the transmitt slot is too long, therefore you better choose MSK144, JT-65 and other modes. EME will work.
I was really surprised to cover more than 10,000 miles with 100 mW on 20 m and other bands, just with simple end fed wire antennas and it was fun to reach all continents. That is the result of up to 30 dB signal processing gain due to small bandwith of 6 Hz and other features.
You can also do 2-way WSPR if the receiving station responds within minutes or hours. There is even a daily ranking list of the Top 2-way-WSPR stations in existence by KB9AMG. More data will be exchanged than in FT8 (TX power of transmitting station). WSPR is not suited for rag chewing.
Mid July 2020 just by chance I read an online article in Daily Mirror on the disappearance of MH370 and the current status. In that moment it hit my mind: Why not use WSPR as a poor man’s multistatic passive OTH radar? Just as a substitute for JORN? So, I was hooked on the idea and started tests with aircraft nearby and the ISS. Outcome was promising.
Reason for QFA2906: I was looking for long haul flights over open water. My first and longest were SIA478/SIA479 SIN JNB and retour with Kiwi SDR live WSPR receivers in South Africa, Reunion, Indonesia,Australia, Philippines etc. Longest path regarding aircraft detection was ZS3D, ZS3RF as TX in South Africa and AI6VN/KH6 as RX on the island of Maui. It worked especially on 40 m. The problem was: Do I see and detect the one and only aircraft that I am looking for.
That is the reason I choose Antarctica. There are not too many aircraft down there. Less than a year ago these tests would not have been possible as there were no ADS-B receivers for reference. FR24 installed a couple of them at the Northern shoreline of Antarctica in the second half of 2020. In addition I wanted flights heading 180 degrees South.
There are promising papers on HF RCS by DST (Australian Defence Science and Technology or s.th. like that). Many other scientific papers on ionosphere at mid-latitude from Australia, Russia, Italy etc. (see also hamscience.org and tapr.org).
The sightseeing flights from Australia to Antarcica (antarctica.com.au) are a good training exercise. The window of opportunity is now before Antarctic winter will come. QFA2906 was my 4th flight of B787-9.
Interim results of tests in Antarctica, mainly ZL2005SWL as receiver (RX) and NeumayerIII exploration station DP0GVN, DP0GVN-1 (TX) as well as Icebreaker Polarstern DP0POL/mm (also detected in summer 2020 close to the North Pole).
Detection range > 7,500 km from NZ just across Antarctica on various days, as described before: 2 Dassault Falcon 900 EX from South Africa, 1 IL-76TD from Russia, 1 DC3C commuting airplane between Russian, Norwegian and German stations in Antarctica, maybe a helicopter from Polarstern and B787. Some of them numerous times at different days. Busy time now, crews at the stations will be exchanged now before Antarctic winter is coming. Then no more air traffic down there.
I do have a draft of a preliminary working paper, anyway intensive testing now and writing simulteanously does not work. Much more investigation on the MH370 stored data will have to be done, just as analyzing TX station HB9CZF which was received by VK6ZRY for hours til app. 23 h UTC on March 7th, 2014. So it is a very interesting signal out of many others for research on MH370.
@Victor
OK fyi I have the Kindle version as of this morning.
I wanted to see how she handled BG and the SIO debris finds.
@All Response to various comments and remarks
1. HB9CZF: Yes, interesting signal. I will resume work on stored MH370 data when Antarctic flying season will be over. HB9CZF even was in the air before the departure of MH370.
My vision: A team of up to 5 scientific enthusiasts or more will work on the stored data and share their findings and experience
2. Limit to VHF/UHF of app. 800 km: Correct! There is a software by DL2ALF allowing you to calculate airscatter VHF/UHF ranges. The SW is called Airscatter.
We are talking HF here so the range limit does not appy similar to OTH-R. The limit is the ionosphere (space weather) and propagation losses. We depend on the free electron density (different during day, night,Grayline, season,…solar cycle 24)
3. Triangulation not possible with a single line of TX and RX: Correct!
We can only detect a target on the line between RX and TX, maybe also beyond as some tests have shown. (Flight QFA2904 North towards PER from Antarctica and reception fluctuations in Japan at JH3APN more than 1,000 km South of PER)and JH3APN in Japan North of PER (more or less direct trajectory).
WSPR is a MIMO system (Multiple Input multiple Output). Up to 5,000 WSPR stations monitor worldwide. There are hundreds of WSPR stations in one time slot. So you can do some kind of triangulation or even more.
I did that on flight QFA114 JNB PER close to IG LEP at 22:48 h UTC. Signals West to East from South Africa to Australia and vice versa as well as more North to South links from Mexico to North America on a major or great circle. These signals also exist for MH370 from Venezuela, Uruguay, Paraguay and maybe Cameroon.
4. Examples of WSPR aircraft detection: I used stored data on flights AF447, MH17, Germanwings 9525 from the WSPR database and did a quick and dirty analysis before digging deeper into MH370. I had the final reports of the agencies with all the reference data so it was not as difficult as flight MH370 to find clues. Other numerous examples now in Antarctica as well as SIA478 / SIA479, transmission paths between Island (TF) and Antarctica et. al. as described above.
5.QFA2906 not suited for finding MH370: Correct! It is a training exercise of long haul flight heading 180 degrees over open water. I got many insights from those tests.
6. GEOS data: Interesting! Yes we need reference data with regard to space weather (not so difficult), location of aircraft such as ADS-B data, much more difficult and expensive to acquire for March 2014.
99 % of all aircraft will be false alarms.
7. Melbourne and Sydney detections are a little bit East of IGARI:
Yes, WSPR on HF cannot provide “LASER beam accuracy”. Detections in Antarctica of IL76TD at > 7,500 km range. The TX DP0GVN was about 250 km west of the Russian airfield where the IL76-TD finally landed. It also detected the IL76TD far west of NeumayerIII station with no ADS-B coverage. I saw the plane heading West beyond QAN and coming back East hours later (no ADS-B coverage inland) but WSPR detections. Monitor SNR ratios in that case to improve accuracy.
I hope I covered all the remarks and comments. I will apologize in case I overlooked one.
My strategy has 3 phases: observation, validation and verification.
The main argument against WSPR is a general one, as for the last 1,000 years. “It will not work!” Maybe until someone will come who does not know that! So I started on that one with top priority.
So for now I believe it will work! Accuracies etc. that is a different story. Remember just poor man’s radar as a substitute for better tools that did not show up in 7 years such as JORN. Maybe a clue in conjunction (data fusion) with Inmarsat and others as described in earlier statements.
Validation: testing in the presence with live WSPR receivers (570 at http://www.kiwisdr.com) and monitoring live WSPR signals, decodes as well as nondecodes (you will not see nondecodes in the WSPR data base). Comparison of results with ADS-B location data, i.e. from FR24 and other sources.
Verification: Appling the WSPR knowledge on the stored data of MH370 and using reference data (ADS-B, others) from 2014. My biggest drawback in the moment is the lack of reference data with regard to location of the various aircraft in the night of tragedy in March 2014.
Lots of work so any help, assistance, clues,…., positive criticism will be more than welcome. Reference data for March 2014 have been offered by a company for up to 5,000 US-$. That is a lot of money for a single person (crowd funding, alternatives or s.th. similar?).
It is not my intention to find MH370 by just using WSPR as a stand alone method. It is not suited for that. Maybe it can provide two or three important clues. General flight path during the whole duration of the flight (see U-Turn), heading in a general direction and information regarding the end of flight MH370 (timing). Data fusion in conjunction with other data, mainly from Inmarsat on the 7 th arc etc. could result in finding the final location (LEP) of flight MH370.
Correction: Please replace antarctic.com.au by antarcticflights.com.au
@TBill: She dismisses the debris as having unproven provenance and implies (without a direct accusation) that Blaine Gibson is a fraud.
Blaine has made some very unfair accusations about me and my post on voting in Pennsylvania, but I nonetheless believe his work in solving this mystery, including recovering debris, is sincere.
FdC is a bit like Jeff Wise in this regard. The debris provides hard evidence that disproves their theories. Therefore, they both go to great lengths to cast doubt on the authenticity of the recovered parts.
@TBill: I have to admit, it’s a fascinating read. There are multiple mistakes on each page, but if you are willing to replace the weakest evidence as the strongest, i.e., rumors replacing data, it is entertaining, especially since we are familiar with many of the characters.
@Rob
The lack of accurate timing and synchronization between WSPR sites will ultimately prove to be an insurmountable obstacle to the use of those signals for location. You have no way to estimate the length of a reflected path . Even old time navigation systems like Loran were specified to be synchronized within 100ns of UTC. Actual field operation was closer to 500ns typically.
@DennisW: Nobody is proposing that a range is calculated from timing of signals. Rob’s method is simply looking for the detection (or non-detection) of a metallic object (the aircraft) along a signal path.
@Victor
Yes, but you have no idea what the signal path is without being able to estimate the length of that path. It could be a relatively straight line between TX and RX. Or it could be a pair of straight line segments at 90 degrees to each other. All you know is that you received something. You don’t know where the signal was reflected or even if the signal was reflected.
@Victor
As Mike said an HF signal will propogate a long way, trapped by the ionosphere. Well the ionosphere is a realtive narrow band around the earth. Two WSPR stations (which know their locations) allow you to assume a relatively straight path (except for the reflections) between them. With a reflected signal from an aircraft you are clueless about the path.
@Rob, thank you for the explanations above. I applaud your creativity, vision, and attitude. No venture, no gain.
@whomever
In 1997, 24 years ago, the IBM computer Deep Blue defeated world champion Anatoly Karpov in a chess tournament. The beginning of the end. I have a master rating in chess, big deal. My Chromebook can beat me easily. I find it depressing.
So, what is the point? We are beating our limited heads against the wall trying to solve the MH370 problem. I have tried to use Google’s “tensor flow” for additional insight, but I am not smart enough to use it. I suggest others give it a shot.
@DennisW: What data do we use to train the neural networks?
@VictorI
I don’t know.
@VictorI
This site has gotten pretty goofy. No one with brain has any belief that WSPR will yield anything useful. The 34.2 preference is clearly unsupported. I don’t know. I am ready to give it up and start reading adventure novels from Amazon.
@Rob,
To Reinforce what @Kenyon has said on February 7, 2021 at 4:37 pm.
Applause for your attitude. Quoting Kenyon: No venture, no gain.
@Dennis,
You do not believe “that WSPR will yield anything useful”.
Until whatever useful information than can has been teased out from “the ether” we do not know.
Rob’s methodology sounds sound.
From my simplistic viewpoint Rob’s analysis may as a minimum provide further indication there was likely an otherwise unexplained aircraft in the relevant vicinity of where MH370 is thought to have been during the last hours of it’s final flight.
And,
Sufficient information may result to differentiate between a southerly flight path and Ed Anderson’s 370Location diversionary flight path further north.
In other words, for those interested in probability distributions, probability distributions may be affected.
@George G. Information as per Rob’s “…end of flight MH370 (timing)”, would also be nice. Glide or otherwise.
@Rob & WSPR topic,
Thanks for the additional details and your thoughts. I will continue to explore the WSPRnet database.
Like @DennisW, I was curious about the beam width of the propagation. I found a very insightful page on the topic, with links to two papers on forward scattering:
https://w3sz.com/AircraftScatter.htm
The discussion is mostly for VHF and UHF, but I believe it applies as well to HF for larger planes. If I may attempt a paraphrase, there is a strong forward scattering lobe amplification around any aircraft shape due to constructive interference as radio waves diffract around it. The lobe would normally extend in the direction of the RF shadow of the object off into space. The second paper discusses the effect of the airplane wings with large surface area acting as flat plate reflector back down towards the receiving site:
https://w3sz.com/AircraftScatterVK2KU2006.pdf
Any reflection from the large vertical stabilizer would still go off toward space, and side or back scatter toward the receiver would be highly dependent on having just the right flight heading between the stations.
A guesstimate is that the 3db beamwidth from HF aircraft forward scatter might be just a few degrees or less, and per the chart in the article extend beyond max 800km LOS out to 1200 km or so. With timing to the minute, that’s plenty good enough to discriminate between various proposed flight paths.
@Arto: Seeing a brief SNR boost like on HB9CZF should be just as significant as having a signal appear out of the noise, perhaps even better.
For those running Excel with VisualBasic, this “Watt” spreadsheet for WSPR might help with winnowing out signals:
https://www.gm4eau.com/home-page/wspr/
I didn’t find mapping in python for WSPR, but a maidenheadlatlon package is a good starting point.
Fascinating stuff! — Ed
Re: WSPR prospects…
Initially, I was hopeful the WSPR data base might contain a clue or two. But the more I look into it, the less hope I have. It is an interesting community and segment of amateur radio. Very clever use of narrow band spread spectrum and low power. But at the end of the day, there is no way to determine the propagation time, ray path geometry, identity of the reflecting object, location, speed or heading of the reflecting object…it just looks like a dead end for MH370. This is especially true for the 17:21 turn back and 00:19 descent.
@DennisW: Congratulations on your chess master level. The expertise of the man “with no brain” “beating a dead horse” is by far not that sophisticated! I just keep on trying to help in solving a mystery!
I partially agree with you. If you would decide to study my briefings you would certainly have realized that I addressed lateral displacement. At Antarctica we are talking about 2 degrees. It could be substantially more. I did not dare to try a spherical triangle between Japan, Tasmania and the IG LEP with data on 28 MHz at around midnight. Anyway this may be an option. Long path (LP) instead of or in addition to Short Path (SP) is another option to consider.
Using the 28 MHz data for long path (LP) and/or backscatter we would have many signals going thru IG’s LEP. We could even apply statistics on the variuos candidate LEPs found by using VOACAP. VOACAP calculates the propagation paths for that very night using an ITU model of the ionosphere and showing propabilities for WSPR receptions for SP and LP.
Here in this blog up to now we did not even discuss 5 % of the WSPR data, so I will not jump to any conclusions regarding the location of MH370.
Time and frequency synchronization: Correct, you are right, we only differ in the required level of accuracies. We are not talking Loran.
The KiwiSDRs are GPS locked, admitted not to an accuracy of 100 ns. We do not need that.
In case you ever decide to choose monitoring a live WSPR KiwiSDR (www.kiwisdr.com) you will see the dT and dF differences between receiver and transmitter. In case dT and/or dT will be too large WSPR will no longer be decoded. Every day you can see WSPR stations that are misaligned. You may also observe many nondecodes (Doppler,SNR, other issues). These are the raw or primary WSPR data. You will not see them in the secondary data(50 % of raw data) at the database http://www.wsprnet.org
The Search for MH370 certainly has much more thrill for me than a good adventure novel. You seem to be a very smart guy and it would be of great benefit to have you on the team not just opposing all the time.
At this time I am not ready to conclude that IG’s LEP may be incorrect.
Maybe I’m wrong but you seem to just ignore a couple of facts regarding WSPR detections (or am I halluzinating?):
1. How did I find the various aircraft in Antarctica at QAN, QAO from New Zealand if WSPR does not work. Tossing the dice?
2. I mentioned repatriation flight QFA114, B787, from JNB to PER on 2020.11.13. WSPR data for the whole flight duration as I would expect it. Data from South Africa to Western Australia. West to East and vice versa. Major circle signals from other directions all the time for various aspect angles. Passing close to IG’s LEP at 22:48 h UTC with lots of WSPR data that make sense with regard to the flight data and flight path. Due to COVID-19 no such flights since than.
3. WSPR data in Western Australia from South Africa on MH370 SAR mission on April 1, 2014. Not in March 2014, when they were searching further South. No thorough and profound analysis done yet.
4. Tracking flights SIA478 and SIA479 from JNB to SIN and SIN to JNB with WSPR SDRs in Australia, Indonesia, Philippines, Réunion and Maui on numerous days, mainly at night on 7 MHz.
Yes, there are still many open questions and issues. Anyway I think you cannot just ignore topics 1 to 4. There may be even more.
And again I agree with you on Deep Learning. We could use previous days and succeeding days WSPR data for training or the data from the SAR missions in March/April 2014. Anyway I think that would be an extra full load of work to program and analyze. Automation of the WSPR detection process would certainly help a lot. I invite you to do that.
I do not understand all the physics (“no brain”). That is the reason I will address the issues here to people smarter than me. There are many scientific papers on RCS at HF as well as the ionosphere at mid-latitude in Australia and polar latitudes in Antarctica by military, civilian organizations, universities, research institutes and radio amateurs, as Ed is mentioning. As a result of scanning thru all the published papers I think it is worth a try. We were close to the peak of solar cycle 24. That helps a lot on HF.
So in conclusion please consider to put the adventure novel aside and support us >50 % of your time and with your expertise! You are cordially invited to reduce the opposing part from 100 % to <50 %. Thanks a lot!
@Rob: You are quite a gentleman and a welcome addition to this blog.
@Rob
There is a wealth of literature on the ability to detect reflected WSPR signals by aircraft, balloons, and so on. I have no problem with the detection conjecture. I do have a problem with what you are able to deduce from the detected reflection besides simply the presence of a signal. There is no information about range or path.
Latest news snippet about SJ182, not much more info. Should get FDR data in a day or two.
https://www.flightglobal.com/safety/sriwijaya-737-500-slowly-turned-left-before-entering-fatal-descent/142288.article
Adding to @DennsW, Preliminary report expected tomorrow.
https://www.channelnewsasia.com/news/asia/preliminary-report-into-sriwijaya-air-crash-expected-on-feb-10-14136666
I’m following Rob’s exploration of WSPR data with interest. The western, oceanic, section of the YMMM/Melbourne FIR sees sparse traffic. We have, or likely can readily access, traffic records for the YMMM FIR and the surface search flights that may be used for a process of referencing any analysis that might be possible.
@Don, I agree, the sparse traffic in SIO would seem to be an advantage with exploring WSPR.
@Rob, perhaps before you test and look for needles in haystacks in WSPR data and FR24 you could (or others) assume you’ve identified a perfect anticipated signal (or signals) and perhaps FR24 results for the sake of a theory. (Pretend signals and pretend flight if you will.)
Then present how you would use the signal(s) to add context to the EOF for MH370. If the best case, pretend signals, are unable to help add to the tool box for narrowing the EOF, maybe it could be shown to substantiate Inmarsat data and MH370’s journey to SIO and be useful in other future cases. If unable to support either of those two scenarios then then perhaps it may not produce much fruit.
Today, on the day we are expecting a preliminary report on SJ182 within hours, Garry Soejatman posted a summary of what he knew about SJ182, available here:
https://bit.ly/3p6d3j4
His “3D trajectory” appeared to contradict track data and previous “2D trajectory” plots. I asked him to explain the difference, and he sent a video that explained it well. I replicated the .kmz file that explains it, available here:
http://bit.ly/3p689mf
By plotting the trajectory in 3D (Lat, Lon, Altitude, Time) on GE, it is apparent that SJ182 spiraled in to the left as many of us predicted. But this 3D .kmz file makes it clear how the 3D plot and 2D plots (GE Shadow) actually agree.
@ALSM
Nice summary. Looking forward to informed opinions when the FDR data is made public.
@Kenyon
IMO, we are going to get nothing from @Rob, despite Victor’s assertions of him being a gentleman. We don’t need gentleman at this moment. We need good analytical thinkers.
@Kenyon
I don’t mean to be crude. Times are changing, and I am static. I was ruthless and demanding running a $200M P&L before I retired. Made a ton of money for my company and myself. Now my computer scientist (and CalPoly SLO professor) daughter makes more than twice would I did annually with her AI and machine learning consulting. I still love her, and I am still a lot smarter than she is.
Geoffrey Thomas: “Malaysian government will not accept an offer which is on the table of no-find no-fee. So you have to ask why they will not search for it again. Ocean Infinity the US company wants to search for it again”
https://www.airlineratings.com/news/mh370-conspiracy-theories-no-evidence-just-traumatize-relatives/
Click on ‘SEE the interview here’
SJ182 Preliminary Report.
http://knkt.dephub.go.id/knkt/ntsc_home/ntsc.htm
SJ182 Preliminary Report is out and available here: http://bit.ly/3a7TrGW
As expected, the autothrottle appears to be involved in the upset. Confirmed roll to the left and steep descent.
Comments here are closed. Please continue the discussion under the new article.