Introduction
In two previous posts, (here and here), we have presented the assumptions and analyses for reconstructing our best estimate for MH370’s path into the SIO. Often referred to as “UGIB” after its authors Bobby Ulich, Richard Godfrey, Victor Iannello, and Andrew Banks, the model was developed using exhaustive data sets and technical documentation available from both public and confidential sources, and includes:
- Radar data collected by military and civilian installations in Malaysia
- Timing and frequency measurements collected by the Inmarsat satellite network
- Aircraft performance data for Boeing 777-200ERs
- Historical performance data for airframe 9M-MRO
- Navigation and speed modes for automated flight
- Drift analysis of debris that floated and was recovered in East Africa
- Aerial search results from March and April 2014
- Weather data along the flight path
The work included the development of an accurate fuel consumption model, as well as a statistical metric for the expected random noise inherent in the recorded satellite data. These improvements allowed the rejection of hypothetical flight paths that were previously believed to be possible.
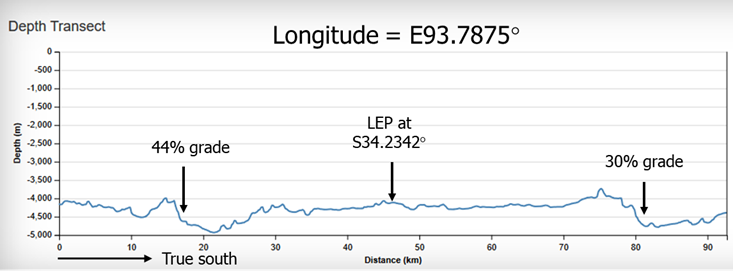
An important assumption of UGIB is that from 19:41 UTC until impact, MH370 flew with the autopilot and autothrottle engaged and with no pilot inputs. The results of that work suggest that the final hours of the flight were due south in the Indian Ocean along E93.7875° longitude, which matches a great circle between the waypoint BEDAX (about 100 NM west of Banda Aceh, Sumatra) and the South Pole. The Last Estimated Point (LEP) was defined as the intersection of E93.7875° longitude and the 7th arc, with coordinates S34.2342 E93.7875°. The debris field was postulated to be close to the LEP, as the end-of-flight after fuel exhaustion was expected to be a short distance.
The final BFO values at 00:19:29 UTC and 00:19:37 UTC suggest that MH370 was in an increasingly steep descent with a downward acceleration of around 0.7g. That, combined with the missing IFE log-on, are consistent with an impact relatively close to the 7th arc. Boeing simulations of the end-of-flight (assuming no pilot inputs) suggest an impact within 8 NM of the 7th arc. Other simulations with a PC-simulator in which a bank was imposed to match the BFO-derived downward acceleration suggest that the impact should be within 5 NM of the 7th arc. Yet, two subsea searches along the 7th arc near the latitude of 34°S, covering a much larger width of 110 km, failed to find the debris field.
The first search, conducted by GO Phoenix with a towfish, had a width of 40 km (7 km inside, 33 km outside the 7th arc) when scanning near 34°S latitude. Although this search failed, there were some areas that were missed due to terrain avoidance, shadows, equipment failures, and tracking errors, which does open the possibility that the debris field was passed over by GO Phoenix and not detected.
The second search was conducted by Ocean Infinity using a fleet of autonomous underwater vehicles (AUVs), and extended the width inside the 7th arc by 42 km and the width outside of the 7th arc by 29 km, for a cumulative search width of around 110 km (49 km inside, 61 km outside). Due to the greater maneuverability of the AUVs, the search area included some of the steep slopes that were deliberately avoided by GO Phoenix due to challenging terrain. Despite this wider and more thorough search, the debris field again was not found.
In a previous article, we postulated that the debris field may have been missed due to terrain avoidance and/or shadows, or detected but not properly interpreted by reviewers. In particular, there is a steep slope that lies about 33 km due south of the LEP and 27 km from the 7th arc that was not scanned by the GO Phoenix’s towfish and appeared to have been only partially scanned by Ocean Infinity’s AUVs.
The figure below shows the ocean depth along a line of constant longitude in the vicinity of the LEP. The previously identified steep slope to the south of the LEP has a grade of about 30%. To the north, another slope has a grade of 44%. The slope to the north was beyond the limits of the search boundaries of GO Phoenix, but was scanned by Seabed Constructor’s AUVs, so we focus on the steep slope to the south.
New Information about the Previous Search
Working with Ocean Infinity, we were able to obtain a more accurate outline of the area searched with their team of AUVs. The outline is shown by the four yellow lines in the figure below. As shown in the figure, the two inner yellow lines show the approximate limits of the GO Phoenix search area, and the outer lines show the limits of the Ocean Infinity search area. Also shown in the figure are olive-green areas which represent areas that were not scanned by GO Phoenix’s towfish due to steep terrain. These and other areas of missing or low-quality data were made available by Geoscience Australia.
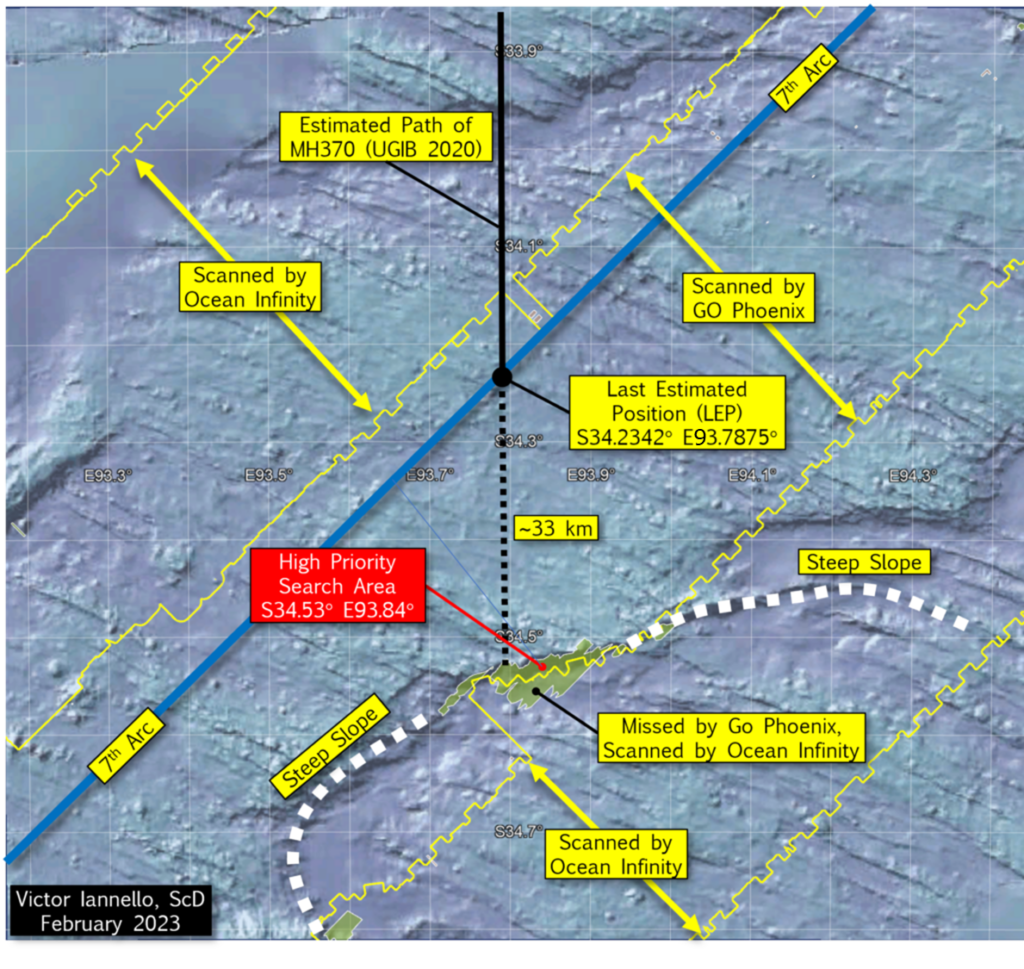
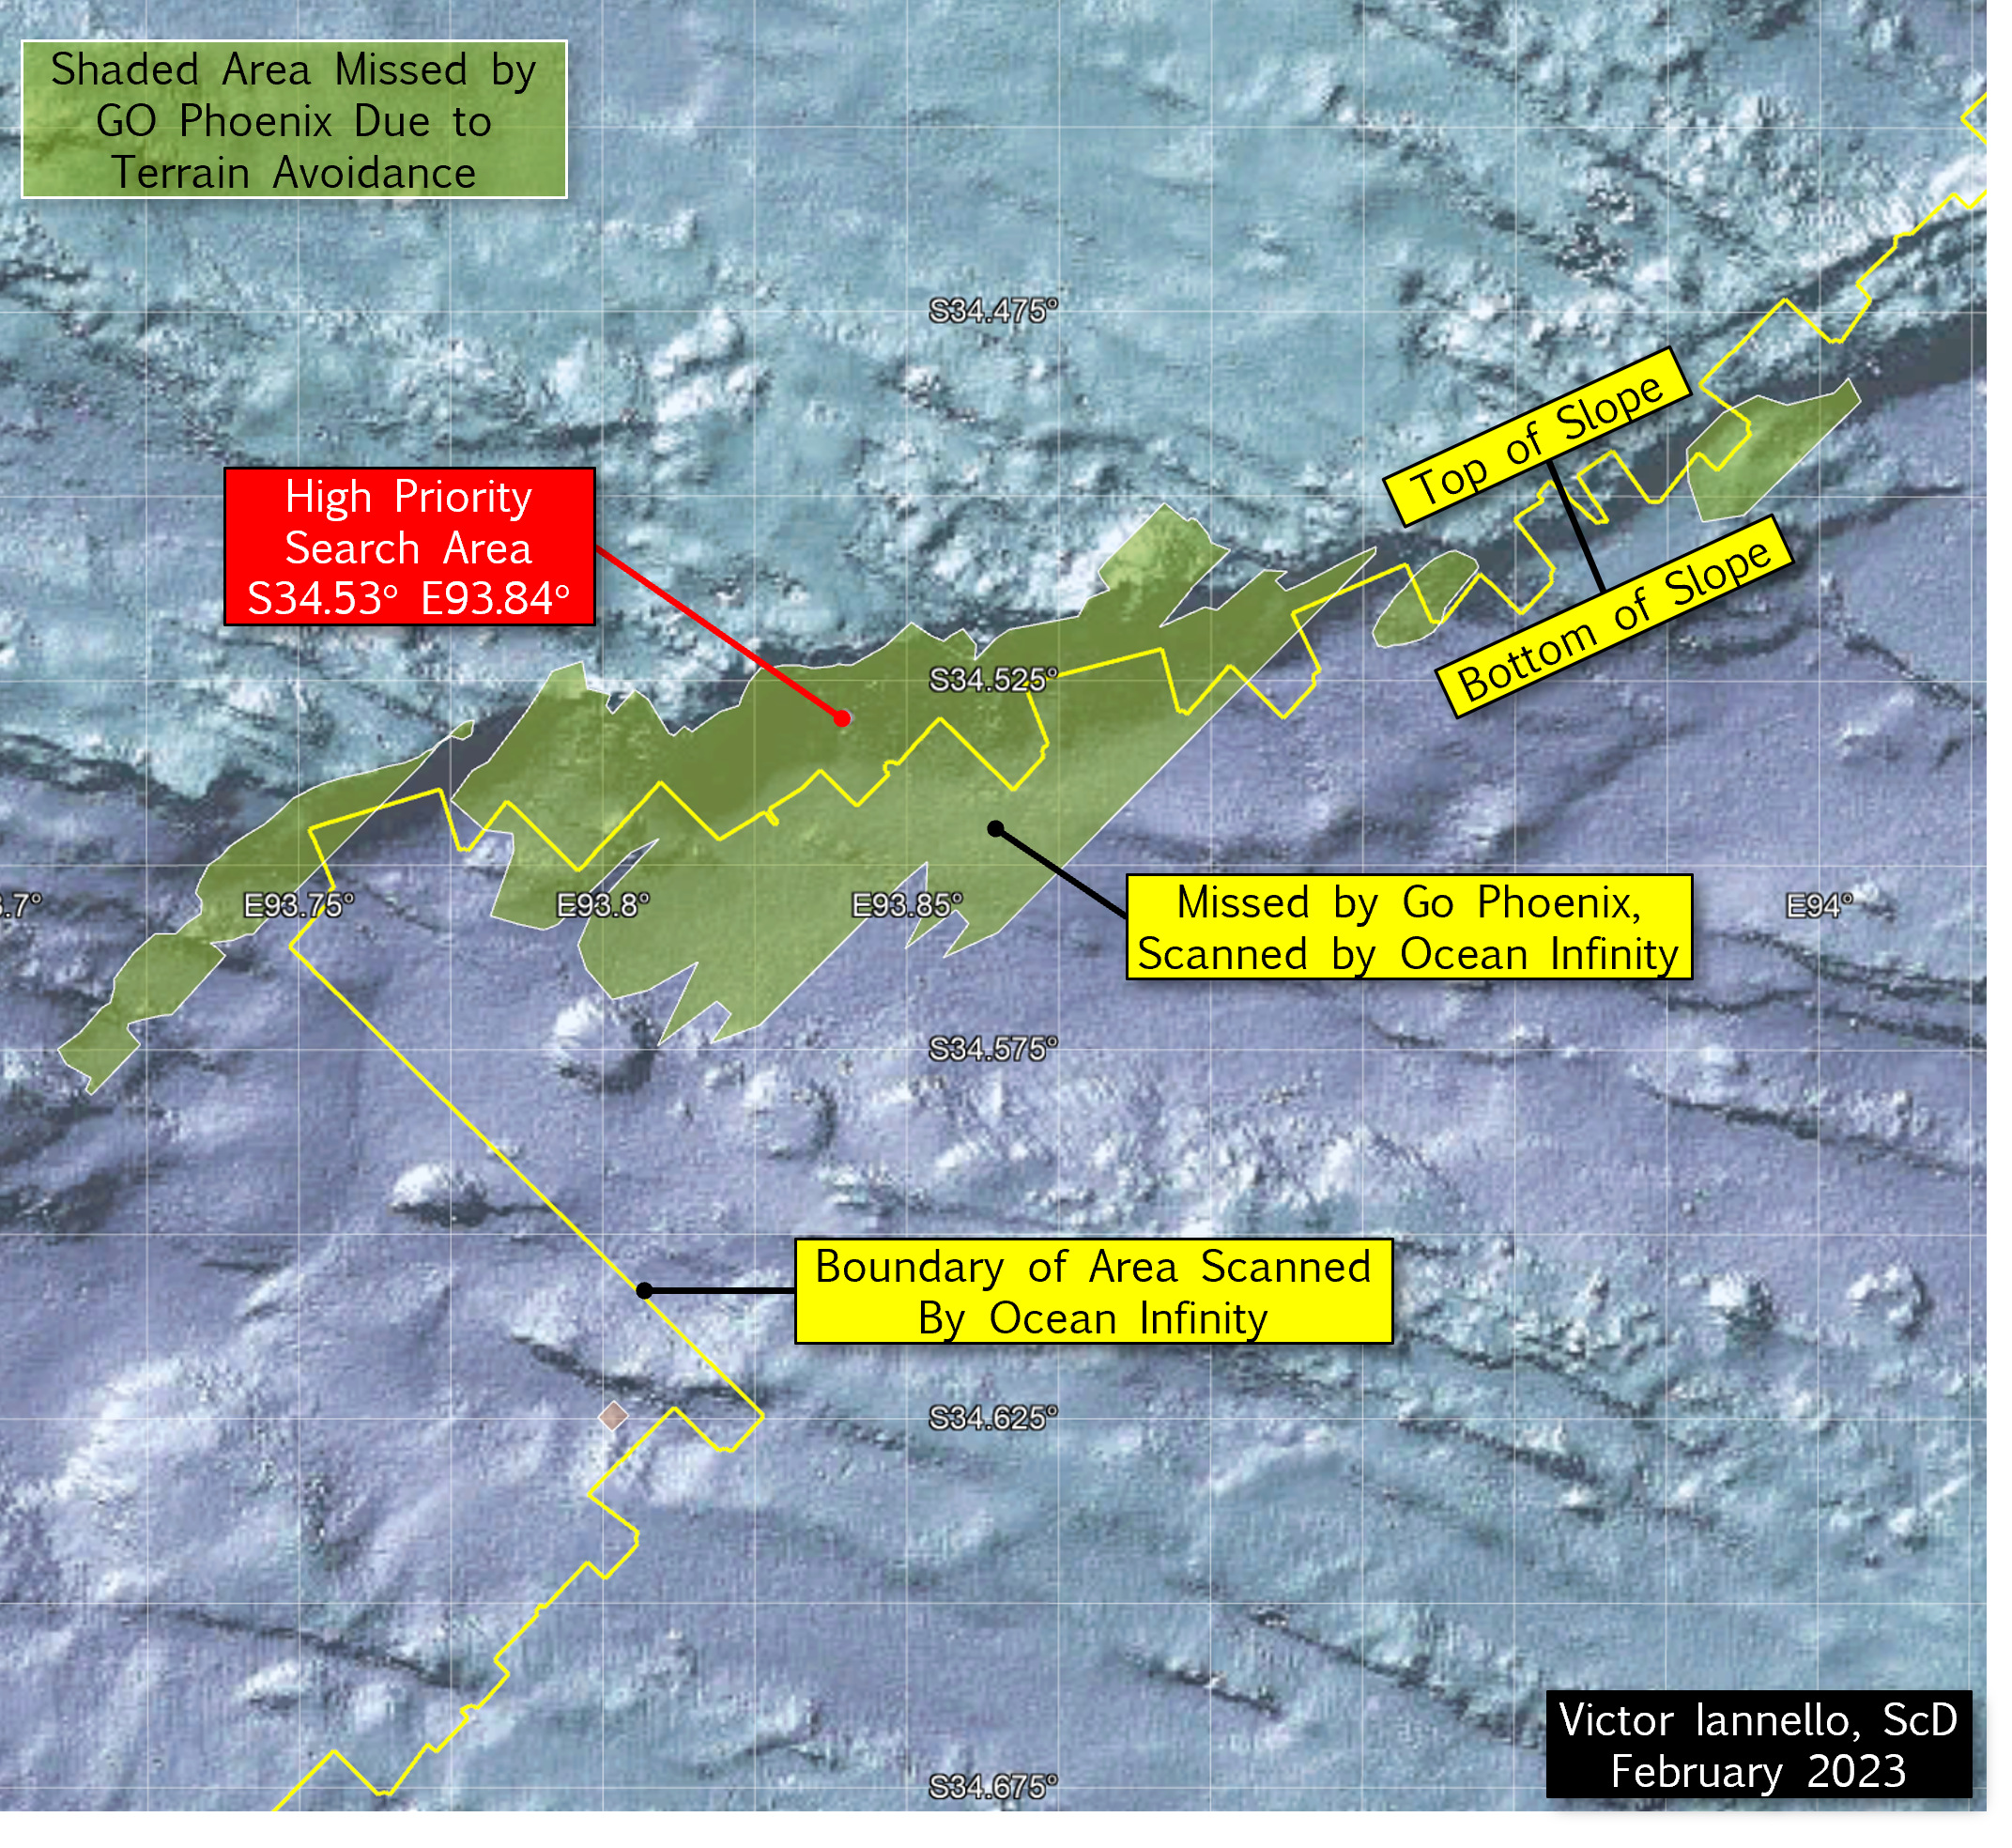
Looking again at the steep slope to the south of the LEP that we previously suspected was not fully scanned, we can see that our suspicions were correct. The portion of the steep slope that was not scanned by the GO Phoenix towfish is about 60.3 km2. Of this, about half was later scanned by Ocean Infinity AUVs, leaving about 30.5 km2 of seabed surrounding S34.53° E93.84° that was never scanned. We designate this area as a “High Priority Search Area”.
The figure below is a closer view of the High Priority Search Area and surrounding terrain.
Discussion
Ocean Infinity has expressed a desire to resume the subsea search for MH370 in the Southern Indian Ocean (SIO), hopefully during the next austral summer that begins this December. As the a) final BFO values, b) the lack of IFE log-on, and c) the end-of-flight simulations all suggest an impact close to the 7th arc, a high priority should be to scan the areas closest to the 7th arc that were either never scanned or have low quality data before searching new areas further from the 7th arc. However, with pilot inputs, it is possible that MH370 glided after fuel exhaustion beyond the areas that were previously scanned. Therefore, searching wider along the 7th arc should also be part of the search plan if areas closer to the 7th arc are unsuccessful in locating the debris field.
The reconstructed route of MH370 proposed by UGIB remains a leading candidate for the hypothetical route to the SIO because of the accuracy of the physical models, the breadth of the data sets analyzed, and the statistical rigor applied to the BTO and BFO data. The analysis does assume there were no pilot inputs after 19:41 UTC, and the autopilot and autothrottle were engaged until fuel exhaustion. A steep slope to the south of where UGIB predicts MH370 crossed the 7th arc happens to lie along the extended path of the reconstructed route, and much of this slope remains unscanned. For this reason, the unscanned area surrounding S34.52 E93.84 should be designated a High Priority Search Area.
Acknowledgement
I’d like to thank Ocean Infinity for their help in defining the geographic boundary of their subsea search for MH370. I’d also like to thank Don Thompson for his help in GIS file format conversions.
@Victor:
Excellent summary of the detail supporting the priorities for the next search.
@Victor:
FYI: the link “areas that were missed” is broken
« Boeing simulations of the end-of-flight (assuming no pilot inputs) suggest an impact within 8 NM of the 7th arc. Other simulations with a PC-simulator in which a bank was imposed to match the BFO-derived downward acceleration suggest that the impact should be within 5 NM of the 7th arc. »
So how could the plane end up 33km (18NM) from ARC7 ?
@Peter Norton: The link should be fixed.
You asked So how could the plane end up 33km (18NM) from ARC7?
I suspect there are limitations to both the Boeing and PC simulations. The interactions of systems are very complex, and some parameters like rudder trim unbalance are unknown. Other behavior such as the rate that hydraulic systems bleed down, and generator power produced during the spool down and windmilling are not well characterized. We’ve done our best to characterize all these effects, but there is little empirical data because for safety, Boeing doesn’t test actual planes under these conditions. Hence, we are limited by the fidelity of the simulators.
Let’s tidy this SIO search area up for once and all.
.
Personally I have followed the witness reports to the area of Kate Tee’s sighting, then I factored in the research I have done, looking at, cloud formations, contrail’s, distrail’s.
.
One of my finds was by using time specific weather Satellite images, I discovered several semi-circular decomposing contrails southwest of Sumatra, I have supposed they could have only been made by a high altitude aircraft during the night, with a circuit time of approximately one hour.
@VictorI:
In case it’s useful, here are a couple of maps for your high priority search area. If you have a .kml, it might be possible to make an overlay with map tools and a login on the Geoscience Australia site.
30m backscatter:
https://portal.ga.gov.au/restore/5df3d685-c45b-41a9-8f40-14bb69385a93
5m sidescan:
https://portal.ga.gov.au/restore/0c5a1dcd-e261-4109-aa32-1ec025ba8e69
Fiddling with broader map layers will show other MH370 seabed scans.
@WrinkleArthur: Welcome to the blog. If you have a report describing your contrails work, I’m sure many here would be interested in reading it.
@370 Location: Thanks, Ed.
I used to be able to access the Geoscience Australia (GA) maps through Google Earth using their WMS server. Those links no longer work. I don’t know why. Are you still able to access the GA maps using Google Earth?
@Victor
There are download options within the online layers menus for copy WMS and download KML CSV JSON and shapefile. Select the circled i on the relevant layer item.
@VictorI:
Here is a .kmz file of several GA MH370 WMS links that I assembled in GE last year. All but one seem to be working:
https://drive.google.com/file/d/15Fktnhkx2jBhu9mqq-meUkr6f1YZS_c3
« The final BFO values at 00:19:29 UTC and 00:19:37 UTC suggest that MH370 was in an increasingly steep descent with a downward acceleration of around 0.7g »
For the sake of clarity, could you indicate how the plane was controlled at this point ?
1) autopilot engaged with pilot inputs
[ ] impossible [ ] possible but unlikely [ ] possible [ ] likely [ ] certain
2) autopilot engaged without pilot inputs
[ ] impossible [ ] possible but unlikely [ ] possible [ ] likely [ ] certain
3) autopilot disengaged with pilot inputs
[ ] impossible [ ] possible but unlikely [ ] possible [ ] likely [ ] certain
4) autopilot disengaged without pilot inputs
[ ] impossible [ ] possible but unlikely [ ] possible [ ] likely [ ] certain
@Peter: No way the Autopilot was engaged. BFO data is consistent with an uncontrolled descent, but a manually controlled descent can’t be ruled out. Either way, POI was close to the 7th arc.
@370Location: I examined your KMZ. Unfortunately, there were missing layers, layers that did not work, and repeated layers.
I started from scratch, using the WMS link that @Joe Coleman provided, and assembled this KMZ file for all the subsea data that Geoscience is warehousing. I believe the data set is complete, including the bathymetry data, and all links should work.
Please let me know if this KMZ file works for you.
The working assumption by the group here is that Mh370 flew South with Auto pilot engaged with no pilot input.
As all know or can probably guess I’m probably the least qualified here. But if Autopilot is engaged doesn’t the aircraft need a path to follow? What would considering the assumed route taken have been input into the Autopilot system?
Mike in his last comment seems to suggest the Autopilot wasn’t engaged at the end. Does the aircraft automatically disengage the Autopilot system under set conditions or is this something that has to be done by someone in the cockpit?
I’m quite aware we can’t know the why… within reason or the how (presumably)the aircraft flew to the SIO until the aircraft is found & hopefully the black boxes are still readable. BUT as we are working under a hypothesis it is important to understand the small details as well as the big 1s.
@MJ: Yes, the Auto Pilot and Auto Throttles automatically disengage after MEFE. This was confirmed in all the simulations I conducted. Short video here: http://bit.ly/2AXtsAn
@Michael John: All your questions are answered in excruciating detail in the articles referenced at the start of the article above, as well as the reports that formed the basis of the article.
The route that UGIB concluded was most likely entered into the FMS is BEDAX-South Pole, as the article above says.
The autopilot is automatically disengaged after there is no longer power delivered to the two transfer busses, which causes the pitot heat to fail. That would occur after fuel exhaustion. The RAT does not supply power to the transfer busses, nor would the autopilot automatically re-engage if power were somehow restored to the transfer busses such as when the APU starts.
Thanks guys for the clarification on both points.
@ALSM: thanks from me, too
@VictorI:
Yes, your improved GA WMS .kmz file works for me.
If OI has given permission to share their search boundary .kml file, that would be very useful to other researchers. I know that several folk were tracking Seabed Constructor AIS data. I worked with SeisIntel, who specialize in tracking seismic surveys, to help calibrate the CTBTO hydrophone locations for improved bearing resolution. Details at https://370location.org/?s=seisintel.com
Seisintel was very helpful, and took a keen interest in MH370 and the OI seabed search. I won’t share the proprietary AIS data without permission, but here is a GE screenshot of tracks in the area around your new search site:
https://drive.google.com/file/d/15H98-JcdcLIB8rdvuehl-9B2gjif3ZTQ
The green lines are Seabed Constructor tracks. It certainly appears that the survey ship made three passes over that ledge to cover any missing data below. It loitered within 1 nautical mile.
Here is a link that Seisintel provided on their demonstration portal during the early portion of the OI survey, so it should be OK to share:
https://portal.seisintel.com/resources/demo/Seabed_Constructor_20180413.mp4
Starting at about 2:22 into the downloadable vid is the first traversal of your priority site on 2/18/2018.
@MH370Location wrote ‘It certainly appears that the survey ship made three passes over that ledge to cover any missing data below.‘
The vessel, itself, was not gathering any data. The vessel was launching its AUVs, performing mid-sortie position checks/INS re-calibration, and recovering its AUVs.
The pattern of AUV deployment in the vicinity of the slopes described in the post involved launch to survey lines oriented perpendicular to the 7th arc.
The manoeuvres exhibited by Seabed Constructor concerned AUV launch, then ‘guiding’ the AUV at slow speed, to its survey altitude/start position. Constructor then left that AUV until mid-sortie when it made a rendezvous to check the AUV’s progress and re-baseline its INS. Again, Constructor left the AUV to complete its sortie before a final recovery rendezvous.
This activity spanned approximately 40hrs per AUV sortie in a constant rotation, interleaving the launch, mid-sortie rendezvous, recovery, and deck operations for all 7 AUVs. So, Constructor was continuously shuttling back and forth along the line of launch positions, repositioning to mid-sortie rendezvous, and along line of recovery positions.
At the time of the MH370 deployment, Seabed Constructor had no MBES capability of its own.
The tracking looks very similar to that logged by Big Ocean Data. There are (were) only two sources of S-AIS data, ExactEarth on the Iridium-NG constellation and Orbcomm.
@370Location: I have not received permission from OI to share the file with the search boundaries.
As Don says, the path of Seabed Constructor only approximately defines what areas were actually scanned.
I wish to remind folks that the idea that one can define a “high priority” location along the 7th arc with any precision is fiction. There was a long discussion about the UGIB report in this forum nearly 3 years ago (Mar 9, 2020) when the report was released, which I will not repeat here. The sensitivity studies (such as Figure 19 of the report, recently referred to here) purporting to demonstrate that precision is possible are fatally flawed for reasons that I pointed out back then. All that they show is that location perpendicular to the 7th arc is well constrained.
MH370 may well have traveled a route 180 degrees S, but there are plenty of routes on other bearings that match the SATCOM data just as well.
@Don:
I had a general understanding of how the OI AUVs were deployed, but it’s very nice to get more details on the past search operations. It was amazing tech then, and it took a dedicated crew to keep it all going. I’m really looking forward to seeing the latest mind-boggling OI remote operation strategies put into action by their crews, especially applied to locating MH370.
@Victor:
Of course I expect OI knows best where they scanned, and I do hope they might find some benefit in releasing more data, past and future.
It’s odd though, that OI would re-survey that area that had some holes in the Go Phoenix data, but then not actually search to the boundary of the ridge shadow zone.
I suspect the issue may be with the tracking accuracy of the Phase 1 vs towfish vs Phase 2 AUV inertial guidance. I’ve noticed that seabed features move (not just specular angle shifts) between different scan imagery methods, typically 100m, but often 300m+.
(I’m somewhat familiar with image registration and stitching in panoramic HDR photography, but such techniques do not appear to have been used in the available scan results, perhaps due to true experts who can fuse those sonar image adjustments in their head).
The location errors hint that there might be larger differences not only between some of the available scan imagery, but also compared to the OI boundaries.
If OI does decide to resurvey this site, their new tech would likely take in a much larger area in a single sortie.
I support searches at any viable candidate site, starting with those that are specific enough to be quickly checked as a hedge against protracted search areas.
@sk999: The area identified in the post is one of the largest areas close to the arc that was never scanned due to terrain avoidance. Whether or not you agree with UGIB’s conclusions, this fact alone makes it a high priority area.
@sk999,
You said: “MH370 may well have traveled a route 180 degrees S, but there are plenty of routes on other bearings that match the SATCOM data just as well.”
The UGIB paper directly addressed that critical question: Is there a particular route, or a set of routes, that provides the best match to the SATCOM data?
The UGIB methodology advanced the general method of MH370 route evaluation by (a) incorporating rigorous probability theory (including Fisher’s chi-squared method of predicting a combined probability), (b) incorporating the OXCO Allen Deviation, (c) incorporating the correlations of the BFO/BTO residuals with other parameters.
The UGIB method was used to compute the probability of all possible lateral navigation routes, including speed and altitude settings. The results showed a distinct and significant preference (i.e., higher probability) for a particular combination of navigation mode, altitude, and speed setting. It is not correct to suggest that “there are plenty of routes on other bearings that match the SATCOM data just as well.”
I thought I read somewhere (a while back) that OI had given it’s MH370 Survey Data to the SEABED 2030 project.
Is that correct, or not ?
Bobby Ulich states, “It is not correct to suggest that ‘there are plenty of routes on other bearings that match the SATCOM data just as well.'”
Here are some such routes. The route at bearing 180 was intended to match UGIB trial #815 but I solved for the starting longitude and latitude independently. There is a 1 nm difference. The figure of merit includes the summed weighted rms of BTOR, BFOR, and what UGIB call “Ground Speed Errors” (which I model as wind speed errors.)
LRC speed mode, Altitude FL390. Initial time 19:41:02 (i.e. 1 sec before the 2nd arc handshake.) Initial mass 201.654.
Initial Bearing 179
Initial Longitude 93.72
Initial Latitude 3.49
7th arc Latitude -33.72
chi^2 9.0
Initial Bearing 180
Initial Longitude 93.74
Initial Latitude 2.91
7th arc Latitude -34.31
chi^2 9.1
Initial Bearing 181
Initial Longitude 93.74
Initial Latitude 2.32
7th arc Latitude -34.88
chi^2 9.3
A difference in chi^2 of 0.3 cannot be considered significant. The range in initial bearing falls outside the limits of UGIB Figure 19. The range in initial latitude falls outside the limits of UGIB Figure 21.
When conducting a parameter sensitivity study, one steps through the parameter of interest (in this case initial bearing) and reoptimizes all the other parameters to give the best figure of merit (minimum chi^2). That is what I did.
For the small changes in heading examined here (2 degrees total), changes in chi^2 are dominated by the BTORs. No other “statistic” has comparable sensitivity.
Victor – I agree that significant areas never scanned are high priority. Have you identified other such areas? My (uneducated) opinion has long been that the debris field is located within the existing search zone but was simply missed.
“… summed weighted rms …” should read “… summed weighted squares …” i.e., yes, I do know how to compute a chi^2.
@sk999,
1. You said: “The range in initial bearing falls outside the limits of UGIB Figure 19. The range in initial latitude falls outside the limits of UGIB Figure 21.”
As shown in Figure G-8, the range in bearings that was analyzed was 158-192 degrees. Figures 19 and G-7 and Figure 21 plot only a small portion of the Route Probability near its peak. A very wide range of initial bearings and initial latitudes/longitudes were analyzed which included the values you listed. We found those routes have significantly lower route probability.
2. You said: “The figure of merit includes the summed weighted rms of BTOR, BFOR, and what UGIB call “Ground Speed Errors” (which I model as wind speed errors.)”
We did not use the ground speed errors (GSEs) as a statistic in calculating route probability, because that variable is highly correlated with the BTORs. Thus, you really only used two statistics, not three. In effect, “errors” in predicted ground speed appear primarily as BTO errors (and only trivially as BFO errors). So our Route Probability allows us to discriminate among the speed control modes and flight levels, but primarily through the BTOR mean and standard deviation included in our Route Probability. You should not consider GSEs as a separate, independent statistic.
3. You said: “For the small changes in heading examined here (2 degrees total), changes in chi^2 are dominated by the BTORs. No other “statistic” has comparable sensitivity.”
You are oversimplifying the analysis by using a small number of statistics. It appears you may be simply minimizing the RMS errors (although this is unclear in your comment). If so, that is the wrong approach. UGIB found the probability of matching the expected values (of mean, standard deviation, and correlation coefficient). We also included the Allan Variance in the expected values of BFORs. UGIB used 9 or 11 statistics, depending on the lateral navigation mode. The route probability is the product of this large number of probabilities. You can’t adequately approximate it using effectively using only two statistics. Having a much larger number of statistics, some of which are more sensitive than others, will provide better discrimination than a small number of statistics. This improved discrimination is clearly demonstrated in the sensitivity plots. We found that including the correlation statistics, as well as using both the expected mean values and standard deviations, which it does not appear you have done, improved the route discrimination.
@Ventus45 asked if ‘OI had given its MH370 Survey Data to the SEABED 2030 project.‘
I can’t speak for OI but the GEBCO 2030 project collects single (SBES) and multibeam (MBES) bathymetry data to be compiled into the GEBCO gridded bathymetric data set. OI’s 2018 MH370 mission did not explicitly collect such data, only side-scan ‘backscatter’.
It’s quite possible that the MH370 side-scan data was lodged with the IHO Data Center for Digital Bathymetry as an archive but that’s not an input to the GEBCO grid.
(I suppose it might be feasible to use the AUV’s nadir fill, short range MBES sensor data, modified with the vehicle’s depth sensors to deliver bottom depth but that might not meet GEBCO requirements).
@ventus45: I am not aware of any Ocean Infinity scanning data that was made public. If somebody finds where that data might be archived, please let us know.
@Ventus
It seems you are correct
https://seabed2030.org/get-involved/partners/ocean-infinity
Might be a Red Herring but if Ocean Infinity has supplied it’s Data to the above project. Of which Gebco is a part. Could it be possible that the Data is obtainable through Gebco? I found this link for downloading Bathymetry Data in the South Indian Ocean. Not sure if it would help anyone here though.
https://download.gebco.net/
@sk999,
We won’t know if the proposed UGIB route is correct until the debris field is found, and, even then, we might not be 100% certain. The best we can do now is identify routes which are consistent with what we think we know, and then rank those in a priority list to assist in planning new searches.
All routes proposed for consideration in defining bottom-debris search areas must not only provide exceptional fits to the SATCOM data, they must also:
(1) be connectable to the 18:22 location with a plausible intervening route,
(2) provide the correct amount of fuel (not too much nor too little) at 19:41:03 so that MEFE occurs at 00:17:30,
(3) Have a pair of waypoints (or possibly some other plausible means) for setting the lateral navigation mode and course at the start of the final route.
The UGIB route has been demonstrated to meet all those criteria. How could the two other route examples you suggested satisfy (1) and (3)?
I also note that the shifts in 7th Arc LEPs in your examples are within the potential range of a post-MEFE piloted glide. I do not believe a piloted glide occurred after MEFE because I don’t believe anyone could have survived in a depressurized cabin at FL390 for more than four hours, since there was not enough fuel for the air packs to have been on after 19:41. However, it might be wise to to allow for that possibility as a lower priority, in case the fuel model predictions we made should somehow have an error as large as 2%.
I have no idea if your model is right or wrong (the science is above my level of competence) , however there are at least reasonable cases being made for other locations (the Java impact always intriuges me as it can made to fit BTO / BFO also).
It does seem a reach though to be prioritising a point 29nm from the 7th arc when your own model and simulator data suggest this would not be possible. Can I ask if you think you might be stretching there to make the facts (most of the area was well scanned) fit your model, rather than wondering if your model doesn’t fit the facts. And most of your LEP adjacent area has been thoroughly scanned. Is it possible you are too enamoured of your model that you are reaching a bit?
To be clear, I’m aware this might seem like I’m having a go – I’m not. You guys have put immense amounts of effort into your work, and at a much higher quality than many others. I’m not about to propose radio interference can find the wreckage. So I’m really not criticizing – but am interested in how much you are factoring in your own confirmation biases when you jump to 33nm away from your LEP.
Hope this makes sense and is taken in the spirit I mean it, which is a good one. All I hope is that the wreckage is one day found.
Concerning Ocean Infinity’s 2018 search products and GEBCO.
GEBCO produces gridded global bathymetry data using contributions from many, many sources. GEBCO expressly requests Single Beam and Multibeam Echo Sounder data from contributors. That is, GEBCO produces a global digital elevation model.
Perhaps I wasn’t clear above, Ocean Infinity did not collect the wide area SBES or MBES data, during the 2018 MH370 search, that is solicited by GEBCO Seabed 2030. Seabed Constructor was not equipped with the appropriate sensors at that time.
However, as is set out in the GEBCO releases (here and here), the MH370 AUV products were to be submitted to the Seabed 2030 Project.
The greater part of the MH370 search data collected by the AUVs is side-scan backscatter data (absent any bathymetry component, whatsoever). The AUVs do employ a ‘near bottom’ MBES for nadir image fill (backscatter). The output from this sensor may be useful to define the ocean floor bathymetry (digital elevation model) but to do so would require processing additional to that defined as the inputs for GEBCO/the IHO DCDB and the IHO Guidance to Crowdsourced Bathymetry (CSB).
While the 2018 MH370 search data may have been submitted to GEBCO/IHO DCDB it perhaps should not be surprising that it has not been incorporated into GEBCO and DCDB hosted gridded bathymetry products: additional processing would be necessary to integrate AUV acquired data into the gridded bathymetry products.
I write this with some knowledge of what is archived by Geoscience Australia for Phase 1 (7th arc wide swath MBES survey) and Phase 2 (detailed seafloor imaging survey) work. Access to an archive of 2018 search products, similar to the GA Phase 2 data, may well be useful but some (major) effort and domain knowledge would be required to extract useful information from it.
@vodkaferret: First, the priority area is 33 km (18 NM), not 33 NM, from the LEP.
In the search for the San Juan submarine, OI’s AUVs passed over the debris field. Due to challenging terrain (a trench), the resolution of the sonar data was degraded, and the damaged vessel was mistaken for geological features. I wrote this article about the search for San Juan and the implications for the search of MH370.
The new article simply states that there is a small area with challenging terrain that was never scanned that is close to UGIB’s best estimate for the path of MH370, and there should be a high priority to search there. I don’t know the probability that the debris field will be found there, nor do I know the probability of pilot inputs versus no pilot inputs after fuel exhaustion. (At this point, how can anybody know this?) However, it would be wise to search this small area before searching wide. If I was asked for a single area to search, it would be here.
@victor thank you for your comments and for correcting my error. I can certainly see the sense in searching that area first. If that search didn’t find anything, would your second preferred area be within regions already searched or outside of them?
You state that you were able to obtain information from confidential sources, precisely what confidential details were given, can it help determine where any future searches can be taken if the possibility of the plane being outside the 7th arc decreases, does it include accurate fuel consumption as well as accurate speed, altitude and most likely directions during the course of the flight ?
Maybe OI should think about using crowd funding (too).
On a global scale, lots of people want to know where MH370 is.
@All: Here’s the trailer for the upcoming Netflix special (3-part series) on MH370:
https://www.youtube.com/watch?v=TDg0m2Q3H8c
@all
As you already know, I have been working with Captain Patrick Blelly on a more detailed analysis with the perspective “one way journey to SOI and piloted all along”. It is now completed and the report is available at https://www.mh370-caption.net/
We have also posted on our website the 6 videos referenced in our report. They illustrate the key phases of the trajectory in providing examples of the simulations sessions we did. They are recordings of some of Patrick’s flights enhanced with graphical legends.
In short, the analysis addresses the full trajectory from just before IGARI until the touch down. This trajectory includes no gap at all and no blocking point. All key elements are documented, justified and validated on simulators and matching Inmarsat data. This means that this trajectory is possible and could have been flown as described. To all questions one may have there is a realistic and “flyable” answer. The main driver was to always ask : how a person in command would behave at key points ?.
Thus it proposed to add it on the list of candidates for the future search.
Best.
JLuc
Jean-Luc Marchand – CAPTION
This latest paper is seriously flawed from the very first paragraph of the Executive Summary. It states MH370 was flying at FL300 and 310 knots after the turn back at 17:21 up to 18:21. That is easily proven wrong by simple analysis of either the civil PSR data or the military PSR data between 17:21 and 18:22 UTC. We know the altitude at Kota Bharu was ~40,000 feet from the extensive radar data analysis conducted by several people, and the ground speed was 530 knots all from KB to Penang. That ground speed slowed a bit after the turn at Penang, but remained ~500 knots until loss of track at 18:22.
So, where did the FL300/310kts fiction come from?
Re: Jean-Luc Marchand – CAPTION
I think the speeds are implausible too.
My yardstick relates to a eureka moment, and the paper I wrote way back in 2014/5 where I used the BTO data and some simple spherical geometry to estimate the ground speed between 19:41 and 20:41 utc.
Observation of the BTO data illustrates a minimum between these two times, meaning that the aircraft was flying [at some point] tangentially to the 3F1 satellite.
The only assumption necessary to determine the ground speed between these two times, is that the track is [relatively] straight. The actual track angle is irrelevant.
My estimated ground speed was approximately 490 knots.
I have frequently checked many other track models, path calculations, etc etc. The plausible ones also estimate the ground speed in the same range. I discount others.
ALSM,
310 knots is IAS.
@sk999
310KIAS @ FL300 = 480KTAS
That’s still way too slow, Steve, and we can almost certain that the target plotted by the Kota Bharu primary approach radar was way higher than FL300.
Being ex-military, I had the importance of stepping off on the correct foot drummed into me from very early on. It’s not a good look for a paper claiming to be “documented, justified and validated” to step off with such a manifestly incorrect assumption.
Assuming that Mh370 travelled the route predicted from the SCS to the top of the Malacca Strait that distance is approximately 600 miles. Which in turn suggests that Mh370 must have been travelling at approximately 600 mph as an average. Which tallies with a Knots figure as Mike suggests of 530. Taking a Knots figure of 310 which equates to approximately 357 miles per hour then no matter which route Mh370 takes the aircraft would have gotten little further West than Penang in that hour.
@Michael John
You are mixing a number of different speeds in that statement. Google “indicated airspeed, true airspeed, ground speed”
@SK999 Thanks for correcting that speed. Yes, it does say IAS. I missed that. 480 KTAS is still a little lower than what we measured at KB (~502 KTAS). And the altitude was definitely ~40,000 feet (~FL380), not FL300. My main point was that they started off in the very first paragraph with at least one major error.
Report on the Yeti air accident in Nepal. https://www.flightglobal.com/safety/both-yeti-atr-propellers-feathered-just-after-pilot-called-for-flap-extension/152111.article
@Paul Smithson: Thanks for the report. That was very unfortunate. I can understand how the instructor in the [right] hand seat could have mistakenly pulled the wrong lever (rpm versus flaps), but it’s odd that the visual, aural, and “feeling” clues didn’t immediately alert either crew member that the plane was not properly configured. Maybe there were other things occurring in the cockpit.
@Jean-Luc Marchand: I am trying to understand the rationale behind your path. I understand that you tried to find one that was “flyable”, but how did you select that particular path over many others? I see that your endpoint is close to where satellites have captured debris images, but did you start with that endpoint and then find a path consistent with it? And why do you no longer believe the impact occurred near Christmas Island?
@Victor Iannello
@Andrew
The “instructor” (check pilot) would have been in the right seat in this instance, Victor, such that the pilot being checked (in this case, a Captain) was in their usual (left) seat.
That seating arrangement sets up the circumstance where the check captain, who would normally have to reach across the throttle quadrant with their right hand for the flap position lever, had to use their left hand to reach essentially straight down in this case.
Andrew can probably offer some insights on that issues arising from having to be able to fly from either seat.
@Mick Gilbert
@Victor
Mick said: “The “instructor” (check pilot) would have been in the right seat in this instance, Victor, such that the pilot being checked (in this case, a Captain) was in their usual (left) seat.”
Yes, that was the case. Para 1.1.1 of the Preliminary Report states: “The Captain being familarized, who was occupying the left hand seat, was the Pilot Flying (PF) and the instructor pilot, occupying the right hand seat, was the Pilot Monitoring (PM).”
Preliminary Report: https://reports.aviation-safety.net/2023/20230115-0_AT76_9N-ANC_PRELIM.pdf
Operating from a different seat can cause issues, particularly if the pilot does not regularly operate from that seat. Pilots’ brains become very accustomed to one hand or the other operating various controls in the cockpit, depending on where they are sitting. When that order is reversed, there’s potential for the pilot to reach for the wrong control. It is therefore vitally important that a pilot operating in any seat visually identifies a control lever or switch to make sure their hand is on the correct control, before making a selection.
As Victor said, it seems odd that neither pilot picked up the fact the propellers had feathered. I would have thought the change in “noise” would have been a significant aural cue that something was not right, not to mention the sudden loss of all thrust. That said, I haven’t flown the aircraft and I obviously wasn’t there, so there may have been other factors that affected their perception of what had occurred.
@Andrew
Apart from all of the other factors, there seems to be no application of the concept of a “stabilised approach”.
@Mick Gilbert
No, there does not. Based on the Preliminary Report, it seems the visual approach to RW12 is somewhat shortened to avoid a conflict with aircraft operating at the old airport to the NW. The report contains an interim safety recommendation for the Nepal CAA to investigate an appropriate flight path for visual approaches to RW12 that would allow the stabilised approach criteria to be met.
@Mick Gilbert: Sorry about the right/left seat confusion. I meant right, as you, Andrew, and the report have stated.
@sk999,
In addition to the comments I previously posted about the UGIB (2020) probability of various routes matching the SATCOM and GDAS data, I call your attention to Figure 5 in that paper. The top panel in that figure shows this calculated SATCOM / GDAS probability for 7th Arc latitudes from 20S to 40S. That demonstrates that we evaluated a huge number of possible routes having widely different bearings and LNAV modes post-19:41. Indeed, as you have pointed out, there are nearby routes which also offer high probability, although the 180 degree south route is the highest. However, the selectivity of the joint PDF using all probability factors is greatly enhanced by two other PDFs. As shown in the second panel from the top of Figure 5, the fuel probability has a very steep cut-off south of 35S, effectively eliminating Points of Impact (POI) there. As shown in the fourth panel from the top in Figure 5, the CSIRO Aerial Search Probability eliminates latitudes north of 33S. Therefore, the combined fuel and aerial search probabilities only permit a small region from 33-35S. Thus, this region near 34S is indicated by those two factors (fuel and aerial search) alone. They pre-select the SATCOM / GDAS match probability in that small zone, which has its highest overall peak at 34S.
Victor and I have been working on improving the floating debris drift probability for three years. Our current drift PDF has very much higher resolution in POI latitude that what we showed three years ago in the third panel in Figure 5. This new “Drift PDF” has a resolution of one degree and shows multiple peaks (at 28/29S, 32S, 34S, and 37S). The peak at 34S is about 3X higher in probability than the other peaks. In addition, those secondary peaks all fall outside the zone passed by the combined fuel and aerial search probability. Thus, we are finding that 34S (a) is the best SATCOM / GDAS match, (b) has the highest drift probability (by a large margin), and (c) has very high probabilities for both fuel and aerial search. When one multiplies all those probability curves, as first shown by UGIB in the bottom panel in Figure 5, one is left with a very narrow peak at 34S.
For those who don’t have a copy of UGIB (2020), you can get it here:
https://drive.google.com/file/d/1-IFw_1W-Zaholln13g80FrS_o6H4c7zg/view?usp=sharing
@DrB:
I don’t know how to word this question, but I’ll give it a try. Sorry if it doesn’t make any sense. I was wondering how to interpret the composite probability density function (last graph on p.6. of your paper):
interpretation 1:
I assume in purely mathematical terms, it means there is a 70% chance that the POI (point of impact) is where the function peaks, but also a 30% chance where the function has a 30% value (~ 33-35°S).
interpretation 2:
Or should the graph rather be interpreted as pinpointing the POI, meaning that he plane really is where the function peaks (dotted red line) while the less probable areas are just inaccuracies (introduced by example by the drift model, which can never pinpoint an exact location) ?
In this specific case, I think you agree with the latter, since this track is exactly due South as an added particularity, which makes it more probable from a pilot’s practicability point of view: « the highest probability corresponds to a LNAV course of 180.0 °T from waypoint BEDAX toward the South Pole. We believe this was the True Route followed by 9M-MRO ».
Should “interpretation 2” still be preferred to “interpretation 1” if (in a hypothetical scenario) the track were far from due South (e.g. 160° S) ?
@Peter Norton,
In UGIB’s Figure 5 on page 6, the first four panels show probabilities, which range from 0 to 100%. The first panel, for instance, plots the maximum probability of matching the SATCOM / GDAS data for all routes which end at a given latitude.
The next three panels are also probabilities. The product of all four probabilities is shown in the bottom panel. It is a probability density function (PDF). It has units of probability per degree of POI latitude. The integral of the PDF over all POI latitudes is unity, or 100%. That is because, in this analysis, we assume it is certain the plane crashed somewhere along the 7th Arc, so the probability of that happening is 100%.
Nothing in these plots depends on any subjective assessment of what a pilot might or might not do.
Your first interpretation is correct. The latitude with the highest PDF value is the most likely crash latitude. However, because of the limited data and the noise in the SATCOM data, we can’t be 100% certain the plane crashed near 34S. We can only be 67% certain. The plane could have crashed at a nearby location, although that is less likely to have occurred.
Your second interpretation is incorrect. You can simplify the last plot, since it is roughly a gaussian, as being equivalent to to an estimated latitude of 34.1 +/- 0.9 degrees south. So, we can expect that 68% of the time the true crash latitude would fall between 33.2 and 35.0 degrees south. Now, we don’t have multiple trials of plane crashes. We only have one crashed aircraft, so we will never know if 68% of crashed planes did so in that latitude range. Instead, we have to look at the probability that this one trial (MH370) fell within that latitude range, and that probability is 68%. Thus, it is more likely to be inside this range than outside this range by about a factor of two. One cannot say the plane is definitely (100%) at 34.1S. All we can say is that there is a 68% chance it is between 32.2S and 35.0S.
Now, if you want, you can assume that the BEDAX to South Pole route is the most likely of all routes ending between 32.2S and 35.0S, and thus 34.2S is somehow “special” and deserving of a higher likelihood, but none of this conjecture affects Figure 5. Even when assuming that route was followed, the debris field is not precisely locatable because we don’t know how far off course the aircraft was when it impacted the sea. We could bound that distance off course if we knew when the aircraft crashed., but we don’t know that either. We do know the aircraft could not have traveled more than 140 NM from where it was at MEFE (00:17:30), even with the optimum glide. It might have impacted prior to 00:21:07 (the missing IFE transmission), but, if so, the debris field should be within the previously searched swath along Arc 7. Since it was not found there, then one must conclude either it was missed as an “unlucky” event by being in one of the small unsearched areas, or it was detected but misclassified, or it remained airborne after 00:21:07 and ended up farther from Arc 7 than the previous searches covered.
@DrB:
Many thanks for making sense of my ill-defined question and for such a detailed answer and excellent explanation.
The UGIB paper appears very convincing to me. I think you have found the right location.
@Peter Norton,
You said: “The UGIB paper appears very convincing to me. I think you have found the right location.”
We will only know that when and if the aircraft debris field is found. We all hope that occurs during the next search season.
I believe our new debris drift prediction of the Point-of-Impact latitude on Arc 7 is more precise and/or more reliable than previous drift analyses. It indicates a most-likely POI location that is only 20 NM +/- 34 NM (at one sigma) from the UGIB LEP. So we now have two completely independent analysis methods and data sets which consistently indicate the same location. It’s hard to see how both methods could be wrong and by the same amount. It’s more likely that this location is close to the debris field. How close depends on what assumptions you are willing to make. That can be risky. I am reminded of a Mark Twain quotation: “What gets us into trouble is not what we don’t know. It’s what we know for sure that just ain’t so.”
@DrB:
It’s exciting to think how close the world is to finding the plane.
Are there any weak points in the UGIB paper ?
Has anyone offered serious negative criticism of parts of the paper ?
@Peter Norton,
Regarding “weak points” in the UGIB (2020) paper, my main concern after three years is that there is a faulty assumption which has not yet been identified. We tried to make as few assumptions as possible to minimize this possibility. Regarding criticisms, I’m sure there are readers who are not persuaded, but no other locations on Arc 7 are supported by such rigorous analysis. I also point out that the UGIB LEP is not far from the Inmarsat prediction and from the recent Blelly and Marchand prediction.
Additional route and fuel modeling after March 2020 revealed that there were a few routes, suggested by others and subsequently confirmed by us, ending as far south as 36S and for which there was marginally adequate fuel. This point was discussed on this blog. I have since modified the fuel probability curve to include those findings, and there will be an updated equivalent to Figure 5 in the upcoming drift analysis paper. The new overall PDF has the modified fuel probability curve and the much-improved drift probability curve.
So far, to the best of my knowledge, no significant errors have been identified in the methods or the calculations used in UGIB. That doesn’t guarantee the conclusions are accurate, but it does provide some confidence that our LEP is worthy of being a high priority search area.
One finding in UGIB is somewhat controversial, even among its authors. That is the conclusion that it is likely that the bleed air had to be off for the post-19:41 route. Thus the cabin would have been depressurized during the last 5 hours of the flight. The result of that finding is the inescapable conclusion that there were no humans alive at flame-out. The statistical confidence in that result is high, being about 3 sigmas. However, perhaps there is an unknown error buried in the fuel flow calculations, and possibly a piloted glide was possible and occurred after flame-out. That is one explanation for the lack of success of the previous searches, but not the only one. Again, we won’t know whether a significant piloted glide occurred until the debris field is located. If it is within the zone of possible aircraft locations at 00:21:07, that would confirm a glide is highly unlikely to have occurred. On the other hand, if the debris field is located farther from Arc 7 than the coverage of previous searches, then it becomes certain that the aircraft remained aloft after 00:21:07, and either a pilot glided the aircraft or it remained aloft longer than suggested by flight simulations, despite having no auto-pilot and no pilot.
@Peter Norton:
Has anyone offered serious negative criticism of parts of the paper ?
@sk999 believes there is no statistical preference for the BEDAX-South Pole path, which differs from our conclusion. We’ve never resolved this.
I offer some reasons why the conclusions might not be correct:
1) Fuel flow calculations are not correct due to assumptions such as the correction for non-standard temperature.
2) The assumption about automated flight after 19:41 with no pilot inputs and no maneuvers is not correct.
3) The errors in the wind and temperature fields are much larger than assumed.
4) There is an error in the complex statistical analysis somewhere that we have not caught.
5) We don’t know what we don’t know.
I think the main criticism of the work is that since our best estimate is the plane crossed the 7th arc at the LEP, and the end-of-flight path should have been a short distance from there, the plane should have already been found. It’s possible that the debris field was not found because it is either located where we have low quality or missing data, or the plane landed wider from the 7th arc due to a piloted glide. So, either we’ve been unlucky, or the assumption about no pilot inputs after 19:41 are wrong.
I am not so confident in UGIB that I would suggest planning a search only in areas close to the LEP. Rather, I would suggest starting there, with a plan to fill in missing data, and then search wide over some range of latitudes, such as 32S to 36S.
@Victor Iannello
« no longer believe the impact occurred near Christmas Island? »
1- I am openminded 🙂 There are two possible starting hypotheses: the hijacker(s) aimed at keeping the passengers alive and targeted an airfield or the hijackers did not aim at keeping them alive and took a one-way ticket.
In CAPTIO and later as CAPTION, I studied the most realistic possible trajectories starting from the first hypothesis with different sub-hypotheses. On the other hand, Captain Blelly started from the second hypothesis and I helped him going to the details and validate the most operationally realistic trajectory. I think we have to stay open to other’s studies until the wreck is found.
« how did you select that particular path over many others? »
2- The key starting point is the location of phone call-1 at 18h40 that Captain Belly had roughly estimated in his book. What quantity of fuel remained at that point ? Then from this value one can deduced the average hourly consumption until the end, thus the speed and the FL. Of course the fuel quantity at Call1 depends on the previous path followed in the FMT. Thus our detailed study of this turn helped to locate Call1 more precisely and thus to evaluate the remaining fuel. Then, basically only one trajectory fits the data when considering avoiding the adverse meteo.
We should probably have put the Executive Summary at the end as the conclusion :-). Thus let’s make it simple:
@airlandseaman @Mick Gilbert
« 480 KTAS is still a little lower than what we measured at KB (~502 KTAS) ».
1) Where does your 480 KTAS calculation come from ? It is 495 KTAS actually.
Here is our computation according to pilots’ habits:
Distance official Exit point (after IGARI) to South of Penang = 235 Nm
flown in 27min47sec
-> average ground speed is 508 kt with the wind at FL300
= 495 KTAS
Furthermore, at ISA+15.6 (from ACARS report at 28938ft at 16h56) -> 309kt IAS rounded at ~310kt IAS.
Wind and delta ISA have to be encountered for.
Thus, on that leg, we consider that the given average KTAS495 leads to IAS310 at FL300 (M0.813). I hope it is clearer.
« And the altitude was definitely ~40,000 feet (~FL380), not FL300 »
2) You probably mean true height ~40000ft (note that altitude is MSL).
FL384 you say ? This is one estimation (yours actually) from raw data from an approach radar not meant for En-route tracking (cf Malaysian report). Please see above the speed calculation that pilots usually do, this is a trustful estimation. FL384 is not a « known » absolute value or any official given data.
By the way at 17h24:57 just after the U-turn, and I refer to fig 1.1b page 8 of the Malaysian report (2018), the military radar shows echoes return at a height of 31150ft which corresponds to FL300. In addition, it appears that you also don’t consider the Butterworth radar records at 18h22:12 at the altitude of 29500ft MSL as given in the Malaysian report and keep the flight at FL385. Why ?
« FL384 and the average 502 KTAS »
3) Preliminary remark, this is different from the UGIB report where it is actually written 507.5KTAS for matching a GS=530kt… so which one ? 🙂
Given the delta ISA, 502 KTAS gives a Mach =0.870 (MMO) which is the top level of the flight envelope, while 507.5KTAS leads to M0.88 largely outside of it.
It means that as 502KTAS is an average, there would be several times when the speed will be above the MMO (or constantly in the case of 507.5KTAS). Thus the pilot had to « fight » against the column as explained by Boeing in Appendix 1.6E, quoting «
While operating above MMO is technically feasible, the condition was considered unlikely as it would induce an overspeed warning, and the overspeed protection control laws would activate. Activation of the overspeed protection control law results in trailing- edge-up elevator to increase the pitch attitude, thereby slowing down the airplane. Pilot intervention would need to occur by pushing forward on the column to keep the airspeed above MMO. During Segment 3, the assumed altitude of the flight path was reduced to 30,000 feet altitude (FL300) to keep the Mach number below MMO. »
Please note also that the auto throttle does not go above M0.870 by itself, the pilot must manually push forward the throttle. And when released, the throttle comes back to maintain max M0.870.
We find this situation unlikely because it is too difficult to sustain and without any reason especially if the speed had to be reduced shortly after Penang. In addition this is worse than manually piloting as the pilot cannot keep a free hand with both hands grasping firmly the column which is extremely physical and even more with the throttle issue.
Please Andrew, as a Captain, could you comment on this ?
@Mick Gilbert
« So, where did the FL300/310kts fiction come from? »
4) Above we have exposed several documented reasons to consider that FL300 was the privileged flight level as suggested by Boeing and the Malaysian report. And it is also well justified later by the fuel consumption during the southern leg.
Thus in return I think I would be allowed to ask you « so where did the FL385/numerous speeds come from ? » 🙂
If you need a detailed discussion and have any detailed questions, our mail addresses are on the first page of the report.
Best.
JLuc
@all
I should add that answers to the questions above can be found in the report after the Executive Summary …and after the ToC 🙂
The “IAS310/FL300” is explained in details among other numerous things.
Have a good reading !
I offer some further commentary on why UGIB conclusions might not be correct.
As Victor demonstrated long ago with his Great Circles post, there is a wide range of solutions that provide acceptable BTO fit from the 1941 arc. Additional “filters” are required to discriminate among solutions and UGIB does this using a combination of BFO, fuel, drift. I confess a bias towards far south solutions, for reasons that I’ll return to. So my probing of the assumptions applied to these three discriminators is coloured by that.
BFO. We know that this may be subject to bias drift. It might also have re-trace error (a fixed offset) after re-start. If major changes in cabin temperature also occurred, then the margin of uncertainty increases still further. The fact that nearly all straight line solutions entail a major BFO residual error at 1941 gives us a clue that something might be off with the BFO.
Fuel. A little more endurance may be obtainable by accessing “unmeasured fuel”. The residual in wing tanks is likely quite small. Another possibility is fuel accessed below prior scavenge auto-off from the centre tank. But the main thing that would substantially increase fuel endurance – is a lengthy powered drift down when fuel was low or one engine operating. Indeed if your intent was to fly as far as possible, that would be preferably to fuel out at altitude followed by uncontrolled descent (or even manual glide with degraded control).
Drift. I am sure that the drift modelling has been done meticulously and I am familiar with the underlying models. My main difficulty is the assumed wind factor – whether it is expressed as leeway + stokes drift or all baked into a % of wind. I have previously shared references demonstrating that highly buoyant items with minimal draught exhibit a wind factor of 3-5%, plus a directional offset to wind direction that is difficult to predict. A change in wind factor of this magnitude is enough to grossly alter the predicted drift velocity.
Finally, by starting at 1941, the UGIB approach ignores the most obvious discriminator of all, namely what “joins up” with the Arc 1 crossing at 1825. A seamless connection (aka single-turn solution) requires a very early turn, from which the straight line solution goes to the far south, as DSTGs hotspot showed.
For the plane not to have turned before 1840 and to get to a position on 1941 arc compatible with UGIB requires two inherently improbable assumptions. One, that the BFO at 1840 was produced by a descent of just the right rate, at just the right time, that was so steady it produced constant BFOs. Second, that the aircraft flew fast and straight from Penang to Arc 1, and fast and straight from Arc 2 to the end, but somehow “fiddled and diddled” in between to lose enough time to arrive at the right place on Arc 2.
@Jean-Luc Marchand – CAPTION
Jean-Luc, you can dress it up any way you like but the simple fact of the matter is that there is no evidence at all that the aircraft traversed the Malay Peninsula at FL300. There is, however, good evidence to the contrary, specifically the Kota Bharu primary approach radar data. The plot of that data has been in the public record since the publication of the Factual Report in March 2015.
Regarding your reference that the “Butterworth radar records at 18h22:12 at the altitude of 29500ft MSL as given in the Malaysian report” you must surely be familiar with the very clear caveat contained in the same report at 1.1.3 Diversion from Filed Flight Plan Route 1) Malaysian Military Radar. Regarding the military radar data the report is unequivocal;
“…the altitude and speed extracted from the data are subjected to inherent error. The only useful information obtained from the Military radar was the latitude and longitude position of the aircraft as this data is reasonably accurate.” (My bolding for emphasis.)
@Jean-Luc Marchand – CAPTION
Regards
“@Mick Gilbert
« So, where did the FL300/310kts fiction come from? »“,
wrong Michael, I didn’t pose that question.
@Jean-Luc Marchand said: In CAPTIO and later as CAPTION, I studied the most realistic possible trajectories starting from the first hypothesis with different sub-hypotheses.
Good luck in finding a preferred path based on what you believe is the most realistic possible trajectory. At best, you’ll find a possible path, but to assign that path as most likely is very subjective.
@DrB and @VictorIannello: thank you, both of your self-assessments were interesting reads.
On another note, I was only able to find the offical ATC transcript here. I am still looking for the original audio files (not a re-encoding posted on youtube). Do you know where to find them?
@Jean-Luc Marchand
RE: “Preliminary remark, this is different from the UGIB report where it is actually written 507.5KTAS for matching a GS=530kt… so which one ?
Given the delta ISA, 502 KTAS gives a Mach =0.870 (MMO) which is the top level of the flight envelope, while 507.5KTAS leads to M0.88 largely outside of it.”
The method used by UGIB to estimate the groundspeed and TAS/Mach was subject to some error, which was acknowledged in the report. Note the difference in TAS between M0.87 and M0.88 is only about 5 knots. UGIB stated the following (my emphasis):
…At a track of 239°T, the tailwind was 22.4 knots, which means that the true airspeed (TAS) was about 507.5 knots, and the Mach number was 0.878. This is close (less than 5 knots) to the maximum operating Mach value (Mmo) of 0.870 for the B777-200ER.
Considering the 2.7-knot standard deviation in ground-speed that was calculated over the final 8.7 min that was captured by the Kota Bharu radar and the several knot error in the GDAS data, we estimate that the aircraft was flying at about Mmo = 0.870 and at about FL385 as it passed near Kota Bharu.
In short, UGIB did NOT propose the aircraft was flying at M0.88, outside the certified flight envelope.
@Paul Smithson,
The far-south route you support requires several anomalous or impossible events to occur in order for it to become feasible.
1. First, there has to be a new type of glitch in the BFO to produce a sudden offset shift that could make the BFO residuals acceptable for far-south routes. That has never been seen as far as I know. Sure, the BFORs drift a bit because of the OCXO drift, but that drift has never exhibited a “step” in the BFO bias to my knowledge.
2. You need fuel to magically appear out of thin air, and quite a bit of it. The fact is that, unless 9M-MRO went into holding speed with reduced fuel consumption for a good part of an hour, MEFE would occur prior to 00:17:30 no matter what bearing you flew. That is why the fuel probability is virtually zero for routes ending south of 37S (which must be flown at a higher ground speed and a higher fuel flow), even with a holding speed segment. Without that half-hour slow-down, the fuel will be exhausted well before 00:17:30, even at the UGIB route to 34S. Simply put, your favored “seamless connection” route with no slow-down runs out of fuel too soon. So, it’s impossible to fly it.
3. Third, your proposed “lengthy powered drift down” fails in two regards at ARC 6. It falls short of Arc 6 causing excessive BTO error then, and the BFO at 00:11:00 would indicate a slow descent, which it does not.
For these reasons, the far-south routes are incompatible with the MH370 data we have. In addition, they are contraindicated by my new drift analyses.
My recent drift analyses effectively allow the windage of each debris to vary over a wide range, producing an adjustable average transit speed. Even when I fit a variable transit speed correction factor, POIs south of 37S have a very low probability of matching the MH370 debris finds. What this means is that the drift patterns from the far-south POIs are not simply time-delayed replicas of the drift patterns from 34S. If that were true, then there would be no latitude discrimination when I allow the windage to be independently optimized for each crash latitude bin along Arc 7. Yet, I find the discrimination remains high when using numerous debris, indicating 34S as the highest probability (by far), even when allowing the transit speed to be independently optimized for each POI latitude bin. The discrimination is apparently also strong because the drift trajectories vary spatially as well as temporally.
A final point is that a half-hour at holding speed is necessary to have sufficient fuel to then cruise from 19:41 until MEFE at 00:17:30. It is possible to connect the radar track at 18:22 to the 19:41 location without a descent, but this offers no advantage in matching the observed BFOs. The path we proposed in UGIB provides: (a) a good BFO match, (b) a plausible means for avoiding Indonesian radar detection and visual sightings at populated areas, (c) follows FIR boundaries, (d) passes where Kate Tee says she saw an aircraft at low altitude, (e) matches the fuel savings necessary to achieve MEFE at the correct time, and (f) seamlessly matches the BEDAX to South Pole route at the correct location and time. What’s not to like?
@Jean-Luc Marchand
RE: “We find this situation unlikely because it is too difficult to sustain and without any reason especially if the speed had to be reduced shortly after Penang. In addition this is worse than manually piloting as the pilot cannot keep a free hand with both hands grasping firmly the column which is extremely physical and even more with the throttle issue.
Please Andrew, as a Captain, could you comment on this ?”
Maintaining the speed above VMO/MMO would certainly be a demanding exercise for the pilot. I do not support such a scenario and, as noted above, UGIB did not propose the aircraft was flying outside the certified flight envelope.
The autothrottle issue mentioned in your comment is easily circumvented by selecting the A/T ARM switches OFF.
@Jean-Luc Marchand. You indicate that the final log-on request (LOR) would have been prompted by the power break during automatic switching of the SDU electrical power source from the left engine, on shut down, to the APU.
About automatic switching between the left and right buses, from the ATSB, “….This power switching is brief and the SDU was designed to ‘hold-up’ during such power interruptions. To experience a power interruption sufficiently long to generate a log on request, it was considered that a loss of both AC buses or, a disabling of the automatic switching, would be required.” (Flight Path Analysis Update 30 July 2015, p.33).
I think we could expect automatic switching from the left bus to the APU to have the same character.
Do you have information to the contrary?
If not, going on, I note that your fig.55 has the pilot starting the APU at over 2 minutes before he shuts down the left engine. From the above, with the APU standing by to take the load after a minute, when then it did the SDU would ‘hold-up’. So there would be no SDU reboot and thus no LOR then.
I doubt even an expert pilot would be up with all of this, though he would be aware that the APU takes a minute to start. Thus he would have started it more than that before he shut down the left engine, as you say.
Even so, while your paper is based on the pilot necessarily being expert I suppose there could have been another, inexpert, taking over flying the aircraft at the end.
If so and he selected APU start less than 50 seconds before shutting the engine down, it would come on line and restore SDU power already lost, that being during run down some 10 seconds after shut down (@Andrew’s estimate, as per UGIB p.80). The LOR would follow at SDU reboot a minute later.
Even should he not have selected APU start at all, it would auto-start at power loss and there would be an LOR 2 minutes later, like that following power loss due to engine fuel exhaustion.
Either way the aircraft plunge at LOR would be consistent with there being an inexpert and startled pilot at that stage, distracted while he stabilised the aircraft.
Still, in this inexpert hypothetical it would seem unlikely that such a pilot would then elect to lower flaps and ditch the aircraft and even less so that that would lead to your assessment of flotsam damage, particularly without engines.
But that begs the question as to why he would he have chosen to ditch with fuel remaining yet without engine power, that being unforgiving as to its final timing, particularly in seas.
Moreover why indeed would an expert pilot have? Why wouldn’t he have chosen to ditch with both engines powered, opening the cross feed fuel valves as needs be. Doesn’t that alone add considerable doubt to there having been an active pilot at all?
Furthermore there was the plunge.
The remaining alternative, an active pilot at the end being most unlikely, is that the LOR did follow fuel exhaustion without pilot intervention, the postulation of the ATSB, many others and a UGIB conclusion.
That would mean that a glide of any sizeable straight line distance-of-advance would be most unlikely also. And yes, that applies to all other theories as to track and its causation.
Likewise a ditching would be more or less ruled out, adding to other doubts about your flotsam damage assessment. Even in an equally unlikely low speed impact during a spiralling phugoid, no flaps would have been deployed and, based on simulations, wings would not have been level so ditching-like damage could not be expected from that either.
@Jean-Luc Marchand, @Andrew: I doubt that envelope protection would kick-in exactly at Mmo, or else it would be difficult for the autopilot to maintain altitude while flying at M0.87 with some mountain wave. Without the autothrottle engaged, my guess it would be possible to fly a bit above Mmo (maybe as high as M0.88) before envelope protection raised the nose. In fact, this might have occurred after the turnback at IGARI.
@Brian Anderson
Hi Brian, it has been a lot time since our last discussion for CAPTIO, but here the geometry and profile is different as it is levelled and we can assume it is in straight line approximately. Thus your paper on 26 Dec 2014 is of interest.
Before going to the details, I would underline that you conclude that any ground speed between 400kt and 510kts are admissible. And that was wise 🙂 because in our case at true height 31150ft, the tangent location occurs at t=19h41:03 + 1:50 approximately, measured on the computed BTOs along our trajectory. This is coherent in regards to the ground speed we found at 434kt and the ground speed of 494kt for a tangent at 19h41:03 + 11:12 that you estimated.
Your method considers that an arc is a simple portion of a circle with no thickness and you consider Arc2 and Arc3 radii at one chosen fixed value each, i.e. 1757.25 and 1796.56 NM respectively without specifying the origin precisely. But an arc is not a dimensionless line, it is a ring with 3 dimensions because it is the volume limited in the West and East by the two spheres of BTO-/+50μs at the bottom by the earth and at the top by an ellipsoid at the max flyable true height. Thus the min radius and the max radius of an arc is function of the true height considered (this is explained in Annex 3: MH370: Mastering BFO Residuals for Trajectory Selection of my document published here : http://www.mh370-caption.net/wp-content/uploads/How_Many_Straight_line_trajectories_for_MH370-v1c.pdf ).
Thus, one could consider that an arc includes an infinity of radii within a finite interval.
The computation in your paper is restricted to only one arbitrarily chosen radius per arc which means that you have implicitly chosen « a priori » the true height of the plane in which you expect the aircraft to have flown. In your case, a given radius corresponds a unique center Arc which is located at a unique true height and vice-versa, at an arc a given true height gives a unique radius.
But in this plane the arcs projections are swaths which imply a much higher complexity for computing intervals of distances and thus intervals of admissible speeds. For example, at true height 30000ft, arc2 swath is 17Nm wide while Arc3 swath is 16Nm. Thus the choice of the radius for a unique computation is thus very inflencial as you did in your paper. In addition, the true track angle adds a « 3rd » dimension to the computation due to the thickness of the arcs.
This calls for a larger study defining the min and max values for the admissible speed.
One can understand that the tangent location depends on the geometry (and thus its time tag) and that the distance between the arcs gives the ground speed.
Thus, the GS 494kt found in your paper is one example among others and is the logical result based on your a-priori choices : a specific radii which implies a unique true height and the chosen date which appears to be linked to a specific BTO data set (also linked to the true height).
In conclusion, our finding of a GS 434kt at True Track around 186° at FL300 is perfectly admissible and is coherent with your found speed interval.
🙂
Jean-Luc Marchand – CAPTION:
Re: 310 knots…I missed your IAS units. (Why would anyone care about the IAS anyway?) I thought you were suggesting a speed of 310 KTAS. That was my mistake, which Victor brought to my attention immediately, and I corrected immediately after he alerted me to the error. So, whether 480, 495 or 502 KTAS depends on altitude assumptions, temperature at altitude, etc.
Re Altitude: As others have pointed out yet again above (how many times must it be said?), NONE of the military PSR altitude data is reliable. None of the reported values are even roughly accurate. Some were off by 30,000-40,000 feet! So using a military radar derived altitude at long range around IGARI as the factual altitude of FL300 is simply wrong.
OTOH, contrary to your assertions, the ~40,000 foot altitude at KB (~FL380), derived from the raw KB civil PSR data, is based on facts. It was well vetted by several independent investigators (including me, Victor and Bobby to name only 3) over a year of intensive investigation and analysis. In fact, the KB PSR ground speed time series from 17:30 to 17:45 provided us with two important facts:
1) the altitude at KB was ~40,000 feet (FL380)
2) the ground speed increased in 3 discrete steps from a low of 460 kts at 17:31 to 530 kts at 17:36. See plot here:
https://bit.ly/37HY8W5
GDAS wind at 40,000 feet gives us a true airspeed of ~502 KTAS at KB. KB and BU radar data plus GDAS winds confirm that the TAS remained close to 502 kts all the way to 18:22. Thus, it is unlikely the altitude changed significantly between 17:38 and 18:22.
The 3 speed steps are as important as the altitude derivation from the KB data. To me, they are a clear indication the altitude between 17:21 and 17:30 was higher than 40,000 feet, and probably close to 43,000 feet. This in turn indicates a manually flown 180 turn during which the pilot initially traded speed for altitude and then altitude for speed once the turn back was complete. I have executed the same type of turn hundreds of times when I needed to reverse course in a hurry. (If you have ever tried to penetrate the secondary rotor to reach the primary of a wave, and hit violent turbulence and strong sink, you know what I’m talking about!)
@Dr B the purpose of my post was to elaborate concerns around the level of confidence that can be placed in BFO, fuel and drift as reliable discriminators among the broad spectrum of BTO-compliant solutions from 1941. Your reply didn’t address the points raised.
Regarding the insensitivity of drift results to windage, I would be extremely surprised if that were the case. By the time your wind factor is in the region of 3% it will exceed the typical ocean surface current vector by some margin. I’d imagine that the greater constancy of wind direction would also reduce duration stuck on OSC eddies, but you would need a properly integrated drift model with real-time OSC and wind to test that supposition.
In my view, the lack of a sensitivity analysis that includes wind factors across a plausible range is the greatest vulnerability of the drift models. Plus, in general, the rather poor predictive performance of drift modelling in real life even over rather short time & space (e.g. search and rescue, pollution prediction).
@Jean-Luc Marchand. The second last paragraph in my 2:48 am above should be replaced with, just, “That would mean that a glide of any sizeable straight line distance-of-advance in your case would be most unlikely.”
@Paul Smithson: The fuel shortage of your path is hard to reconcile. The great circle paths I proposed in this article back in 2017 did not consider fuel consumption. At latitudes close to where you propose, if the BTO is matched, the speed is too fast and the plane runs out of fuel. If a mode is selected like LRC which reduces the fuel burn, then the BTO match is unacceptable. I don’t know how to get past this.
On the other hand, I do like the simplicity of your path and the fact there is no need for a time-delay element between 18:28 and 19:41, which I view as a weakness of the UGIB path. That doesn’t mean a maneuver causing the delay didn’t occur. It just means with all things equal (which they are not), I would favor a path without the delay element.
@Victor. Agreed that fuel shortage remains the biggest problem with my path model. But even UGIB requires fuel-saving interventions that would be unconventional in cruise. So, it may be that there are problems with the fuel model, or that the published tables include a small favourable margin for planning purposes. It may be that shutting down electrical loads produces greater savings than assumed. It may be that there is significant fuel accessible below fuel=0. Or it may be that the plane drifted down at the end of flight – which produces the greatest fuel saving/endurance extension of all.
I agree with Dr B that conventional descent rate is incompatible with BFO at 00:11, but drift down isn’t (settles at -400 to -600fpm after slightly higher rate initially). Under drift down scenario the aircraft will not slow down as rapidly as in the level flight MEFE scenarios, so I believe its still possible to get to the church on time at Arc 6 and 7.
@Paul Smithson said: So, it may be that there are problems with the fuel model, or that the published tables include a small favourable margin for planning purposes.
If you are implying that the fuel flows values in the tables are deliberately too high in order to be safe, I doubt that is true. These tables, used in combination with a “fuel factor”, are used for flight planning calculations, and reserves are added to these best estimates for safety.
@Paul Smithson,
You said: “@Dr B the purpose of my post was to elaborate concerns around the level of confidence that can be placed in BFO, fuel and drift as reliable discriminators among the broad spectrum of BTO-compliant solutions from 1941. Your reply didn’t address the points raised.”
On the contrary, I addressed ALL those concerns you raised.
1. Regarding the BFOs, you said: “BFO. We know that this may be subject to bias drift. It might also have re-trace error (a fixed offset) after re-start. If major changes in cabin temperature also occurred, then the margin of uncertainty increases still further. The fact that nearly all straight line solutions entail a major BFO residual error at 1941 gives us a clue that something might be off with the BFO.”
I responded: “First, there has to be a new type of glitch in the BFO to produce a sudden offset shift that could make the BFO residuals acceptable for far-south routes. That has never been seen as far as I know. Sure, the BFORs drift a bit because of the OCXO drift, but that drift has never exhibited a “step” in the BFO bias to my knowledge.”
2. Reqarding the fuel, you said: “Fuel. A little more endurance may be obtainable by accessing “unmeasured fuel”. The residual in wing tanks is likely quite small. Another possibility is fuel accessed below prior scavenge auto-off from the centre tank. But the main thing that would substantially increase fuel endurance – is a lengthy powered drift down when fuel was low or one engine operating. Indeed if your intent was to fly as far as possible, that would be preferably to fuel out at altitude followed by uncontrolled descent (or even manual glide with degraded control).”
I responded by saying: “You need fuel to magically appear out of thin air, and quite a bit of it. The fact is that, unless 9M-MRO went into holding speed with reduced fuel consumption for a good part of an hour, MEFE would occur prior to 00:17:30 no matter what bearing you flew. That is why the fuel probability is virtually zero for routes ending south of 37S (which must be flown at a higher ground speed and a higher fuel flow), even with a holding speed segment. Without that half-hour slow-down, the fuel will be exhausted well before 00:17:30, even at the UGIB route to 34S. Simply put, your favored “seamless connection” route with no slow-down runs out of fuel too soon. So, it’s impossible to fly it.”
3. Regarding the drift, you said: “Drift. I am sure that the drift modelling has been done meticulously and I am familiar with the underlying models. My main difficulty is the assumed wind factor – whether it is expressed as leeway + stokes drift or all baked into a % of wind. I have previously shared references demonstrating that highly buoyant items with minimal draught exhibit a wind factor of 3-5%, plus a directional offset to wind direction that is difficult to predict. A change in wind factor of this magnitude is enough to grossly alter the predicted drift velocity.”
I responded by saying: “My recent drift analyses effectively allow the windage of each debris to vary over a wide range, producing an adjustable average transit speed. Even when I fit a variable transit speed correction factor, POIs south of 37S have a very low probability of matching the MH370 debris finds. What this means is that the drift patterns from the far-south POIs are not simply time-delayed replicas of the drift patterns from 34S. If that were true, then there would be no latitude discrimination when I allow the windage to be independently optimized for each crash latitude bin along Arc 7. Yet, I find the discrimination remains high when using numerous debris, indicating 34S as the highest probability (by far), even when allowing the transit speed to be independently optimized for each POI latitude bin. The discrimination is apparently also strong because the drift trajectories vary spatially as well as temporally.”
Maybe you don’t like the answers, but it is incorrect to say that I “didn’t address the points raised.” I addressed all of them.
Another point regarding debris drift analysis is that David Griffin estimates the wind contribution to the transit time/speed from Arc 7 to near Africa is about 20%, and the near-surface water currents contribute 80% to that drift. So, significant changes in the windage don’t change the overall speed by a large fraction. Dr. Griffin gave me bounds on the windage parameters for the recovered MH370 debris. He estimates they are all between 0.8% and 2.0%. His model assumes 1.2%. So, I allowed the wind contribution to vary between those bounds when I found the best fitting transit speeds from each latitude bin on Arc 7. He also said CSIRO used higher windages than 2% for planning the initial aerial search because there might be high-flotation items like seat cushions still afloat in the first few months. None of those very high windage items were eventually recovered, with the possible exception of the towelette package.
You also said: “In my view, the lack of a sensitivity analysis that includes wind factors across a plausible range is the greatest vulnerability of the drift models.”
That is a concern for previously published drift models. However, my ongoing drift analysis allows the average drift speed to be optimized at each POI latitude bin for each debris. In testing this method, I found that a clear pattern of best-fitting “transit speed correction factors” (TSCFs) versus POI latitude was very difficult to discern for any single debris. I was forced to ASSUME different TSCFs, holding them constant, and then fit the time and distance window parameters in order to discern a systematic variation in POI latitude versus TSCF. This result implies the time-shift effect exists, but other factors, such as debris finding location and especially the position of the estimated arriving date relative to the set of Weibullian arriving waves, are also important. In addition, for those debris found with no barnacles attached, a wide range of arriving dates (say 6 months) is allowed. For instance, if a debris arrives between two predicted arriving waves of trials, there is ambiguity of whether the debris was at the end of the first arriving wave or at the beginning of the second arriving wave. The reporting delay for those clean debris could be anywhere from a week to 6 months. Therefore, for barnacle-free debris, there is a “built-in” allowance for “model drift speed errors” because of the large range of acceptable arriving dates which are all consistent with the reporting date. Therefore, for all but a few MH370 debris, the windage used in the drift model is not especially critical, and a fairly wide range of windages of debris originating from different POI latitude bins could all be predicted to arrive at a time consistent with the reporting date. So, there is already a considerable insensitivity to model windage errors for barnacle-free debris, and I have further increased the windage insensitivity using the TSCF for both clean and barnacled debris.
@UGIB:
I raised questions about the UGIB paper shortly after it was presented, because it appears to exclude all other candidate sites except those presented by the authors. Now I would like to point out several reasons why the UGIB conclusions do not apply to my acoustic candidate site near Java.
Their first assumption is that the plane was on an unpiloted path south, because that’s the only one that can be optimized to meet the SATCOM pings. It was that assumption that also drove all of the past SATCOM based priority searche areas. However, there are endless possibilities for piloted paths with more turns that match additional evidence.
Because of the base assumption of a flight to oblivion, there were no surface searches north of 20S. The Java site epicenter as pinpointed by many seismometers is at 8.36S directly on the 7th Arc, but the candidate site was not made public until 2018. Many MH370 studies, including the UGIB paper, did not even consider latitudes farther north. Their graphs stop short at 20S.
The UGIB considered fuel exhaustion probability only for variations of an unpiloted high altitude cruise level seeking maximum range to reach the 7th Arc. Their FE probability tapers off toward zero at the Java site because they did not consider a low and slow path for maximum endurance toward daylight rather than range to reach a southern 7th Arc. I proposed a complete flight path plotted for oxygen altitude and the fuel endurance is a very good match for Boeing’s projections, also exhausting fuel at the candidate site.
This brings up the problem of taking the product rather than sum of multiple uncertain probabilities to derive a final density function. If any one of the multipliers has a very low value, it causes other sources with high probability to be eliminated in the result.
This happens again in the UGIB paper regarding surface search probability. A measure of “probability of non-detection” came from expected source origins by reverse drift to the 7th Arc from areas searched. Summed by latitude, data values disappeared at the north end of the chart, heading toward zero probability where there was no search. Common sense says that the chance of not detecting debris from a crash site farther north is 100% if there was never search anywhere near that area.
The UGIB paper has a glaring omission of the underwater areas already searched. The official estimate was 5% confidence that the debris field was missed in the Phase 2 scans. OI significantly increased the area searched and filled in many gaps (ref the above Iannello paper). A summation method by latitude used for aerial searches could be used for the underwater search areas. That would give a value of much less than 5% for the searched 7th Arc, with 100% elsewhere (including Java). Used in the product PDF calculation, it seriously diminishes the end result for their candidate area, and boost others.
The UGIB drift probability curve also tapers down to 20% near Java. Unpublished updates may change that, but the their computation uses a unique clustering by geographic zones matching predicted drift arrivals. The tapering is because they allow only a 10% time margin for early arrival, plus a 45 day window for debris to be found. This penalizes candidates farther north with a cutoff for each particle to zero probability. Although various drift models showing that the debris from the Java candidate site would approximately end up at all the places it was found, it is predicted to arrive earlier than the UGIB cutoff dates. This does not take into account that most of the Madagascar zone debris was found within a six day window, during a concerted search. It also seems unlikely that the first pieces found in 2015, Flaperon and Roy, were in UGIB geographical zones that had only 0.4% of the particles modeled. Or, that Roy traveled the farthest to South Africa in 655 days, while the Southern Equatorial Current splits first at Madagascar, but debris there was found after around 800 days. The Mozambique zone is also out of order with a range from 659 to 902 days before being found. These are huge gaps in when debris was found, far longer than than 10% plus 45 days. Recently, several arguments have been made in this forum for why the VOR 65 Team Vestas Wind crash debris took years to travel a much shorter distance from Mauritius to Madagascar. Those same arguments refute the narrow timing window used in the UGIB paper to exclude late debris finds.
Additional evidence from barnacle analysis is also omitted. The initial estimate of growth rate has been corrected by later studies. There is no feasible way for growth from a cold water site to start at the warm end of the gooseneck reproductive range. Incorporating a probability curve for barnacles would give a sigmoid centered around 20S latitude.
It seems the UGIB paper is trying to derive a very narrow search zone by multiplying selected probabilities. Summation with more evidence would give a more reasonable result, but of course with more peaks and potential candidates. Narrowing the UGIB candidate area may make a search there more likely, but the methods used do not apply to the Java candidate site, and should not be a reason to exclude such a specific site from a future search.
— Ed Anderson 370Location.org
@Dr B. Thank you for responding further. We have misunderstood one another. My earlier post was a comment on reasons why we cannot have such a high level of confidence in BFO, fuel or drift as discriminators in the UGIB model. Your reply did indeed discuss BFO, fuel and drift – but largely with reference to critiquing the path model that I have proposed. So, allow me to try again.
1. The UGIB methodology relies upon compounding probability from independent sources namely BTO, BFO, fuel, drift.
2. The resulting peak probability is determined by the shape of all of those, and in some cases is overwhelmingly influenced by a single factor (eg your fuel curve rules out everything south of 37).
3. My post said why I thought each of the “discriminator factors” is subject to doubt, beyond the uncertainty in the models themselves. BFO may be out because of retrace error, drift or major changes in ambient cabin temperature. Fuel may be out for various reasons, not least a period of idle descent at the end. Drift may be out because of underestimated windage. Do you agree with those statements or feel that each are so rock solid that the combined results must be valid?
@Dr B. Your subsequent post already describes why you believe the drift model outcome is so insensitive to assumed wind factor. I find that counter-intuitive when it is quite clear that at 3%+ the wind vector would exceed the OSC vector (not a quarter of it). However, I can’t reasonably critique what I haven’t seen, so look forward to seeing the new-version drift model.
@All: Boeing has stated that the debris recently reported is likely not the trunnion door, and they cannot even confirm the part is from a B777. Meanwhile, the designer/builder of Vestas Wind has once again stated that the materials used in the panel construction appeared consistent with the materials and processes used in the build of the vessel.
This is what we expected to hear.
@Victor, in case it’s of any interest, I’m going sailing on one of those boats (Volvo 70) in July and can look/take photos of any deck area you/Don think it might have come from.
@Paul Smithson: Cool!
@Paul Smithson,
You said: “Your subsequent post already describes why you believe the drift model outcome is so insensitive to assumed wind factor. I find that counter-intuitive when it is quite clear that at 3%+ the wind vector would exceed the OSC vector (not a quarter of it).“
Your statements are inconsistent with Dr. Griffin’s assessment that the actual recovered MH370 debris would have windages between 0.8% and 2.0%. He has also said that the cumulative wind-induced drift from Arc 7 to near-Africa is only one-fourth of the cumulative current-induced motion, when using 1.2% windage, so in no case would the MH370 wind-induced drift exceed the current-induced drift when averaging those over an entire transit. I can’t verify or refute Dr. Griffin’s numbers. They seem reasonable to me, but I am not an expert if this area. I simply accept and use his estimates.
You also said: “My post said why I thought each of the “discriminator factors” is subject to doubt, beyond the uncertainty in the models themselves. BFO may be out because of retrace error, drift or major changes in ambient cabin temperature. Fuel may be out for various reasons, not least a period of idle descent at the end. Drift may be out because of underestimated windage. Do you agree with those statements or feel that each are so rock solid that the combined results must be valid?”
I don’t believe any UGIB result is 100% certain, except that its predictions are imperfect. In fact, one of the unique and, in my opinion, valuable features of the UGIB results is that all discriminators are expressed as a probability, using appropriate distribution functions for different errors.
What I have tried to do is pay at least as much attention to figuring the error in a calculation as in figuring the calculated value. Taking the uncertainties of various data sets and calibrations of BTO/BFO/ GDAS/ etc. into account, I estimated the probability of a particular flight scenario being consistent with what we think we know (i.e., the data sets).
What I do have a lot of confidence in is the UGIB conclusion that routes ending circa 39S are very unlikely. That is because very low probabilities occur in two discriminators (fuel and drift), and the SATCOM / GDAS probability is so-so. Therefore, you need 2 or 3 major shifts in the probabilities to achieve a modestly high overall probability. Correcting a significant potential error in any one of the discriminators can’t make 39S plausible.
@Paul Smithson
G’day Paul, regarding your July sailing opportunity, you may have already watched this video (https://youtu.be/Z94wnPQUirY).
If not, there’s a few seconds of footage starting at the 4:03 mark that’s interesting. Taken from inside the wrecked stern area of Vestas Wind, lo and behold, there’s shattered composite panelling (light/white on the finished side, black/dark on the other side, brownish honeycomb core).
And, per this screenshot (https://www.dropbox.com/s/8qdi9vp12xjqy99/Vestas%20Wind%20-%20interior%20wrecked%20stern%20area%20-%20YouTube%20screenshot.jpg?dl=0), in the upper right, there appears to be evidence of some panels being penetrated from the non-finished side through to the finished side – probably generated as all the various fittings and fixtures arrayed across the transom departed company with the boat during the grounding.
Have a poke around in that space if you get a chance.
Paul, Mick
Unfortunately, the VO70 design is quite different from the ‘Vestas Wind’ VO65 design.
The VO65 involved a single design with a low volume ‘production line’ delivering identical boats. Only eight complete vessels were built. Seven for the 2014-2015 race, noting the repair-rebuild of ‘Vestas Wind’, and an additional complete yacht for the 2017-2018 race. The racing fleet is now competing in the 2022-2023 Ocean Race.
The VO70 builders had the freedom to construct using whatever technique they deemed most effective while complying with the design.
@Don Thompson
Thanks Don, I hadn’t picked up on Paul’s reference to a VO70 boat as opposed to a VO65.
Don,you are quite right. One design VO65 were used in last edition and VO70 before that. So not a sister ship and not relevant to the question at hand.
@Paul Smithson: But still really cool.
@Ed Anderson
Looking back at your path calculations I have to challenge your speed calculations. Seems that your estimate for the speed between Arc2 and Arc3 [i.e. 19:41 to 20:41] was certainly less than 350 knots [I assume ground speed, since it is related to the distance you calculate.]
I agree with your estimate of the timing of the “tangent” point at about 19:51:xx, [I would prefer 19:52, but that makes very little difference] but if you accept that timing then the geometry is inconsistent with your distances, and hence speeds.
In fact, even if the “tangent” point was much earlier, at 19:41 for example, the minimum possible ground speed to allow the geometry to work would be about 392 knots.
I think this puts into doubt you whole lower altitude, lower speed hypothesis.
Hi Victor / Bobby
A quick request – I am playing around with an old flight path model – just for fun really, no particular strong objective in mind.
I’d like to improve the weather interpolation elements of it, and to that end have downloaded several Gb of GDAS data. Before getting to grips with trying to extract data from the GRIB format that the data comes in, I was wondering if you might have a nicely extracted and formatted version of the data from your efforts with the UGIB work that you could let me have?
I know you have used surface pressures and temperatures as well as temperature and wind speed and direction data aloft at a range of altitudes (pressures) and times, for a range of lat and lon allowing for a reasonably wide geographical area. Would be grateful for anything you have, csv or otherwise.
I understand that even a request like this can take up valuable time, so please note this is low priority and I am very happy to persist with the raw data if this is troublesome.
In the meantime many thanks for your continued efforts with this excellent blog, and the high quality technical input from your many contributors.
@M Pat
I looked in my notes for a download link to Bobby’s GDAS data “MH370 Weather Data – DrBobbyUlich – 2017.02.07” without any luck.
Here is a link to a copy of his file uploaded to my Google drive: https://tinyurl.com/4t58fk5p
I also have a reformatted version for the BICUBICINTERPOLATION macro that I can extract from my path model and upload if you want it.
Regards,
George
M Pat:
Here is a stash of MH370 GDAS and radiosonde data: http://bit.ly/3Z4ya8h
I recommend Bobby’s spreadsheet. It provides the means filter the huge data base for what you want. Be sure to read the Notes Tab first.
@M Pat,
Here is a link to the MH370 GDAS weather data in an EXCEL file:
https://drive.google.com/file/d/1oD-6HP7gq17NOyjkokOgi3n7wYUXjJOh/view
@Brian Anderson:
Hi Brian. It’s not clear what geometry you say my path is inconsistent with. My path is an exact match for BTO at each point on my path map and spreadsheet. The spreadsheet also contains lat/lon, times, and a derived plot of groundspeed along the path. Speed changes are minimal, and it’s easily flyable.
The CAPTION team proposed a path also optimized for BFO from IGOGU to my Cocos flyby acoustic event timing. I expect their flight speeds and geometry are similar to mine, and have said there are many possible paths that fit the acoustic timings (even more without matching waypoints). I take their report as an independent confirmation of the validity of a low and slow flight up to that point, even if they do not have MH370 take a turn NE at Cocos toward Christmas Isl. That covers the section your are putting into question.
Please reference against this page:
https://370location.org/2019/02/a-consistent-mh370-waypoint-path-to-a-specific-7th-arc-location/
And this spreadsheet (a hybrid .pdf that will open as a .odf file):
https://370location.org/wp-content/uploads/2019/03/mh370-waypoint-path-speeds-YPXM-LADIR-TOPAR-190301.pdf
I’ll quote a couple of key passages from my report:
“Rather than the tangent timing and heading determining the flight path, the speed of the plane is derived from the path and used to mark the location of the 2nd arc timing along that waypoint segment. The waypoint path is thus inherently consistent with the BTO timing, which effectively determines the flight speed for each segment.”
“Any loiter would increase the speed along this waypoint path up to the 3rd arc and move the 2nd arc intercept south along the BEDAX-ISBIX leg.”
Perhaps you could explain in more detail where you see a geometric inconsistency, and I’ll do my best to understand and address it.
@370Location: @Brian Anderson’s derived speed assumes the path is straight. Yours is not. Paths that satisfy the BTO conditions and curve to the east are slower than straight paths.
George / ALSM / DrB
Many thanks for the links, all safely downloaded, much appreciated!
@Jean-Luc Marchand – CAPTION
Thank you for the new analysis. I am in general agreement with the “One-way Journey Hypothesis”. Lots of good discussion in your paper about what *might* have happened before Arc2, food for thought, but which I do not totally agree with.
However, your Arc2 starting point is almost the same as mine. Your curved path is similar to my path but my path does not curve out as far west as yours. My path hits Arc7 too soon at constant speed, so I envision the active pilot started descending/slowing after Arc5. I feel MH370 hit Arc7 further east (30-32s) and may have still had spare fuel at Arc7.
From my perspective, my critique would be the CAPTION path is quasi straight path (quasi passive flight) except the pilot is alive and glides out at the end. Not exactly my vision of how a deliberate “One-Way Journey” may have been conducted.
@Ed and Victor
The question of geometry to which I refer relates ONLY to the path segment between 19:41 and 20:41. Yes, I assumed the path between these two arc crossings was straight [and the speed constant]. A curved path would require the speed to be even greater.
It was in 2014 that I had this “eureka” moment, when I found it possible to determine the distance between the Arc2 and Arc3 crossings without an elaborate path and speed analysis. Rather some basic spherical geometry, the time of the “tangent” point and the radii of the rings at those times were all that was necessary.
Very simply, the time of the “tangent” is derived in the traditional way by using Excel to calculate the polynomial which best fits the BTO data, then differentiating to determine the time of the minimum.
Then two right angled triangles are created with long sides equal to the radius [to the sub satellite position] for Arc2 and Arc3. Knowing the ratio of the times [from 19:41 to the tangent point, and from the tangent point to 20:41], it is straightforward to then calculate the base length of the two triangles. Hence the speed falls out.
There is, in my view, only one solution. And the solution is dependent ONLY on a few factors that have never been in dispute. Hence my reliance on this calculation as a fundamental test of the merits of any other, much more elaborate, path calculation.
A copy of my paper is available here . . http://www.duncansteel.com/archives/1330
@Brian I’ll go one better than that. Allow that wind variations across the first several hours are sufficiently small that speed can be approximated by constant groundspeed. Start anywhere (within reason) on Arc2 at 19:41. Using precise arc crossing times you will find that a constant GS great circle path can bit fitted with <1 BTO residuals for paths between 175 and 195 initial bearing, with the track angle solution being determined by where on Arc2 you begin. The groundspeed required to achieve this perfect fit (to Arc 5) varies between approx 499kts and 503kts.
@Brian Anderson: In Ed’s (@370Location’s) figure, the path is not straight between the 2nd and 3rd arcs. He shows a turn at ISBIX (near the equator) towards POSOD that allows him to reach the 3rd arc at slower speed, as the track is closer to radial from the sub-satellite point. If there were no turn, the distance to the 3rd arc would be further, and it would require a higher ground speed than he calculates.
@Victor,
Yes, I see the turn at ISBIX which lessens the distance to Arc3.
So now I wonder about the speed between the Arc2 crossing and the “tangent” point and ISBIX. It might be worth looking at the geometry around thse points too.
@Brian: As long as the BTO errors at the handshake times are within expected limits, I don’t see a problem with what he is doing.
On the other hand, I have other concerns about the likelihood of his path, which I’ve presented before.
Of course, the attractive thing about his analysis is the acoustic event is localized with great accuracy, so it would not take long to search his proposed impact point.
@Victor & 370Location:
Regardless of how long it might take to search Ed’s predicted location, doing so is a complete waste of time and money. It has two “fatal” flaws. First, the BFO errors are several times larger than what is acceptable. Second, it is totally incompatible with the MH370 debris reports.
@Paul Smithson @Victor @Brian
Re: Arc2 to Arc3 speed
Even though I agree the winds are relatively mild at Arc2, the curvature of the Arcs makes a significant difference due to the wind pushing to the west. This is probably an important portion of the flight path to study. I feel the Arcs are probably consistent with a MRC or CI52 speed (~475kts)(to conserve fuel), and that MH370 hit Arc2 relatively close to ISBIX, and that the path is slightly slanted to the West (suggesting wind impact/not-exactly straight south path). If active pilot I suppose some (eg heading) adjustment might have taken place during this period.
@Brian Anderson, @Victor Iannello:
Hi, Brian. I’ve looked at your paper again, and agree with Victor that the difference you are seeing is due to an assumption of a straight heading tangent to the satellite vs a turn away at ISBIX to POSOD which shortens the distance to the 3rd Arc.
I derived my own tangent fit in a 2018 report that references your paper:
https://370location.org/2018/10/examining-the-tangent-path-of-mh370/
I use a 2nd order polynomial and plot the difference with the 3rd order estimate. As you note, our tangent point timings are very close. Both appear to be a match for a flight path south between waypoints BEDAX and ISBIX.
Your geometry depends on the assumption of both a fixed heading great circle path tangent to the satellite, plus a constant speed for that segment.
My approach focuses on detected acoustic events that are still compatible with the tangent path between waypoints BEDAX-ISBIX.
I have a turn at Cocos Isl toward a Christmas Isl event and then the loud event near Java. By coincidence, the turn NE at Cocos happens to mirror the BTO and BFO for a straight path south.
Occam’s razor points to a simpler flight path south. I believe that tangent curve was the basis for an assumption of a straight southern path, and thus all of the previous 7th Arc search zones. However, we know for a fact that the beginning of the curve before the 19:41 2nd Arc is an illusion. The plane was traveling WNW, not a south tangent. Your paper selects a point after 18:40 on the tangent line as a starting point for your geometry, but it is an artificial one. That tangent happens to coincide closely with a southern path between waypoints BEDAX and ISBIX with a heading of 181.29 degrees. As the plane was piloted between waypoints up until it left radar, it seems likely that it was still being piloted between waypoints. If one were to assume a waypoint path up until the tangent point then continued south, a heading of 181.29 intersecting the 7th Arc might be considered a candidate.
Based on new evidence for three acoustic detections, I believe the shortest path to Cocos Island via waypoint POSOD makes good sense, with a turn there towards Christmas Island, and then on to the louder pinpointed anomaly right on the 7th Arc near Java. That would mean that the points after ISBIX are coincidentally on the 2nd order BFO curve, just like the early ones. That leaves not enough points to actually fit a predictive tangent curve, so I simply followed the waypoint paths.
@DrB:
I gave a detailed critique showing problems with the UGIB paper as it applies to my Java candidate site. Your reply simply dismissing my search candidate as a waste of time and money is the only rebuttal I’ve seen.
If you are basing your exclusion of my site on the content of the UGIB paper, then I’ve already shown the flaws in that conclusion. If you are basing it on your unpublished analysis, then it’s rather unscientific to entirely dismiss someone else’s work without addressing the flaws shown in your own and giving the new basis for your conclusion. I have to take it as just doubling down on your personal opinion.
Ultimately, it will be up to the search team to review the new evidence and decide if it’s worth checking the viable candidate site. With seismic calibration by dropping a multi-ton mass nearby, the accuracy could be improved to within the expected area of the debris field. That opens up the possibility of any small team capable of 3,400m depth checking the site in a single descent.
Even without a contract commitment from Malaysia, the site could be checked inexpensively as a test run of new equipment, en route between other surveys. It would be a good hedge against spending many months and hundreds of millions unreimbursed searching a very large area if MH370 actually crashed near Java.
@370Location:
You said: “If you are basing your exclusion of my site on the content of the UGIB paper, then I’ve already shown the flaws in that conclusion.”
My comments about the BFO residuals in your path being unacceptably large are based primarily on the DSTG analysis of BFO residuals. Your proposed flight path is far beyond the realm of being a realistic possibility according to DSTG’s statistical analyses.
The second major flaw in your proposed end point is its inconsistency with the finding locations and dates of MH370 debris. This is demonstrated by all published drift studies, including CSIRO’s reports.
You are correct that my analyses, published and unpublished, also indicate that your proposed end point is extremely low in probability, to say the least, but this conclusion is unchanged whether or not one considers my work. The DSTG and the CSIRO amply demonstrated these points six years ago. If you want to insist they are both wrong, then please demonstrate the technical flaws in their analyses and reports. Don’t expect anyone to grant credibility to your proposed route and predicted end point unless and until you can do that.
@Victor Iannello
@DrB
@370Location
I most assuredly do not have a horse in this race but has drift analysis ever been used to successfully localise an oceanic crash/wreck site before?
@DrB:
You have set a huge hurdle for me to overcome, and I think it’s the wrong mindset. You are asking me to prove prior studies are flawed before my research can be accepted. That does seem to be your approach here in attempting to dismiss a candidate that does not agree with your own expectations. It’s the typical strategy on MH370 social media, where a proponent asserts that all other evidence and candidates must be excluded leaving only their own theories to fill the void.
I’ve read all the same MH370 drift reports that I can get hold of. I don’t recall any others adopting the strategy of trying to derive the origin latitude by creating a narrow time window around the discovery date and excluding early arrivals. Mostly I see probability density maps where modeled particles end up or pass near a debris find, regardless of when it was later found. As I pointed out above, it doesn’t make sense to narrow the exclusion window if the second item found traveled farther than some 30 other pieces that were found up to years later.
CSIRO was specifically tasked with checking to see if drift modeling for found debris was plausible for the areas being actively searched. My recollection was that they concluded those areas were as good a match as any, and that like the INMARSAT BTO/BFO analysis, it should not be extrapolated beyond the purpose of their study. Drift models vary widely depending on windage, Stokes, drag, etc. It is not surprising that those factors would be chosen with the base assumption of a straight heading toward the 7th Arc search areas getting the most debris. More northern latitudes weren’t even included in most drift studies. The first GEOMAR flaperon reverse drift study without 7th Arc limits had the highest origin probability on the 7th Arc centered right on the Java site. CSIRO did model drift from a segment near Java. More of the particle split north at Madagascar than other models, but that is easily within the range of uncertainty. I have no need to prove CSIRO studies wrong. It was excellent work.
DSTG also was optimizing for a straight line path using the BTO as the best available reference, with BFO as more uncertain. If that’s all one has to work with, it makes sense to set an error bounds to minimize the possibilities. The Java candidate site is based on new acoustic analysis for three key events. I proposed one flyable waypoint path that links the events with exact BTO matches and minimal speed changes. There are many other possibilities. I wasn’t optimizing for BFO at all because of the uncertainty. Checking the BFO after, the values are not much worse than some straight paths. I already mentioned that CAPTION did optimize for BFO to my Cocos flyby timing, and found a different path with better BFO values. This has nothing to do with your requirement that I prove some flaw in the DSTG approach. I have no issues with their approach or results. They simply didn’t consider a possible path with waypoint turns based on new evidence that wasn’t realized until long after their work.
It would be a shame to eliminate the very specific Java candidate site based on a narrow expectation for uncertain parameters.
@Mick Gilbert:
There was some discussion last year over drift methods used to track lost vessels. It was in the context of barnacle evidence, and the study refuted the bogus log growth curve that was used to place the flaperon at Reunion exactly when it was discovered:
https://twitter.com/370Location/status/1585206561835999232
https://www.labmanager.com/news/how-barnacles-could-help-find-missing-persons-lost-at-sea-25250
https://doi.org/10.1007/s00227-021-03822-1
Liberate full source from DOI links via Sci-Hub:
https://sci-hub.se/10.1007/s00227-021-03822-1
There were some followup comments here about how barnacles couldn’t be useful in determining an approximate crash latitude. I believe that the barnacle growth range does indicate a crash site in tropical waters, and it’s also tied to the drift modeling.
@370Location
Thanks for that, Ed. I remember that discussion.
@370Location:
You said: “Drift models vary widely depending on windage, Stokes, drag, etc. It is not surprising that those factors would be chosen with the base assumption of a straight heading toward the 7th Arc search areas getting the most debris. More northern latitudes weren’t even included in most drift studies.”
In this statement you are mistaken on two counts.
1. The drift models begin with an assumption that the debris origin (the POI) is in the vicinity of Arc 7. There is NO ASSUMPTION in any of the models about HOW the aircraft arrived there. Certainly, there is no assumption about whether the route was a “straight heading”, as you suppose was a “base assumption” which somehow affected the chosen drift parameters.
2. The most extensive and the best documented drift study was done by David Griffin and his colleagues at CSIRO. They assumed a uniform areal density of trial origins near Arc 7 between 8S and 44S latitude, so they covered the northern end of Arc 7 and also included the location of your proposed POI. Regarding the drift parameters, for the flaperon CSIRO conducted sea trials of a cut-down surrogate flaperon to determine the drift speed and angle. There is no “assumption” by CSIRO of drift parameters chosen to prefer a certain POI latitude or route, as you infer. (However, Trinanes did do that, which creates a circular argument, so that work is not useful today.) Using the experimentally measured drift parameters for the flaperon, out of 27,561 model drifter trials with origin latitudes between 8S and 23S, only a miniscule 3 CSIRO trials were predicted to arrive within a radius of 30 NM of Reunion and within 100 days of the known arriving date. None of those three trials originated north of 17S. So, the probability of the flaperon originating circa 8S is EXTREMELY LOW, to say the least, since zero CSIRO trials are consistent with the flaperon finding location and arriving date. This is contrary to your assertion that somehow the CSIRO predictions are consistent with a POI circa 8S. They are not. Considering sixteen additional MH370 debris finding locations for non-flaperon debris, eleven of these had zero trials predicted by CSIRO to be consistent with debris reports, four sites had between 1-4 consistent trials, and only one site had more than four trials from 8S. So, the non-flaperon debris sites also overwhelmingly reject 8S as the origin of MH370 debris.
There have been at least three independent debris drift studies (by CSIRO, Pattiaratchi, and Rydberg), using different ocean models, which predict the MH370 POI was in the vicinity of 32-36S. Your proposed location circa 8S is very strongly rejected by their quantitative results. That’s why I said that if you want anyone to seriously consider your proposed POI you will have to show why ALL those drift studies were VERY WRONG.
You also said: “CSIRO was specifically tasked with checking to see if drift modeling for found debris was plausible for the areas being actively searched.”
The bottom searches were planned based, in part, on the CSIRO drift predictions, and nothing done in the CSIRO drift modeling depended on any portion of Arc 7 from 8-44S. That entire range was analyzed by CSIRO without location or route bias. The fact that their debris drift analysis indicated the same general region along Arc 7 as DSTG’s SATCOM analysis is confirmation, by two independent studies using different data and different methods, that this region is consistent with all known MH370 data. Your proposed route/location fails this test.
Another fatal flaw in your proposed location is BFORs. You said: “DSTG also was optimizing for a straight line path using the BTO as the best available reference, with BFO as more uncertain. If that’s all one has to work with, it makes sense to set an error bounds to minimize the possibilities. The Java candidate site is based on new acoustic analysis for three key events. I proposed one flyable waypoint path that links the events with exact BTO matches and minimal speed changes. There are many other possibilities. I wasn’t optimizing for BFO at all because of the uncertainty. Checking the BFO after, the values are not much worse than some straight paths.”
The flaw in your location is not because of the straightness or the curvature of the route, nor because it agrees or disagrees with DSTG or UGIB. It is because the BFORs are much too large in magnitude (ranging from -17 Hz to +19 Hz), and these are well outside the range of uncertainty.
Both Inmarsat and DSTG studied the BFORs when the route parameters affecting BFO are known to be correct. They found a much smaller dispersion, by 2-3X, than what you showed for your proposed route. Sorry, but you can’t sweep that under the rug, because the uncertainties in the BFOs are quite well known. That is, the uncertainties in the BFOs are rather certain, and your BFORs exceed the known uncertainties by a large factor which renders your proposed route highly improbable.
You also said: “It would be a shame to eliminate the very specific Java candidate site based on a narrow expectation for uncertain parameters.”
In the statistical sense, the expectations for BFORs are neither “narrow” nor “uncertain”. They are well understood by most route modelers, but your range from -17 Hz to +19 Hz is highly implausible.
There are four data sets which can be used to assess proposed MH370 routes: BTOs, GDAS, BFOs, and debris reports. I did not see where you utilized GDAS. You have proposed a route with zero BTORs, which is inconsistent with the BTO noise. Your BFORs are much too large. Finally, your proposed POI is inconsistent with the best drift models and by a huge factor. So, what I see is inconsistency in all cases with all the fundamental “knowns” which may be used to assess potential MH370 routes. That’s why it would be a waste of time and money to search there.
@370Location: I make these comments at the risk that you feel we are unfairly criticizing your work. I do appreciate your approach to analyzing the acoustic data to arrive at an event that falls on the arc. Also, as the moderator, I don’t expect 100% consensus from contributors, as I think scientific debate challenging assumptions and methods is healthy.
Regarding drift results, your POI would require that items were recovered after a significant delay in beaching. For articles like the flaperon that were recovered with live barnacles, I think this is unlikely, although not impossible. After all, we do have evidence that sometimes articles ARE recovered months after they beached. One example is “Roy” from South Africa, recovered the second time without barnacles. The other is the debris from Vestas Wind.
Regarding BFO and BTO errors, you can always find a path with maneuvers (changes in speed, altitude, or track) that can match whatever statistical criteria that is required, so I don’t put a lot of weight on only the BTO and BFO errors for paths with pilot inputs. However, I do highly discount paths that require these maneuvers because I find it highly unlikely that automated straight and level paths between 19:41Z and 00:11Z would follow the BTO and BFO sequence of a true path with multiple maneuvers.
Regarding the DSTG analysis, nowhere did they assume the path was straight, as many people have stated. In fact, they started their paths at 18:02, and maneuvers are required to reach 38S on the 7th arc. Rather, they assumed a probability distribution in which a path with a higher number of maneuvers is less likely. That seems reasonable. What they did not include was an accurate fuel model or drift model.
So, I would say your POI is unlikely, but not impossible. If there was a way to search it without incurring much additional cost, I would be open to it. Of course, it’s not my decision.
@DrB, VictorI:
Let’s step back from the minutiae for a moment.
My focus all these years has been on refining the accuracy of the acoustic analysis. I set out looking for what CTBTO and others expected might be a detectable surface impact or underwater implosion. I spent a lot of time and effort evolving the ability to detect very weak acoustic events buried in noise and clutter that experts said was impossible.
Most of that time I was examining events where others expected them, mainly based on a fundamental assumption of a straight path roughly south to oblivion. A straight path is the simplest solution, but it may have been the equivalent of looking for a lost watch only under a streetlamp because the light is better. Of course researchers didn’t state they were analyzing for only a straight path. It’s simply the underlying assumption for a maximum range high altitude cruise to reach the areas that have already been extensively searched.
There were multiple weak acoustic candidates in that area, the best one being a complex noise and echo at Gulden Draak. That area was later searched by Ocean Infinity. I trust that they know their business and didn’t miss an MH370 debris field there.
Only by pursuing other methods (with several failures and wasted months) did I find that public data from seismometers would be useful. When I checked a very loud Diego Garcia hydrophone event coming from the direction of Java, it was obvious on local seismometers. Using multiple methods to determine the epicenter, the most accurate puts it exactly on the 7th Arc BTO ping within the limits of both satellite and seismic propagation data. I’ve since determined that the sound is consistent not with an implosion, but a sinking section of MH370 hitting the seabed.
The odds of that event detection by two independent methods being a mere coincidence with MH370 are incalculable, at least for me. Noise events of that intensity near the Java trench are not that common. We have seismic records, and my recollection is that no quake happened within 20 km of anywhere along the 7th arc in decades. I invite statisticians to calculate the odds of a match within epicenter accuracy of the 7th Arc and the timing 55 minutes after the last ping.
When I reported the finding, others could not accept it because they could not imagine what might cause an underwater implosion, or that it didn’t match their expectations of what a pilot flying a fully functional plane would do, or that it didn’t match fuel endurance.
I continued to investigate with seismometers, and found another acoustic event at Cocos Island matching the timing of a flyby, then another at Christmas Island. Connecting those three dots, I showed an example flight path that is easily flyable by even a damaged plane, with an exact match for BTO and fuel endurance. I didn’t optimize it for BFO because it didn’t seem necessary, and now that is being called a fatal flaw to dismiss the acoustic evidence entirely.
I’ve pointed out that CAPTION tried and found a path to Cocos optimized for BFO with minimal residuals which should close the matter. Instead I am told that I must somehow disprove past BFO analysis for the acoustic candidate to be deemed credible. That’s unscientific nonsense.
I was told that the Java candidate was incompatible with drift analysis. Rather than taking months to run my own drift analysis, I solicited help from experts. Oleksandr Nesterov stepped up and ran my candidate site through his excellent drift model simulation. Even though he too has privately shared criticism of my candidate site, his result is an impressively good match to all the locations where MH370 debris has been found, and little where it hasn’t:
https://370location.org/2019/02/a-consistent-mh370-waypoint-path-to-a-specific-7th-arc-location#aug2020update
Here is a CSIRO historical plot of actual undrogued drifters tracked for 500 days after passing within 7 degrees of the Java candidate site:
http://www.marine.csiro.au/~griffin/MH370/drifters/MH370_16-2S_undrog_drifters_500d_allyear.html
That plot is very consistent with the CSIRO modeling, but even without a model this shows that debris arrivals from a Java crash site are perfectly plausible.
It doesn’t matter that reverse drift of actual drifters shows a higher probability along the 7th Arc somewhere around 30S:
http://www.marine.csiro.au/~griffin/MH370/drifters/Reunion2_undrog_drifters_-500d_allyear.html
Drift analysis may give a higher probability that debris came from latitudes farther south. It makes sense to look there, and OI did that thorough search. But what if the plane wasn’t found because it didn’t crash there. If it crashed at the Java candidate site, debris still goes to where it was found. As debris discoveries continuing years later show, the expected time of debris arrival in an area does not have a tight connection to when it beached or was found.
If all you have is statistics and probabilities to determine where to search the seabed because you can’t triangulate, it’s perfectly fine to narrow the tolerances. When you have robust new evidence for a crash site epicenter with relatively high precision, it really makes no sense to discard or ignore the evidence because it doesn’t fit prior assumptions, conclusions, or expectations. What makes sense is to see whether the new evidence is consistent with known facts, and maybe loosen the tolerances that were set using prior methods.
I’ve done my best to follow best scientific methods, which to me means checking and rechecking with other experimental methods to be sure that my own inherent biases aren’t causing me to draw false conclusions. I’m open to criticism that might help me see something I’m missing, and feedback on this forum has been a great help in evolving the supporting evidence for my candidate site.
I’ve been supportive of other candidate sites, pointing out flaws when I see them and running acoustic analysis when it might be useful. If anyone wants to assist by running my candidate through their models to find a better path, check drift, or examine barnacle growth, that would be much appreciated.
Let’s not inadvertently “throw the baby out with the bathwater”.
@Victor Iannello
Victor, speaking of the DSTG’s assumption that a path with a higher number of maneuvers is less likely, that surely leads us to one of big issues with UGIB – the frankly fanciful set and sequencing of manoeuvres between 18:22 UTC – 19:41 UTC.
If you count commanded changes to speed and altitude along with changes to heading as “manoeuvres”, by my count there are 13 manoeuvres in 80 minutes. All of that left-right, down-up, slow-fast manages to deliver the aircraft to the second arc such that “The best-fit 19:41-00:11 route start position is matched perfectly“.
That’s got to rate at least 5 Raised Eyebrows on the Closed-Ended Spock Scale.
@Mick Gilbert says:
“That’s got to rate at least 5 Raised Eyebrows on the Closed-Ended Spock Scale”
Love it Mick -still chuckling hours later !
@Victor Iannello
Re the “18:02” remark re DSTG analysis start point above.
Request clarify. Was that a typo ?
I had assumed that the DSTG / ATSB both accepted the Malaysian supplied ten second military radar data to 18:22 as the “gold standard”.
Correct – or not ?
@Mick Gilbert: We don’t know what occurred between 18:22 and 19:41. We proposed one possibility, but the end point does not really depend on that. It might have been another, simpler set of turns. That said, I think the need to introduce a delay element of any kind in the path is a weakness.
Of course the set of maneuvers puts the plane exactly where it needs to be at 19:41. Just like the plane crossed the seventh arc exactly at 00:19. There is nothing amazing about either.
@ventus45: I find it unlikely that you have not read the DSTG report. If you have not, you should.
@Mick Gilbert,
You said: “Victor, speaking of the DSTG’s assumption that a path with a higher number of maneuvers is less likely, that surely leads us to one of big issues with UGIB – the frankly fanciful set and sequencing of manoeuvres between 18:22 UTC – 19:41 UTC.”
Let me address how those maneuvers were determined. It is not nearly as complicated, arbitrary, and fanciful as it may appear to be.
It is virtually certain, in my opinion, that an “unusual route” was followed by MH370 between 18:22 and 19:41. There are several indicators of this occurring. First, a single FMT cannot be consistent with both the SATCOM data and with MEFE at 00:17:30, assuming no descent to a low altitude. That’s because the new bearing consistent with the SATCOM data can either satisfy the 18:40 BFOs with the turn beforehand or it can have MEFE at 00:17:30, but it can’t have both. Believe me, I have exhaustively searched for this type of solution, as have many others. I am convinced it does not exist.
Even a “2-turn FMT” is inconsistent without introducing a time-delay and fuel-saving maneuver. This time delay needs to be a fuel saver, otherwise MEFE occurs too soon. So, what UGIB found is that some maneuvers occurred between 18:22 and 19:41 that loitered AND saved fuel. This conclusion is inescapable when one uses a single autopiloted flight mode from 19:41 to 00:19. While we can’t be 100% certain this occurred, there are several reasons why this is highly likely. The fit to the SATCOM data during that portion of the flight is excellent. It’s also the same method the pilot would ordinarily use to control the route. In my view, this autopiloted route is much more likely than manual flying to some changing heading, with numerous speed changes, all hypothesized to match the SATCOM data for tracks to the southeast.
There are two basic methods to achieve this time-delay, fuel-saving set of maneuvers. One is to fly a holding pattern at a reduced speed. That burns less fuel and has the aircraft flying a racetrack for one or two circuits. I can’t image a reasonable motivation for the pilot to do that near the tip of Indonesia, especially at an altitude where the aircraft was potentially detectable by Indonesian radars. Perhaps you can suggest one.
The second method is to descend to a low altitude and slow down. The route after descent could also follow FIR boundaries (as was approximately done during after the IGARI turnback when overflying Malaysia/Thailand). That would perhaps delay an identification of the aircraft should it be detected. So, this descent and following FIR boundaries accomplishes the following:
1. It satisfies the 18:40 BFOs by a descent approaching IGOGU with a left turn there toward the SIO.
2. The descent puts the aircraft below the radar horizon for Malaysian and Indonesian radars and underneath airways being crossed.
3. The left turn departs the N571 airway after radar contact would have been lost, so it was not detectable. This obscured the destination of the SIO, to the best of the pilot’s knowledge.
4. It provides the necessary time delay to reach the best-fit 19:41 position at the correct time, speed, and high altitude. (I note here that this route does not have enough degrees of freedom to ALWAYS satisfy those constraints simultaneously. A more complicated route with another turn is required to do that. Thus, the fact that it does satisfy all constraints with one fewer degrees of freedom is an indication that there is something “special” about this particular route, although it is unlikely to be unique.)
5. It provides the necessary fuel savings to be consistent with MEFE at 00:17:30, but only when the bleed air is off after 19:41 as well.
6. It avoids populations at Sumatra and at Nicobar, so visual sightings would be unlikely.
Now let me address the actual maneuvers. Starting at 18:22, the sequence is as follows:
1. “FLCH” descent to HOLD speed at FL100.
2. During descent, “DIRECT TO” IGOGU.
3. Enter a waypoint at 6 °N and 94.4165 °E (this is on the 6 °N FIR boundary at the same longitude as IGOGU/ANOKO/NOPEK). This takes the aircraft from IGOGU through ANOKO and NOPEK, where Kate Tee sees a low-flying large aircraft.
4. Enter a waypoint at 6 °N and 93.7875 °E (turn west to follow the FIR boundary at 6 °N to the same longitude as BEDAX).
5. Enter BEDAX/South Pole or simply South Pole.
6. ECON climb to LRC at FL390.
All you need to remember to fly this route is that you go to IGOGU, turn south to the FIR boundary at 6 °N, turn west until you get to the BEDAX longitude, and then turn south to the South Pole. It’s not that complicated for someone who had probably thought about doing this for a long time. It avoids the radars and the populated coastlines and islands. So, except for an Inmarsat engineer deciding to save BTOs and BFOs, no one would know for sure that the aircraft flew to the SIO until debris began washing up two years later. The plan was ingenious and very well executed. Minor imperfections occurred because (1) the PF did not know of the hourly handshakes by the SDU, (2) the PF did not know the BTOs and BFOs were saved by Inmarsat, (3) there was an “unlucky” flyover of a yacht with an eyewitness after the turn south, and (4) ZS did not know the PC flight simulator saved some simulation data on the hard drive in the background even when a file was not saved. Despite these minor flaws, the aircraft still has not been located after nine years. So, maybe ZS really was the smartest guy in the room.
Just for the record, unless we witnessed a “ghost” flight, I do not feel it is logical to expect minimal numbers of maneuvers. I further feel that, in all likelihood, we probably witnessed a deliberate flight to the end, and I doubt the end was near Arc7.
@TBill: It’s possible that between 19:41 and 00:11, a path with multiple pilot inputs exactly mimicked a level, automated flight using LNAV navigation along a leg defined by two waypoints. I don’t think that is likely. The greater the deviation from that automated flight path, the less likely.
There is a big distinction between that part of the flight and the part between 18:28 and 19:41, where we are quite confident there was a significant change in direction (northwesterly to southerly), so there had to be at least one maneuver. UGIB offers a way to connect the position at 18:28 with the estimated position at 19:41 so that the entire path meets all the criteria, i.e., fuel, satellite data, statistics, debris drift. We can also speculate as to why that particular path around Sumatra was selected by the pilot, but the path does not depend on that speculation.
For the portion between 19:41 and 00:11, it’s a bit like fitting a curve to 5 experimental data points that fall very close along a line. You could choose to fit the curve with a 10th order polynomial, but that is not likely to accurately describe the underlying physics of the data points, unless you have specific knowledge that the underlying physics are not linear, in which case you just happen to have data points that align. That is unlikely to occur.
@Victor:
You said: “That said, I think the need to introduce a delay element of any kind in the path is a weakness.”
Maybe so. However that depends on the strategy at that point in the flight. If speed were the prevailing desire at that point in the route, then I would agree. High speed occurred in the path from Penang to 18:22. ZS knew he was being tracked then on radar, particularly on military radar that was being continuously monitored. Despite that, he was able to fly to the NW until he exceeded the range of the military radars without an interception being attempted. Thus, he left a plain radar trail, but a false one.
I can argue that, after 18:29, speed was no longer the prevailing strategy, and that it was replaced with stealth. In order to disappear the aircraft, his turn south needed to be undetected. Flying at a low altitude (and consequently at a lower speed) aided that stealthy change in route by avoiding Indonesian radars.
Once he was out of Indonesian radar range and had passed under several airways, it was safe to climb again and run south until fuel exhaustion. Selecting LRC at FL390 enabled him to achieve that long range.
So, a notional sequence of strategies might be like this:
17:20 – 17:40 Surprise (go dark, make quick turnaround)
17:40 – 18:29 Speed (fly at a very high GS until out of Malaysian/Thai radar range)
18:29 – 19:41 Stealth (turn and fly low, with one zig-zag, until past Sumatra)
19:41 – 00:17 Range (cruise at LRC at FL390 until MEFE)
Stealthiness would be enhanced from 18:29 to 19:41 by descending, not by continuing to fly at cruising altitudes. In this scenario, slowing down in that time period in order to fly undetected at a low altitude is not a weakness, but a strength.
@DrB: You don’t have to convince me that we came up with a plausible motive for each maneuver. It’s just more complicated than I would have preferred. Unfortunately, simpler paths have their own problems, so we landed where we did.
Back in August 2014, I proposed a due south path from BEDAX that fit the satellite data well that ended near our LEP. I noted at that time that it required a delay element between 18:28 and 19:41, where I even considered a landing at Banda Aceh to explain the delay, which in retrospect, is absurd. Of course, we know a lot more today than we did at that time, and I was struggling to reconcile the facts in hand. Later, I considered a holding pattern as the delay element. The need for this delay element for the due south path has always bothered me. That said, I know of no more feasible path than UGIB.
@Victor Iannello
Re: Of course the set of maneuvers puts the plane exactly where it needs to be at 19:41.
… with just the right amount of fuel! That’s the point of contention.
UGIB relies on fuel consumption/exhaustion as a key discriminator. It then presents us with a set and sequencing of manoeuvres between 18:22 UTC – 19:41 UTC that just happens to deliver the aircraft to where it needs to be with just the right amount of fuel. That’s what makes all the manoeuvring look like a contrivance.
@DrB
Bobby, I’m sure that internally UGIB has rationalised all of those manoeuvres. I have to say, though, that that part all looks decidedly more G than B.
Frankly, the rationale for the tip-toeing along FIR boundaries sits somewhere between fanciful and entirely counter-productive. No agency would just ignore an unidentified flight because it is flying along a FIR boundary. If anything that would draw the attention of not just one, but both respective agencies, largely because it is highly unusual. Commercial flights don’t routinely fly along FIR boundaries. Intelligence-gathering military assets sometimes do though.
And the notion that 18:22 UTC – 19:41 UTC was part of some exercise in stealth is roundly undermined by the fact that the selected route brings the aircraft past the Indonesian military radar station on Sabang close enough to be spotted by eye, leave alone radar.
Separately, I will take the silence in response to my earlier question, “… has drift analysis ever been used to successfully localise an oceanic crash/wreck site before?“, as a “No.” I believe that there is way too much faith being placed in drift analysis to provide fine discrimination with regard to a point of origin for debris items.
Any old how, you asked for concerns about UGIB. A few have been advanced by different contributors. Over to you, Blue Leader.
For the avoidance of any doubt, with regards to whether the UGIB search area should be included in any renewed search effort, I say, yes it should. There is clearly something “special” about the due south from BEDAX route.
That said, I am not an advocate of the “X marks the spot” approach to defining a search area. I don’t know how many times that approach needs to be come up empty handed for people to take the hint.
@Mick Gilbert: Other paths between 18:28 and 19:41 were rejected if fuel constraints were not satisfied for the complete path. I don’t view the path between 18:28 and 19:41 as an absolute. It is the one found that also seems to have some rationale. Others are possible. Only one of those needs to exist to render the UGIB endpoint possible.
I think an impact near the UGIB is the highest probability area. That said, I have no idea what the probability is. It would be foolish to plan to search ONLY that area. I don’t think anybody has said that.
@Victor Iannello
UGIB is, at its core, built around actual science. So it has that going for it. You fellows obviously put a lot of time and effort into it; to use one of my colloquialisms, you’ve given it a red hot go.
I’d be astonished if OI didn’t search, as a bare minimum, the unscanned high priority area that you’ve identified as part of their broader search campaign.
I’ve just finished watching the NOK presentation marking the 9th anniversary of the disappearance. For all their sakes I hope that they can get some answers before the 10th anniversary roles around.
@Mick Gilbert,
You said: “And the notion that 18:22 UTC – 19:41 UTC was part of some exercise in stealth is roundly undermined by the fact that the selected route brings the aircraft past the Indonesian military radar station on Sabang close enough to be spotted by eye, leave alone radar.”
I don’t think 9M-MRO could have been spotted visually as it passed west of Sumatra. It was dark, not long after midnight. There was no moon. There were probably no exterior lights of any kind illuminated. The cabin interior lights probably would have been on, and many/most window shades were open, allowing the aircraft to be seen within a few miles. However, Sabang is 56 NM from the closest point in the UGIB route. The elevation angle was only 1.7 degrees above the horizon. I seriously doubt that a person could see the aircraft as even a faint dot and even if they knew exactly where to look. Certainly, it could not have attracted any attention whatsoever.
@Mick Gilbert,
We don’t know if ZS knew the Sabang radar was shut down after midnight. In my opinion, he probably did know that, just like he appears to have known the maximum range of the Butterworth radar. His departure from N571 occurred just past that point. Considering the well-planned and well-executed nature of his diversion, I would be surprised if he would take the chance of being spotted by a radar in Sumatra. The radar horizon is only about 25 NM from Sabang, but if 9M-MRO were at FL50 or FL100, it could have been tracked out to at least 100 NM. So, either ZS was lucky that the Sabang radar shut down at midnight, or he knew that was the case. I suspect the latter.
@Victor
I have also been a “fan” of 180S for a long time (of course you were one of the first to see that). I agree with some probable “flying around” Indonesian FIR on the way to ISBIX and 19:41. The sim data seems to suggest a somewhat similar idea.
Unfortunately the shape Arc2 at 19:41 presents “multiple answers” for a 180S path. The Arc2 curve makes it hard to see where a tangent 180S path actually hit Arc2. Perhaps this is mathematical proof of a 180S path? Not sure.
In any case, the UGIB case explores a case with a little more delay/loiter than necessary, hitting Arc2 at about 3N. The increased loiter and more northerly hitting of Arc2 is necessary to allow a LNAV path hitting Arc7 at the correct time, assuming no maneuvers.
In contrast, I believe the Isat data more naturally supports a different case with less loiter (maybe 7-10 minutes less), hitting Arc2 closer to ISBIX, with a “curved” path (not LNAV) to Arc5. In this case, Arc6 is hit too soon unless there was a slow down, which I feel was probably the case.
We have systematically ruled out curved paths because they hit Arc7 too soon at constant speed, and also because may have fuel left at Arc7. But that is exactly what I think happened. Except MH370 did not really hit Arc6/7 too soon, it just slowed down/descended on the way there (after Arc5).
Recently the revised CAPTION path hits Arc2 closer to where I also believe, and CAPTION notes that their new path is similar Inmarsat’s, which brings to my attention that the original Inmarsat indicative path also hit Arc2 closer to my thinking. Both of these paths are somewhat (but not exactly) similar to the “slightly curved” path shape I see as more natural data fit in the Arc2-3 region.
@TBill: The UGIB path was based on a match using some advanced statistical tests of expected errors for independent stochastic processes. It was not based on personal feelings or judgments about a “natural” fit to the data.
@DrB, @Mick Gilbert: One thing I’ve learned over the years is it is nearly impossible to defend or refute a particular path based on what we believe were the intensions of the pilot flying. We don’t know for sure their intentions, and even if we did, we don’t know their knowledge base and how they used that knowledge base to select a path. At best, we can speculate. That’s why I am reluctant to defend the particular path UGIB selected between 18:28 and 19:41, but I also recognize that it is not necessary to have been exactly right for this part of the path for the LEP to be correct (or at least, nearly so).
Based on all public evidence disclosed people have speculate a well intentioned flight, we then ask ourselves the motive of the pilots, did they play the hero or the villain, was he trying to save hundreds of lives, or was he paranoid about his personal life and wanted to become a mass murder, is he a perpetrator or a victim, next we ask the where question based on available data the plane definitely ended in the Indian Ocean, on the basis of probability we are trying to pinpoint a more accurate position, there are so many candidate spots with very little evidence to support it, lastly we are debating the end of scenario which could help shift the search area, if the plane crashes with no one in control it would be right to assume the 7th arc contains the wreckage, if there is an active pilot then that means we must search beyond it, the main question is what type of incident it was was it a hypoxia event or a suicide act, I’m not dismissing either one but I would draw the line between speculating vs accusing the pilot of a criminal act.
I do however support your candidate site based on all the effort and work you as group did, your POI is based on the most probable flight path, based on the assumption the debris field was missed, and you cite past examples such as the ARN San Juan, plus the area was only half searched due to high terrains and it may not have detected it.
@DrB
Bobby, the radar head at Sabang (TNI-AU Satrad 233) is perched atop a 470-odd metre high hill at the north-west end of the island. The radar horizon from that vantage point is a shade over 42 nm (48.6 miles). At the point of nearest approach on your proposed path, where you have the aircraft executing a 90° turn to the west, the aircraft would have needed to have been on the deck (below 50 feet ASL), to have ensured that it wasn’t detected by radar.
@Mick Gilbert: The Indonesian military radar on Sumatra was not operating that night. I have spoken to the US investigator that reviewed those recordings. So the question becomes whether the pilot flying was aware of this. We are back to trying to get into the mind of somebody.
@Victor
Mick is probably checking, but:-
(1) as I recall, the Indonesians specifically said that the Sabang Radar (Satrad 233) was operational and “strong”, and that it did not see MH370 either (a) in it’s airspace, or (b) where the Malaysians said it was.
(2) your assertion that Sabang Radar was not operational is news to me. When did that become known ? Is there a prior reference that I have missed ?
I also agree with Mick re the Radar Horizon, it would be impossible to not be seen unless you were on the deck, on a moonless night, flying on the radar altimeter, a very risky strategy.
https://drive.google.com/file/d/1QZVG9gMKIyYrQrdLUVkf3IMn0yN_e3HN/view?usp=share_link
@Victor
UGIB approach I believe effectively mandates all Arcs2-7 must be fit as a passive flight. In my view that is probably over-specifying the solution.
@Mick Gilbert,
We agree that if the military radar at Sabang were operating after midnight, it would have detected 9M-MRO along the path UGIB suggested. However, it was not operating, and it did not detect MH370. The only remaining question is, did ZS know this?
Even if the Sabang radar did track a portion of the UGIB “FMT Route”, it would have showed the turn to the west. The final turn to the south occurred at almost 100 NM range. That would have very difficult or impossible for the Sabang radar to discern if 9M-MRO were at FL50-FL100. So, a recorded track from the Sabang radar might have only created a second “false trail”, this time to the west.
The plane would not have been noticed visually from Nicobar or from Sumatra. So, if ZS knew that the Sabang radar shut down at midnight, he would have been sure that route would not be detected by any means, except possibly visually by someone on a ship near the route.
Perhaps ZS thought that if he were unexpectedly detected by a radar while flying along a FIR boundary, the operator would think it was a military aircraft (as you suggested), not a civilian aircraft. Since a rapid interception was highly unlikely to be attempted, and even less likely to be successful, being confused as a military aircraft would also assist in avoiding identification as MH370.
It’s also true that ZS could have delayed the turn south until he was well past the Nicobar Islands and out of range for all land-based radars. Doing that, we might have been seen by incoming commercial flights near N571, or possibly by a radar at Port Blair, or possibly visually from one of the Nicobar Islands. Perhaps he thought there was less risk of detection of the southbound course by turning near IGOGU rather than continuing NW for quite a distance past the Nicobar Islands before turning to the SIO.
@Mick Gilbert
«wrong Michael, I didn’t pose that question.»
Michael, please do accept my apologies.
@airlandseaman @all
« … the ~40,000 foot altitude at KB (~FL380), derived from the raw KB civil PSR data, is based on facts. It was well vetted by several independent investigators (including me, Victor and Bobby to name only 3) over a year of intensive investigation and analysis. »
May I challenge this statement? 🙂 In the document mentioned below, a geometrical analysis of the radar data at KB and BW shows that the data is not genuinely coming from the localisation mentioned i.e. KB airport antenna and ButterWorth airport antenna. It is shown that the military radar at Bukit Puteri and at Western Hill did actually send/receive the radar echoes. Thus the data we have at hand has been transformed and interpolated in 4Dimensions to resemble as if it was received at KB and BW. Thus the data is not genuine and cannot be used for speed estimation. The interpolation had to account for several factors like the shift of the “source” antenna, the rpm which are not the same compared to the SSR rpm at KB or BW airports for synchronisation for ex and other like clocks of the different host systems. The data was indeed transformed. And we have, (sorry I have), no idea on what was the exact processing of the data by the military before they transmitted it to the screen of the controller in charge.
A typical example is the Cone of Silence at Kota Bharu. The absence of symmetry is clear when considering the KB location given in the Excel file. In the contrary the circular symmetry is striking when considering Bukit Puteri antenna. I let you discover this in the short illustrated report below.
In conclusion, the data can only be used for the geographical path it represents but not in time. The Malaysian report underlined the good match between the military and the civil data… of course ! they come from the same source ☺
Please find here my contribution on the subject: https://www.mh370-caption.net/wp-content/uploads/KB-BW-radar-data-discussion.pdf
ps: I did not find anywhere a similar study or mentions of this on this blog but if I missed it, sorry to the author and to you all for the duplication
@ventus45: After MH370’s disappearance, there was a US team sent to investigate. Some years ago, I was able to track down the individual from that team that reviewed the radar data, including the Indonesian military radar data. He told me the Indonesian tapes were blank. Even targets that were known to pass within range of the radar station were not detected. This was never officially acknowledged by the Indonesians. Possibly the radar station was turned off at night to reduce the use of fuel consumed by the diesel generator powering the station.
@Jean-Luc Marchand: That is VERY interesting. If your conclusions are true, and I think we all need to think about this a bit before jumping on board, it would mean the Malaysian radar operators are a bit confused about the source of the data. Based on your knowledge of ATC radar, why do you think the civilian primary radar targets would not be used when in range?
@Jean-Luc Marchand
Your contribution, linked in comment above, is emphatically worthless.
The XLS file shared by Mike Exner describing the PSR reports form the Kota Bharu and Butterworth terminal area radars, are exactly that: the PSR target reports from Kota Bharu’s ATCR-33 and Butterworth’s NEC ASR.
I know this to be so: I extracted the reports from the ASTERIX logs.
@DrB, etc
TNI-AU long range air defence radar (aka ARSR)
The TNI-AU operated Thomson-CSF TRS-2215 series radar systems in the northern Sumatra region. A report, authored by a TNI-AU colonel, described how these radar systems were operationally compromised. They employed a three stage transmit amplification system that involved a TWT, travelling wave tube, and two stages of CFA, cross field amplifiers. Due to the inherently low service life of the second stage CFA, the radars were typically operated without this stage to prolong the operating period of the radar to deliver maximum range detection.
So, even if SATRAD 231, 232, 233, and 234 (Loksuemawe, Dumai, Sabang, abd Sibolga) had been powered up and operating in PSR mode their detection range was likely ineffective. The colonel’s report stated a functional PSR range of between 64 and 81 NM for these four TRS-2215 installations without the second stage CFA.
Noting that the Malaysian’s SIR, section 1.1.3/5, recorded that ‘The Indonesian Military however stated that they picked up MH370 earlier as it was heading towards waypoint IGARI.‘ Most likely, that was SATRAD 232/Dumai detecting 9M-MRO’s departure from WMKK – using its SSR capability.
@Jean-Luc Marchand:
Re KB & BU radars:
Don is correct. Your analysis and conclusion are completely wrong. I know this for certain from detailed discussions with the in-country source that provided the ASTERIX logs to me. All the raw data is in range and azimuth coordinates that exactly match with the KB and BU radars. It is not from any military radars. Besides, the Cone of Silence in the KB data proves it is from the KB radar. Plus, the civil radar rotational speed (as observed in the KB & BU ASTERIX logs) is different from the military radars. So, your theory is easily shown to be 100% wrong.
Re ASTERIX logs.
It seems that forceful assertions prevail, but evidentiary exhibits are few.
Put the ASTERIX logs up.
I presume Jean-Luc Marchand and his team have the software to decode them.
@ Victor, DrB, Don, airlandseaman
Re Indonesian TNI-AU PSR’s.
We have been going around these radar issues in circles, just like the antennas themselves, for ages, from early days.
If it was known in some circles, that all of Indo’s Sumartra PSR’s were often shut down and so ineffective even when up and running (noting that you yourselves have proposed that Zahari probably might have known, to help validate your turn around Sabang), then why would he bother wasting all those precious fuel miles (about 400Nm) going around Ache ?
He could have overflown Sumatra, via Pulau Perak to Nagan (now IVRAR) as I proposed long ago.
As a side note, it is interesting that waypoints proposed in earlier theories have been re-named. Example, UPROB is now PAKRA, NAGAN is now IVRAR, Air Route B219 deleted, Air Route M765 is now truncated to KB. Strange.
@Victor Iannello
@DrB
Gentlemen, for the avoidance of any possible confusion, I was not commenting on the status of the Sabang radar, I was simply correcting Bobby’s assertion that the “radar horizon is only about 25 NM from Sabang. It’s not, it’s about 42 NM. That was the only point I wanted to make with my original comment.
However, I would now like to comment specifically on the contention that,
The final turn to the south occurred at almost 100 NM range. That would have very difficult or impossible for the Sabang radar to discern if 9M-MRO were at FL50-FL100.
The final turn south in the UGIB route occurs about 89 NM (102 miles) from the Sabang radar. Given the elevation of the radar head at Sabang, the aircraft would have needed to have been flying below 2,000 feet ASL at that time to be sure of avoiding radar detection.
I am not commenting on anything other than the facts relating to line-of-sight from the Sabang radar head to various points along the UGIB route.
I agree with Victor that hypothesising about the myriad hypothetical factors that may have influenced the hypothetical choice of a hypothetical route is largely, if not entirely, a waste of time … hypothetically.
Readers can form their own view as to the plausibility of the UGIB route between 18:28 UTC – 19:41 UTC.
@ Victor
I can’t dispute what the investigator said, but that doesn’t mean that the tapes weren’t wiped before he got there.
Consider this.
MH370 was not Indonesia’s problem, they did not want to get involved.
If any radar had seen MH370, they would not want to admit it, since they did nothing about it. If that became public knowledge, there would have been a political storm within Indonesia, just as there was in Malaysia re the RMAF’s failings.
Then there was the Indonesian police general who later revealed that they did know where it went, and who was then “silenced” and “retired”.
Cover-ups abound.
About the only thing we know for certain about any radar data is that most it is questionable.
From a pilots POV it is not possible these days to know whether a radar is operating or not unless it has a NOTAM issued to that effect.
When I first started airline flying in the late 80’s the transponders of the day would register a radar pulse reception, via a light on the unit that would illuminate when a radar was being detected.
These were the Primary radars in use back then. Sometimes when over an ocean such as the Pacific, military radars would be registered as tracking the aircraft.
That doesn’t happen now. The transponders don’t register primary radar hits.
So, if there is a Primary Radar known to be on any particular track that you may be flying, and you knew where it was located, unless otherwise advised (which doesn’t happen with a military radar for obvious reasons) you would treat it as being active.
When I was involved with WSPR I asked this question about the track going through areas where known Military Radars exist and was told that Zaharie had an uncle of elevated rank in the RMAF, who informed him about such operational details.
That didn’t sound correct then and still does not.
Re ASTERIX logs – part 2
A quick search revealed: https://www.radartutorial.eu/10.processing/sp55.en.html
It’s long been stated that Indonesian resources, the TNI-AU and ATC radars, reported nothing of 9M-MRO’s track over the Strait of Malacca. While that assertion appears incongruous, on balance an informed analysis supports a conclusion that it was the situation on 7th March. My findings are…
Initial reports out of Indonesia stated nothing was observed.
The later dialogue with the former FAA representative, deployed as part of NTSB’s ‘go’ team in support of a Malaysian air accident investigation (as much as that existed in Mar-Apr 2014), confirmed that Indonesian sources had no information related to MH370.
I catalogued the TNI-AU capabilities for long range air defence surveillance: the Kosekhanudnas III command consists of SATRAD 231, 232, 233, and 234 radar installations at Lokseumawe, Dumai, Pulau We/Sabang, and Sibolga, respectively. TRS-2215 radars were deployed at these four sites. The command was supported with a networked Thomson-CSF/Thales C³ system. I have the precise locations of the radar heads. With Bob Hall’s help (AGI), and later the Cambridge Pixel tools, the terrain impacted radar horizon and range limits were estimated.
Further, the idea that TNI-AU’s SATRAD sites were not operated on a 24-7 basis circulated. This is a credible idea, given the nature of potential threats but also, the ability of TNI-AU to mount a response. That is, its air policing capability.
Later still, we became aware of the Kolonel Lek Kotot Sutopo Adji report on TNI-AU radar serviceability and performance. The colonel was a senior officer in TNI-AU Depohar 50, the technical unit responsible for maintenance of radar assets. I described the key, relevant, points from that report above.
So, two sources suggest that TNI-AU assets were either not operating or operating at significantly reduced PSR capability on the night of 7th March 2014.
On to TNI-AU’s ability to mount an ‘air policing’ action, an intercept, of an unidentified radar target. Such action was a questionable proposition on 7th March 2014. Only after making the ‘FMT’, beyond waypoint MEKAR, would 9M-MRO have broached the Jakarta FIR boundary that runs only some 10km north of SATRAD 233 Pulau We/Sabang. The FIR boundary is the line to be protected. North of Pulau We/Sabang it is close to ID’s territorial line and its EEZ boundary with IN/Andaman and Nicobar Islands. Importantly, Pulau We/Sabang is more than 900km from the closest ‘fast jet’ base at Pekanbaru where the, then, active Skudron F-16A aircraft were deployed. One has to consider whether Skuadron 3 at Pekanbaru provided its F-16As on 24-7 readiness to launch an intercept and was capable of operating out to a range of 900km with reserves to return to an airfield or be supported by (C-130) air-air refuelling at night.
While TNI-AU does make a habit of publicising its ‘air policing’ actions, typically air intercepts that have taken place with aircraft operating without flight plan clearance, these are made in daylight in reasonable proximity to TNI-AU air bases. The primary reason for these actions is recovery of FIR transit fees.
Finally, adding to the comment about Shah’s familial connection with defence matters: a sibling served on the staff of the National Defence University of Malaysia, however, it’s fanciful to suggest that every member of staff of such an institution would have a deep knowledge about every domain of interest relevant to defence.
@TBill said: UGIB approach I believe effectively mandates all Arcs2-7 must be fit as a passive flight. In my view that is probably over-specifying the solution.
We can’t prove the flight was flown with automation and no pilot inputs. However, if we allow pilot inputs, it is impossible to identify a specific POI. I have a hard time with theories that allow pilot inputs but also predict a specific POI rather than a broad range of possibilities. The two to me seem incompatible.
@VictorI:
“However, if we allow pilot inputs, it is impossible to identify a specific POI.”
That’s only if you are stuck with optimizing probabilities for evidence that doesn’t converge on a single solution. If you start instead with new evidence for an accurate POI epicenter near Java, and working backward gives a plausible fit for all those same parameters that you have been trying to optimize, then maybe it is time to question the assumption that there were no pilot inputs (after adding many to accomplish a loiter).
There’s a way out of your paradox, by incorporating new acoustic evidence and recognizing that the barnacle growth temperature range from at least four studies favors a tropical crash site.
Proof will only come after the search has been resumed and the crash site is found.
On this memorial now nine years after MH370 went missing, perhaps there is a more optimal path with turns, that fits not only the Java endpoint but the detected “flyby” timing at Cocos and Christmas Island airports.
@370Location: Your approach starts with the POI. That’s obviously a lot different than what we were discussing.
@All: I just finished watching the Netflix series on MH370. Even though there was a lot of emphasis on the outlandish theories of Jeff Wise and Florence de Changy, there were balancing remarks from Mike Exner, Mark Dickinson, Peter Foley, and others. Mike in particular did a good job of explaining some of the technical work of independent investigators.
As expected, the format was to engage viewers. There was no new information presented of significance to solving the mystery.
@Victor
“if we allow pilot inputs, it is impossible to identify a specific POI.”
Agree partially with that, although probably not for all the same reasons. We may not have a pinpoint from flight data. May not be close to Arc7.
@TBill: If you have an unambiguous method to allow pilot inputs and pinpoint where MH370 crossed the 7th arc, I’d be interested in seeing it.
@Victor
« Based on your knowledge of ATC radar, why do you think the civilian primary radar targets would not be used when in range? »
To answer your question: because the civil ATC radar was almost surely switched off ! If you read the permanent NOTAM (see my updated doc) you will see that the ATS services were closed at that time with no controller in night shift. And as redundant military services were available covering the KB approach, the control was delegated to the military with their own system and the civil system was stopped for reducing the costs thus the routes charges (it is a common practice especially when the traffic is quasi zero as it was there).
The data given to the IG is formatted in the open Asterix format meaning it was formatted to be exchanged over the Malaysian “RADNET” or equivalent network. It could have been easily produced by the military with a coordinates conversion which is a common practice to serve a neighbour sector with data formatted in its specific perspective for example or to minimic a sensor data format for data fusion in another centre.
As explained in the doc, we need to know which RMDCE or alike Front End processor handled the data last. To know this we have to parse the data. I could be in a position to have this be performed. This means I would need to receive the data ? you have me personal mail address if the answer is yes.
Another question is whether the logs files includes plot records or track records.
Other explanations on ASTERIX and the European ARTAS system are in the document that I just updated to include my replies to some questions raised on this blog
@all
the updated doc is here :
https://www.mh370-caption.net/wp-content/uploads/KB-BW-radar-data-discussion.pdf
@Ventus45
” It seems that forceful assertions prevail, but evidentiary exhibits are few.
Put the ASTERIX logs up.
I presume Jean-Luc Marchand and his team have the software to decode them.”
Indeed, Agree and see my post to Victor above
JL-M wrote ‘ To answer your question: because the civil ATC radar was almost surely switched off !
That claim is the most egregious nonsense.
You clearly didn’t read my comment above.
The ATCR-33 combined SSR and PSR installed at Kota Bharu provides en-route surveillance out over the Gulf of Thailand & South China Sea. The system logs show PSR, SSR and combined targets reports throughout the sample period.
The NEC ASR at Butterworth provided en-route surveillance coverage plus terminal area PSR coverage for Butterworth AB and Penang International Airport. Penang International operates 24hrs.
Please, the best course at this juncture is to admit an error and withdraw that ‘paper’.
@Don Thompson
” the PSR target reports from Kota Bharu’s ATCR-33 and Butterworth’s NEC ASR. I know this to be so: I extracted the reports from the ASTERIX logs.”
Please Don, can I have the data to get them parsed ? Did you check the SIC/SAC fields with Malaysian authorities ?
@airlandseaman
« … provided the ASTERIX logs to me. All the raw data is in range and azimuth coordinates that exactly match with the KB and BU radars. It is not from any military radars. Besides, the Cone of Silence in the KB data proves it is from the KB radar. Plus, the civil radar rotational speed (as observed in the KB & BU ASTERIX logs) is different from the military radars. So, your theory is easily shown to be 100% wrong. »
Interesting shooted statement. Please read my updated doc and you will see that any Front End processor can basically performed a « coordinates conversion » which is a common practice to exchange data between clients like ARTAS for example in order to performed data fusion. Please have look at these modern system that have evolved a lot …
In addition, the civil approach ATS services were closed at that time … so who was going to use the data. The military ? they have much better tools and the controller did not need this data. The radar system was most certainly shut down during the night.
At least can we exchange 🙂 ?
J-LM,
We are obliged to not share those logs.
@Jean-Luc Marchand,
You are assuming that an asymmetry in the “cone of silence” demands that the radar be located such that there is symmetry.
That is an unwarranted assumption. An asymmetry will be produced by a target which has a backscatter coefficient which depends on the viewing angle. This is the case for airliners. So, an asymmetry in the ranges at the edge of the cone of silence is to be expected. There is no justification for moving the radar location.
JL-M
I’ll repeat, please, the best course at this juncture is to admit an error and withdraw that ‘paper’.
J-LM
Again you wrote ‘The radar system was most certainly shut down during the night.‘
Absolutely wrong. Read carefully:
The ATCR-33 combined SSR and PSR installed at Kota Bharu provides en-route surveillance out over the Gulf of Thailand & South China Sea. The system logs show PSR, SSR and combined targets reports throughout the sample period.
The NEC ASR at Butterworth provided en-route surveillance coverage plus terminal area PSR coverage for Butterworth AB and Penang International Airport. Penang International operates 24hrs. Similarly, the system logs show PSR, SSR and combined targets reports throughout the sample period.
Perhaps you’re assuming the provided radar logs were of the form described by ASTERIX CAT-240, recorded subsequent to processing through the surveillance data processor. That’s not the case.
The ‘machine’ data were shared with the constraints of an NDA but with the proviso we could share the product of our analysis. That, we did.
@Jean-Luc Marchand: When passing Kota Bharu, MH370 had already been passed off from Lumpur Approach to Lumpur Radar, which I assume functions like the “centers” here in the US. You would not expect an airliner to be talking to an approach controller at high altitudes, so why does it matter that Kota Bharu Approach was closed? Likely, they were talking with a center controller that was sitting in a building near Kuala Lumpur. And certainly, there is no relationship between operation of a radar station and the whether the associated approach facility is manned.
@Victor
Spot on! Furthermore, the authors claim that radar control was likely transferred to military controllers at the RMAF base near Bukit Peturi, simply because Kota Bharu ATS was not available after 1600 UTC (2400 MYT). However, contrary to the authors’ claim, the nearby RMAF base (Gong Kedak – WMGK) does not operate H24. The Malaysian AIP states that ATS at Gong Kedak is not normally available after 1100 UTC (1900 MYT). Accordingly, there is no justification for the claim that control was transferred to the military simply because ATS at Kota Bharu was not available.
https://aip.caam.gov.my/aip%20pdf/AD/AD2/WMGK/WMGK-Gong%20Kedak.pdf
@Victor Iannello
@Andrew
Et al
I know that there have been some borderline bizarre discussions over the years but this one regarding the civilian radar data has got to come close to taking the cake.
The fact that the Kota Bharu Terminal Primary Approach Radar captured MH370 as it transited back across the Malaysian Peninsula has been a part of the public record since the release of the Factual Information Report back in March 2015.
For those who apparently need to be reminded, SECTION 1.1 – HISTORY OF THE FLIGHT, 1.1.3 Diversion from Filed Flight Plan Route – 1721:13 to 1822:12 UTC [0121:13 to 0222:12 MYT], b) DCA Civilian Radar Data from Kota Bharu states unambiguously,
“From 1730:37 UTC [0130:37 MYT] to 1744:52 UTC [0144:52 MYT] a primary aircraft target was captured by the Terminal Primary Approach Radar located to the south of Kota Bharu Airport runway.
…
The primary aircraft targets above have been confirmed by DCA and its maintenance contractor, Advanced Air Traffic Systems (M) Sdn. Bhd. (AAT), that it was Kota Bharu Primary Radar Station which captured them.”
None of that was even vaguely controversial at the time.
That the KB TPAR forms part of an integrated Air Traffic Service system is clearly spelled out in the AIP MALAYSIA ENR 1.6 RADAR SERVICES AND PROCEDURES.
Again, entirely uncontroversial.
Frankly, what should have been immediately controversial to anyone with even a passing understanding of radar systems, would be to suggest that a military-grade long range air surveillance radar, such as the Martello S-743D at Gong Kedak, would have an elevation coverage of less than +12° so as to create the cone-of-silence attributed to it.
@Mick Gilbert: Your last point is a good one. The COS for the military radar is much larger than we would expect.
@Jean-Luc Marchand: Considering your expertise in this domain, I encouraged the discussion of the source of the primary targets for the civilian radar data. But with the comments here you have received, I recommend that you either revise or withdraw your paper.
@Victor
….”@TBill: If you have an unambiguous method to allow pilot inputs and pinpoint where MH370 crossed the 7th arc, I’d be interested in seeing it.”
I assert the flight can be viewed as “mostly passive” only from Arc2 to Arc5. If we drop the assumption of passive to Arc6, I think I see excellent (superior to me) fit to the Inmarsat data.
This of course presents a big issue, trying to figure out what happened after Arc5? Seems clear to me now though, descent and slow down.
UGIB report presents a lot of good thinking about descents and slow downs between Arc1 and Arc2. I actually view that period as high altitude, but the descent and slow down calcs to me apply after Arc5. In short I view the period between Arc5 and Arc6 as similar to the period between Arc1 and Arc2, that is: it is hard to say what happened due to active pilot. Although in 2022 I have finally come to a tentative personal understanding of the overall flight logic.
From my perspective, DrB may have been closest with his 2018 curved paths to 31.5s. But instead of passive slow down after Arc5 (related to DrB’s fuel models in his 2018 estimates), I see it as deliberate descent and slow down.
@TBill said:If we drop the assumption of passive to Arc6, I think I see excellent (superior to me) fit to the Inmarsat data.
What is your objective criteria for a superior fit?
@victor @Andrew
“that you either revise or withdraw your paper.”
I revised the paper because I agree that the CoS at Bukit Puteri is raising a question. I found it also when considering the actual CoS at KB on which I worked today (cf the new doc in which I added 2 figures and a paragraph on KB only, I will modify the rest at Butterworth soon). Nevertheless I am still not at ease with the data as explained in the doc and a post to Don (to come): the discussion couls be shorten by giving the ASTERIX CAT value.
« so why does it matter that Kota Bharu Approach was closed? »
The issue is not « whether or not the aircraft talked to KB Approach controller ». The issue is on the radar data: my challenge is on the source of the data. One should check whether or not the actual KB radars sensor was On or off and acquired the data or not. My reading of the Excel file data is that it was either Off or the data was processed by a tracker creating an unbalanced data set or Bukkit Puteri radar sensor(s) provided it (less likely now). The fact that we cannot get access to the ASTERIX does not help solve the question: we are told that the radar system at KB is mentioned (but is it the sensor itself ?) but we have a graphical translation of this data which shows that it appears to have been processed or to come from another sensor. Thus the data is not “genuine” …
@DrB
My experience in SAR data processing, leads me to think the back scatter cross section is to close its maximum when an aircraft passes above. The main factor is more the latency in the tracker algorithm: after how many bad echoes did it decide to stop the tracking (for the entry path in the CoS) and after how many consistent echoes did it create a track (at the exit path). This is visible thanks to the slightly different in the red circles of the pictures in my doc.
@Don
Please could I get in touch with your contact in Malaysia. I am ready to sign a NDA and get the data parsed.
The discussion could probably conclude faster if some of ASTERIX header values were known, your choice. This is not a secret of state. Could you ask your contact about the CAT, SIC and SAC only ?
I am still puzzled by the geometry of the data and I have updated the doc with the diagram of the antenna at KB which can acquire echoes up to 43° in elevation (at true height of 40500ft). Obviously, echoes are missing in the data as the max measured elevation is 36° and 25° (entry and exit of CoS). I have included a green circle in the figure also for visual checking.
Thus if the data was actually acquired at KB, which is possible I am not fighting against this :-), please could you tell us what is the CAT value in the ASTERIX data header ? and possibly the SIC/SAC values ?
In the absence of the CAT value, and based on the fact that echoes are missing, my analysis is valid in considering that the data are “track” data which means « processed by an unknown tracker algorithm » thus not genuine anymore and consequently improper for speed evaluation.
J-LM wrote ‘One should check whether or not the actual KB radars sensor was On or off and acquired the data or not.‘
I have previously stated: the sources of the target, and track, data were the Kota Bharu ATRC-33 and Butterworth NEC ASR radar heads. Explicitly. No position translations by a radar/surveillance data processing system.
If you wish, do continue develop your hypothesis. However, the fundamental premise is unfounded (i.e. wrong).
The format of the communication that was logged and the topology of the network have been fully understood. Our processing of the data was undertaken with the involvement of the party that provided them.
I do not intend to state any further detail.
The additional figure 2 in your latest revision is a somewhat simplified depiction of the ATCR-33 detection envelope. Do consider whether the parameters given in the figure (RCS, Pd, Pfa) are relevant to the scenario under discussion. Should one expect the 777’s RCS to be constant from all aspects?
@All: This website has been under cyber attack and appears to once again have been hacked with malicious software. I’ll work on repairing it, but I am also considering whether to continue.
@Victor,
Here’s hoping you do decide to continue. 🙂
@All: The site should now be clean and with upgraded security. Now I just need to persuade Google that I am not trying to illegally sell prescription drugs.
@Victor
I was wondering why an ad popped up this morning…I thought you may have gone to the darkside and started running ads for revenue.
I hate foxnews because the ads they run make a dual core 2.8 Ghz laptop go to 100% and the fans run at full speed.
@George Tilton: Hopefully those ads are gone for good.
I’m grateful you all have applied your experience and knowledge to this problem. Keep up your hard work,
@George Tilton
George, having the fans run a full speed is part of Fox’s mission statement, isn’t it?
@VictorI:
The comment section of your reports has for years been the last bastion for those of us on the quixotic quest to actually find MH370 using facts, evidence, and the scientific method. Your moderation has created a forum that may be the last remaining chance for serious discussion towards resuming the search. What’s left would be Reddit dominated by populist conspiracies, Twitter where anything goes with the attention span of a gnat, Facebook with private echo chambers of manipulators and true believers, and then proponent discussion sites where only propaganda and confirmation bias by non-detractors is tolerated.
If you ever decide not to continue hosting this forum, I hope you’ll consider handing off the management to volunteers. The alternative will be a void, filled by one of the above.
@Maple: Welcome and thank you.
Hi Victor, as you may know a few days ago, a click on recent comments diverted people to a link trying to sell some type of drugs, are there any possible compromises to anyone’s email address or devices who got diverted to this link?
I enjoy reading your forum it would be sad for it to go. Your fair and listen to other views, your not pushy, And are you are always polite to others.
Thanks Victor
@370Location: Thank you, Ed.
@Joseph Coleman: The re-direct should not have exposed your email address.
Ed said everything I wanted to say, strongly echo his comments. Hope you manage to keep the site going Victor, your efforts greatly appreciated by many of us.
My take on the Netflix fiasco.
https://bit.ly/3LjgC4g
@airlandseaman: Well said, Mike. As a contributor to the series, I hope your comments get some traction. Netflix should address your concerns.
@M Pat: Thanks for your support.
@airlandseaman et al
I agree with Mike’s comments. I have not watched the Netflix garbage and have no intention of doing so. I have a number of friends here in NZ who know of my continuing interest in the mystery and I have advised them all that there is absolutely no merit in watching the series either.
A good few years ago I was also declared to be a Russian sympathiser too, by some idiot on an MH370 blog, when I happened to mention that I had spent a little time in Moscow, on 4 separate visits, and met my wife there. Nothing could be further from the truth, and obviously so if the reason for my visits was known. And my wife is not Russian.
One small comment I could make about Mike’s summary of the end of flight scenario . . 15,000 ft/min sounds like a “steep” descent, but “steep” is relative. Our original description of that descent was “a spiral dive”, and that was misinterpreted by many as a vertical dive. It isn’t, and at the likely speed of the aircraft at that point, a descent of 15,000 ft/min represents a trajectory of only about 20 degrees below the horizon.
I would like to congratulate Victor for continuing to manage and moderate this blog, and for the contributors who continue to debate the scientific and factual data. Nothing else comes close.
@Victor Iannello
@airlandseaman
While the Netflix show (I cannot, in all good conscience, refer to it as a documentary) was certainly a shameless exercise in promoting sensationalist nonsense, it has had the effect of turbocharging interest in the disappearance.
MH370 Facebook groups are being swamped with quite literally thousands of new members; people of all ages, from all walks of life, from all around the world. It is quite astounding.
I guess PT Barnum was right when he said, “There’s no such thing as bad publicity.“
@Mick Gilbert: The only objective of Netflix and RAW is a high viewership, and they did succeed. That’s why ANY series of this type is not likely to be accurate. It’s sensationalism and emotion that pulls in the eyes.
@Victor
I watched the first episode of the Netflix documentary, last night .
I am waiting to see how Jeff Wise deals with the fact he was not wanted on the Independent Group. But maybe his credibly is glossed over. I was delighted to see Mike Exner appear as I thought thank goodness the film might in fact go on to be factually correct. But I see from comments the documentary has been discredited by those in the know.
The first episode missed out some crucial facts and included some new ones I didn’t know about but these were in the main personal memories of the families of the passengers and crew.
I shall watch it all bearing in mind its sensationalist perspective.
@Brian Anderson: I agree that the high descent rate does not equate to a nearly vertical descent.
The progressively high descent rate derived from the BFO data is consistent with a downward acceleration of around 0.7g. If there were no pilot inputs, that can only be achieved if the plane was in a steep bank, which also means the plane crashed soon after, and the plane should have been located near the 7th arc. On the other hand, there is a possibility that there was a forward-yoke pilot input, and the pilot ultimately recovered from the steep descent and glided the plane away from the 7th arc. The shattered debris indicates the plane ultimately entered the water at high speed. This means the sequence was one of dive-glide-dive. This seems odd, but not impossible.
I think it more likely that there were no pilot inputs, and the POI is relatively close to the 7th arc. This means the subsea search either missed the debris due to low quality or missing data, or some of the contacts were misclassified. After a new search exhausts those possibilities, it’s time to search wide of the 7th arc.
Thank you, Julia.
@ALSM
Also on the McKay oil rig story, I thought the show inaccurately inferred that authorities knew in real time on Day-1 this guy saw an aircraft go down in the South China Sea. But it was some days later, McKay offered he might have seen something, not sure what, not sure when. McKay is just one of 20-30 problematic, conflicting eyewitnesses around the globe, unfortunately none of these seem to have actually seen MH370.
As Mick Gilbert said on another forum, Blaine is just one of many people who found MH370 debris. I am not mentioning names, so Jeff and Florence cannot assassinate their reputations too, in the name of book profits. The fact Blaine succeeded should be interpreted as finding some relatively easy-to-find evidence given Malaysia’s apparent lack of care or effort. Blaine filled a void in the area of collecting possible debris. As an American concerned citizen, no more no less, he became a major contributor to the evidence base that we have.
@TBill: I’ve had differences of opinion with Blaine, most recently on the provenance of the new debris. However, we are all grateful that he worked to recover MH370 debris, and no sensible person believes he is a Russian agent.
When the debris starting showing up, it skewered the theories that Jeff Wise and Florence de Changy were developing. (Before the debris and the captain’s simulator data became known, I was open-minded about the path north, and tried to find ways the BFO might have been spoofed.) After the debris was discovered, rather than modify or retract their theories, they attacked Blaine. I don’t expect that either Jeff or Florence will ever come around to accepting the reality, as they’ve both written books promoting their theories, and they are completely dug in.
Meanwhile Jeff accuses me on Twitter of “delaying the search for MH370 by nine years by suppressing a possibility that you don’t like.”
He is so self-absorbed that he doesn’t understand the absurdity of his accusation.
@Victor, you said: I think it more likely that there were no pilot inputs, and the POI is relatively close to the 7th arc. This means the subsea search either missed the debris due to low quality or missing data, or some of the contacts were misclassified.
I agree that the plane most likely lies close to arc 7 and that the null search result is because the relevant section of the arc has not been searched. I know that some of you consider 39.6S improbable, but so is a search miss or dive-glide-dive.
@Paul Smithson: I don’t know how to reconcile the fuel shortage for a location that far south. The required speed would be too high to achieve the required endurance.
I would view the search miss as more probable, especially in light of what we observed in the search for the San Juan submarine. However, I do understand your logic. As I’ve said before, the lack of a delay element in your path is attractive. But, I would advocate searching other areas before yours.
@victor. As previously demonstrated, the path is flyable (from VAMPI) at FL360, M0.840 for excellent BTO fit. I propose first engine down, APU started, at around 00:01, drift down descent commences settling at ROD approx -300fpm. Second engine down approx 00:11, descent profile uncertain. APU drops out approx 00:18:00. Residual fuel refills the line and APU restarts.
Other factors permitting longer than expected endurance: electrical loads mostly off since IGARI, packs off for about an hour, some accessible fuel beyond anticipated amount. Possibly 700kg from centre tank (below auto-off point of the scavenge routine), accessed by turning all fuel pumps on when first engine goes down.
And IF the TAT fuel flow adjustment is in error that could give you another 10 mins (roughly 2.5% of 7 hours). Beyond the footnote in the owing fuel flow table what is the empirical basis for the TAT adjustment to fuel flow?
*Boeing not owing…
I have to assume the fuel flow tables are based on empirical evidence.
If I didn’t have that number, I would try to derive it as follows:
For an aircraft gas turbine engine, the fuel flow for non-standard conditions varies as [Tt]^x, where Tt is the total temperature, and x is around 0.5 [Blake, Jet Transport Performance Methods]. At or above the tropopause, Tiso = 217K, and at M=0.84, Tt,iso = 248K, so the effect of non-standard temperature on fuel flow adds around 0.5 (Tt-Tt,iso)/248, or around 2.0% for (Tt-Tt,iso)=10K. The Boeing table says 3%. I don’t know why there is a difference, but for a modern engine, I have no idea how accurate the relationship that fuel flow varies as Tt^0.5.
We have no reason to not trust the number Boeing provides.
@victor. Thanks for that re TAT compensation derivation.
@Paul Smithson,
My 9M-MRO fuel model uses the following equation:
Corrected fuel flow ratio = (TAT / ISA SAT at sea level)^0.68
TAT is the total air temperature.
ISA SAT at sea level is 288.15 K.
My empirical equation matches the Boeing fuel flow tables for LRC and for Holding for the B777-ER with Trent engines. It also matches the 3%/10C footnote.
I was unable to find a solid theoretical justification for the total temperature dependence. The equation Victor referenced appears to be an empirical approximation (as is my equation).
@Victor Iannello:
Do you have any indication that you have been deliberately targeted for the second time now, because you are searching for the truth?
Or absent any such pointers, do you believe it was just a random attack (again) and therefore just bad luck ?
Either way, I am seconding the pleas above for your continuation of the forum.
You and your team here are the last best hope for the next of kin to find the plane and discover the truth one day.
I think without the IG the search would have been long over.
@IG:
I assume you are all working pro bono and that’s very honorable. I vaguely remember a comment by DrB from last year or so in which he calculated the thousands of hours he had spent working on the drift model, fuel calculation, etc.
I guess that all of you have put in a similar effort.
Hence I was wondering if it wasn’t reasonable if you were afforded a part of the reward if the plane is found at/near your calculated location ?
@Peter Norton: I have suspicions about the source of the attack, but I prefer to not say.
I have no expectations for a reward. I think there are better uses for that money. Also, successfully finding the debris field would be the culmination of work by many people over the course of many years.
@Victor
I am glad to see you are keeping this blog alive … and full of life 🙂
ps: I have withdrawn my paper and will publish a new one taking into account the inputs and new elements I received.
@Paul Smithson: I think the discrepancy between my calculated 2% per 10K of TAT deviation from ISO and the published valued of 3% is due to 2 effects:
1. As @DrB notes, the exponent that relates total temperature to fuel flow could be greater than 0.5 for the Trent engine.
2. I neglected the increase in drag due to an increase in Reynolds number at the higher temperature, which will also increase the fuel flow.
(The exponent that @DrB has empirically derived is likely the combination of both these effects.)
Again, we have no reason to believe that the published value of 3% is incorrect.
@J-L Marchand: That seems sensible.
Thanks to Victor and Dr B for further comments on TAT compensation for fuel flow estimation.
Separately, I’m obliged to report that (in correspondence) Andrew says there isn’t any material amount of accessible fuel in centre tank beyond scavenge and any usable fuel would be included in the fuel on board figure.
@Paul Smithson: Thank you for not burying facts that do not strengthen your theory. When it comes to MH370, that’s rare.
@Paul,
I’d reviewed the 777 fuel system configuration earlier, as a refresher, and intended to post. Good to read that you and Andrew are corresponding.
@370Location,
Re: March 3 5:56 pm post above: “When I checked a very loud Diego Garcia hydrophone event coming from the direction of Java, it was obvious on local seismometers. Using multiple methods to determine the epicenter, the most accurate puts it exactly on the 7th Arc BTO ping within the limits of both satellite and seismic propagation data. I’ve since determined that the sound is consistent not with an implosion, but a sinking section of MH370 hitting the seabed.”
– Can you describe the epicenter location and earthquake magnitude detected by the local seismometers?
I’m trying to gain a cursory understanding if the impact of a sinking section of MH370 would be detectable by the local seismometers and the Diego Garcia hydrophone(s).
Note: If you have already published information detailing the likelihood of detection please provide a link.
Let me inform you that we are active to denounce the Netflix BS in France.
I made a French video to explain all false informations on it.
https://youtu.be/wSJdbFrI7XQ
You can have a translation on subtitle on YouTube.
We have to react and explain the facts distorsion to the public.
I have also been very active to attack Florence de Changy theory from the beginning.
I totally agree with Mike Exner reaction.
@Gilles Diharce: Thank you for the video link. I agree that it is important for those of us that are familiar with the facts surrounding the case to expose the fallacies that appear in the video.
I don’t think there will be any remorse on the part of the producers. They intentionally ignored the facts and guidance presented by guests like Mike, Don, and Pete Foley, and promoted the sensational (and provably false) theories of Jeff Wise and Florence de Changy, all in the name of viewership. Yes, the video created renewed interested in re-starting the search, but it also diffused the focus of the search in the SIO.
@Kenyon:
Thanks for asking. The method I used for the epicenter was to visually pick P and S wave arrival times from the event for each seismometer. I then ran a simplex convergence linear optimizer with the unambiguous signals, weighted by distance. The lat/lon I got was overly precise, within 200m of a low altitude 7th Arc. (The arrivals don’t agree quite that well, and there is uncertainty on the 7th Arc radius, but still a surprising result).
As for detectability, wreck hunter David Mearns has called the acoustic evidence a “red herring”, but declined to look at my reports. Just yesterday he doubled down saying that aircraft debris is too light to make a detectible seabed impact. I countered with a conservative kinetic energy analysis:
https://twitter.com/370Location/status/1635552703463186432?s=20
I started with the ZFW Zero Fuel Weight of MH370, 174,369 kg, detected 55 min after the 7Th Arc timing, for a minimum of 1 m/s averaged velocity. Joules = 0.5 MV^2 gives an estimate of 87 MegaJoules. That’s equivalent to 45 lbs of TNT, or a magnitude 2.1 seismic event.
A steel cannonball would sink a 5 m/s. Smaller debris sinks more slowly. I suggested that a larger section of the fuselage sinking with the mass of the volume of water within it might generate a M2.5 seismic event, equivalent to about 300+ lbs TNT.
Mearns counters that the ZFW wouldn’t apply to a fragmented plane, and that a soft seabed would dampen the sound. Still, an event was detected directly on the 7th Arc.
As noted in my reports, a CTBTO hydrophone array on Ascension Island strongly detected the rupture of a single lithium battery pack in a seabed seismometer on the US Atlantic coast. Hydrophones can be exquisitely sensitive to sounds conducted into the SOFAR channel, and I’ve shown how upslope-downslope conversion at Java with MH370 was equivalent to the ARA San Juan detections on CTBTO hydrophones.
M2.5 is about the threshold for quakes being catalogued because it takes several seismometers to determine an epicenter, and they are not always well placed for an event. In this case, the GE.CISI is fairly close to the Java coast, and has the strongest waveform:
https://370location.org/wp-content/uploads/2022/03/180517-0655-SeismicPlot-CISI@011535-win250-3-25Hz-Audio-snippet-@30x.wav
If multiple pieces of debris fell from the crash site, say engines detaching from their pylons first, the seismic signals might correlate with later debris, and they do as noted on the autocorrelation plot:
https://370location.org/2018/02/a-strong-anomalous-acoustic-event-on-the-seventh-arc-near-java#april2019
I believe this autocorrelation plot from the nearest seismometer shows MH370 debris raining down onto the seabed debris field:
https://370location.org/wp-content/uploads/2019/04/190410-0347-CISI@011433-011618-Win100-JavaAnomaly-AutocorrelationPlot-fig.pdf
I might also note the frequency content of the event. Quakes typically have peak energy content at 1 Hz or below. This event has a visible peak around 15 Hz, more into the anthropogenic range of seismic sources.
I think we have to reform a group of professionals like the IG at the beginning to discuss in details of what need to be considered to focus on the search area.
Patrick Blelly and Jean-Luc Marchand have an interesting point of view and defined an area.
Why not joining all forces to suggest a deep review of what could be done?
@Gilles Diharce: I think there is general consensus to search an area along the 7th arc between around 32S and 36S, including areas missed in the previous searches, and also further from the arc from what was previously searched. I would be surprised if OI is not in general agreement.
What remains is an agreement with Malaysia with no-find, no-fee terms. OI has indicated it would not search without an agreement.
What do you suggest we do?
@Victor Ianello
Re your post above at February 11, 2023 at 4:39 pm about the fidelity of the simulators.
I agree and would suggest that the system is probably chaotic. In addition there may be unmodeled forces.
The one that interests me is a coriolis pseudoforce which I suggested here a long time ago in the context of it’s possible effect on the overall course, you responded, correctly, that it was too small to have a significant effect.
However, during the unpowered terminal descent it may be just enough to directionally ‘stabilise’ the phugoid and possibly extend the glide distance.
The pseudoforce would ‘push’ towards the east, the empennage would ‘steer’ the aircraft such that the path was more of an open curve rather than a tight spiral. Residual trim tab is still an issue but this may mitigate it to some extent.
Thus I suggest that the wreckage may be found SE or ESE of the final arc crossing. Probably outside the searched area.
P.S. I hope that you keep your blog running, it is an oasis of sanity.
@flatpack: Thank you for the comment.
I believe all the malicious malware is gone from the site. Google seems to be slowing removing all the search results that link this site to online pharmacies, so all’s good so far.
I believe I know the source and timing of the attack, and I’ve taken steps to prevent that from occurring again. We’ll see.
Hi Victor,
I consider that the area already covered will be wasting time.
We have to extend the search not along the 7th arc but further south out from the arc as Patrick/JL Marchand suggest.
How considering the silence of Malaysia to the OI offer?
At 09:03am Gilles Diharce wrote ‘I think we have to reform a group of professionals like the IG at the beginning to discuss in details of what need to be considered to focus on the search area.‘
Then, barely 7hrs later he wrote ‘I consider that the area already covered will be wasting time.‘
What happened to the prospect of discussion?
370Location
I am having difficulty reproducing the energy calculation of a 777 hitting the sea floor at 1 m/s. In the equation
Joules = 0.5 MV^2
is M not in kg? As in the MKS (meter-kilogram-second) system? In which case, if M = 174,000 kg, V = 1 m/s, wouldn’t the resulting energy be 87 kilojoules? Earthquake of magnitude 0.4? I am missing something.
@sk999, @Kenyon:
Yow. Thanks, Steve, for checking my math and catching the MKS error. You certainly don’t miss much. I slipped a cog. 87 kj (not Mj) is correct. Depending on the magnitude method, it might be as low as M0.1, or just 20 g of TNT. It seems low, but probably more than that exploding battery pack detection threshold for distant hydrophones.
Taking the kinetic energy estimate a bit further, I believe the volume of water within a sinking fuselage section would be included in the impact energy. Suppose half the fuselage was intact, a cylinder about 25m long, 6.2m in diameter. Lets conservatively leave out the mass of the fuselage materials, replacing with lighter water since it sank. That should be about 750 cubic meters of water = 750,000 kg. That gives Ke of 375 kilojoules, so eq about 90g TNT = magnitude 0.5 seismic.
Sinking faster at 4 m/s gives 6,000 kj = 1.4 kg TNT = 1.3 Magnitude.
Unfortunately, the Java event was not cataloged, so unknown magnitude. I’d need to get some proper software using seismometer calibrations to estimate the actual magnitude.
Thanks again for the reality check! May I have another?
Ask yourself if the buoyancy of the water within a volume, enclosed, or partly enclosed in a flexible “container” will be + or -.
@GeorgeG:
I expect any large section of the fuselage that wasn’t demolished on impact would fill up with water and slowly sink. As it sank, any trapped air would be quickly compressed in the first few hundred meters. By 3,400m, the only buoyancy would be from materials less dense than water, weighted down by heavier aluminum, steel, and composites, because any trapped air within the materials would be miniscule.
Using the density of water in the kinetic energy equation gives a conservative estimate for the mass of the sinking debris. If the bulk was lighter than water, it would float, but we’ve only seen scant hollow or lightweight composites as found debris. If you’re expecting more debris to float than sink, then there should be a lot more found debris, like the control surfaces on the wings and a few cabin components (which indicate a breakup).
At least 40 regional seismometers detected the Java event, consistent with an event directly on the 7th Arc. Several were in an Australian array, where beamforming might point toward a source origin, but it is consitent with, and undoubtedly be less accurate than the epicenter calculation from nearby seismometers.
Consider a B777 in a spiral dive, where there is a possibility that aerodynamic forces resulted in the separation of the right wing in the region of the No.2 engine pylon. The aircraft tends to stabilize in a 30° nose down attitude, tail and left wing high. Entry into the water is much cleaner than that exhibited by the AF447 A330 break-up, where the aircraft struck the ocean belly-first at a speed of 152 knots (282 km/h; 175 mph), comprising vertical and horizontal components of 108 knots (200 km/h; 124 mph) and 107 knots (198 km/h; 123 mph), respectively. Along with an attitude of 16° nose-up, and a roll angle of 5.3° to the left. [No apologies for the detail from Wikipedia – I wrote it there.]
The aircraft effectively broke up over a horizontal distance of about 600m as the kinetic energy was arrested. Small metallic pieces and heavy items, engines, landing gear and wing center box section were found on the bottom along the path of the break-up. Some parts of the fuselage were found further out; their descent was modified due to the homogeneous nature of the aircraft construction, e.g. composite materials, where water permeation wasn’t instant and the gradual loss of buoyancy slowed the sinkage rate, along with increasing drag as water pressure grew with depth.
Getting back to 9M-MRO, my suspicion, based on the limited items of the aircraft recovered so far, is that the aircraft entered the water in a more bullet like manner. The entry kinetic energy would be immediately converted into the opposing buoyancy component. The major damage to the fuselage would be forward of the main wing and the remaining section aft of the wing would be largely intact.
This provides a large volume of fuselage, including the center fuel tank and cargo hold that will retain homogeneous spaces that will restrict water permeation, and as per the AF447 description the inherit buoyancy will be lost slowly. The sinkage rate is now controlled by the rate of water permeation and drag as pressure and depth increase.
In essence, there is no speeding bullet to the seabed. For instance, the landing gear tyre/tire air pressure will slowly be lost when the rim seal is broken by water pressure and the air volume within the tyre/tire is slowly replaced by water.
In short, I’d be surprised if the major part of this (probably) mainly intact fuselage and attachments arrived on the seabed with a sinkage rate greater than 0.5m/sec.
@Gilles Diharce said: I consider that the area already covered will be wasting time.
We have to weigh the probability the debris field was missed in areas already searched with the probability there was an extended glide after a steep descent. NOBODY knows these relative probabilities, although some have strong opinions, which I believe are unjustified considering what we know.
There are many reasons the debris field might have been missed, including low quality or missing data. The whole point of the current article was to show an area along the limits of the GP and OI searches that was never searched. Are you really suggesting that searching there would be a waste of time?
Thank you for the informative website and the continued work on this topic.
@Victor Ianello:
Is there a way to determine the ”2 mins” point in the simulator data [1] other than by overlaying the case graphs over the ATSB image (apologies if I’m missing something obvious)? The article says that ATSB adjusted the position for the X,Y coordinates, but all of the case files start from zero (X,Y & time), so the ”2 mins” point has different coordinates and different time-values depending on the case. I also noticed that there’s a small difference (about 3 degrees) in the angle/heading of the flight paths between the ATSB image and the image created for the article, and was wondering if that was intentional or not.
I agree that there’s no reason not to search the areas missed in the earlier searches, to the extent that it can be efficiently done.
@airlandseaman:
From the review [2]: ”We also know that the Inflight Entertainment System (IFE) failed to logon 89 seconds later as expected. Given these facts, it is virtually certain MH370 impacted the water by 00:21UTC”. Just noting that even this 30.5 km2 zone would be practically unreachable by 0:21, it being located 33 km south from the 7th arc.
[1]: https://mh370.radiantphysics.com/2018/08/19/end-of-flight-simulations-of-mh370/
[2]: https://drive.google.com/file/d/1J3B7RxKDTu8uKVMefteqEDLAESO9k4l0/view
@eukaryote: Welcome to the blog. You asked: Is there a way to determine the ”2 mins” point in the simulator data [1] other than by overlaying the case graphs over the ATSB image (apologies if I’m missing something obvious)?
It’s funny you asked that, because I did spend some time converting the Boeing simulation results so that:
1. The track before fuel exhaustion was due south and along the BEDAX-SouthPole longitude of 93.787500°. This means rotating each simulation path.
2. Fuel exhaustion occurred 2 minutes before crossing the 7th arc, so the crossing was not due south of the point of fuel exhaustion.
I’ll create a figure later that shows the results.
@All: Here is a figure for the Boeing end-of-flight simulations with corrections for the initial track and the 7th arc crossings.
Also shown in the figure are the contacts identified by GO Phoenix. Many of these contacts are close to the simulated trajectories and were classified as likely to be manmade, but were never investigated further. It would be helpful to have more information about the criteria used to determine if a manmade contact warranted further investigation. For instance, if the investigators were looking for a large debris field like AF447 (600m x 200m), were smaller contacts dismissed?
https://www.dropbox.com/s/qy9zs1wf48kgvr4/2023-03-16%20Corrected%20Boeing%20Sims.png?dl=0
@eukaryote: Re your statement: “Just noting that even this 30.5 km2 zone would be practically unreachable by 0:21, it being located 33 km south from the 7th arc.” Please clarify what “30.5 km2 zone” you are referring to.
Consider the two cases: (1) no human control at the end, PF dead or alive, and (2) live PF continuing to control the aircraft after MEFE at 00:17:30 UTC.
(1) In the first case, impact very close to the 7th arc (15-20nm) is highly likely based on the Boeing simulations, my own Level D simulations on Nov 2, 2014, and the Russian data documenting 5 or 6 aircraft incidents. Noting that the 7th arc is only known to about 5.6 nm, and the altitude uncertainty adds another 1.5 nm, searching out to about 25 nm each side of the arc is a reasonable target.
(2) If there was a live PF continuing to control the aircraft after MEFE, the flight path was more likely straight ahead, not a spiral descent like case (1), but still descending rapidly by 00:19:37. Assuming a max possible forward ground speed, the plane could be up to about 35-40 nm south of the nominal 7th arc.
@airlandseaman:
I’m referring to the “high priority search area” talked about in this February article.
From the image, and with the 33 km reference value, I measured the approximate distance from the 7th arc to be 24 km. Then the minimum needed ground speed after crossing the 7th arc would be 520 knots (with a straight path). With the added 5.6 nm error reducing the 24 km to 13.6 km, the required ground speed drops to 300 knots.
I don’t know if the 300 knots is possible, but basically a lot of things would have to go right for the required speed to drop even below 500 knots. The 3 factors (7th arc error, 7th arc crossing point and direction after LEP) would have to coincide in an extremely unlikely combination to make it (maybe?) possible to reach the zone before 0:21.
@eukaryote: If it is in the priority area Victor identified, it is more likely there was an uncontrolled spiral descent (Option 1 above).
Can’t the values be changed to indicate a controlled descent, I noticed that how some people use the data to come to an alternative conclusion, considering MH370 ended with an active pilot at the controls how far we would be searching beyond the 7th arc ?
@eukaryote234
Bear in mind that impact with the water is only one of the scenarios that could explain the “missing” IFE log-on. Other reasons include:
1. The APU might have flamed-out before the aircraft hit the water, causing a loss of electrical power.
2. Extreme aircraft attitudes during the final descent might have broken the line-of-sight from the aircraft SATCOM antenna to the satellite.
In other words, the aircraft might have impacted the water some time after 00:21. At this point, we simply don’t know.
#2 is possible. If the missing IFE logon was due to an extreme attitude (for example, a 90 deg bank away from the s/c), then impact would have been very soon thereafter. #1 is unlikely given the estimated 13 minutes of residual fuel left in the APU fuel line.
I’ve seen a lot of garbage, but have you ever seen something as ridicule as this in a newspaper ?
https://www.irishmirror.ie/news/world-news/flight-mh370-conspiracy-theorist-spots-13115740
I should have made it more clear, but my point was to question the certainty of “impact by 0:21”, not the plausibility of the zone. I consider the two scenarios incompatible with each other, so one can’t be nearly certain and the other highly plausible at the same time.
@Peter Norton: Ridiculous, yes. But one of many.
@ALSM
RE: “#1 is unlikely given the estimated 13 minutes of residual fuel left in the APU fuel line.”
The ATSB stated the following in its report MH370 – Definition of Underwater Search Areas”, dated 3 December 2015 (updated 10 December 2015), p.8:
“From this information, the APU had a maximum operating time of approximately 13 minutes and 45 seconds. The pitch attitude would have an effect on the usable fuel for the APU; an aircraft not under control may exhibit dynamic changes in pitch attitude (i.e. phugoid motion) which could have limited the APU’s ability to receive fuel. In-flight acceleration forces could also affect the distribution of fuel in the tanks.”
According to that analysis, unusual attitudes during the descent could have reduced the amount of fuel that was available to the APU. I assume that information came from Boeing.
@ALSM
Re: NETFLIX
Why do you think the SATCOM was rebooted at 1825?
@Andrew: Of course, I’m very familiar with the “Definition of Underwater Search Areas” statement re APU fuel. I agree with it. But the devil is in the detail. My point was that, if there was no radical change in attitude (as in my scenario (2) above), there should have been an IFE logon if still airborne at 00:21, but there was none. If there was a radical change in attitude, impact was likely to follow soon thereafter, whether before or slightly after 00:21. In either case, 100nm glides are not consistent with the facts.
FTR… In all the simulations Paul Mattson and I conducted in the United simulator on Nov 2, 2014, the RAT came online ~30 seconds after MEFE, and the APU came on ~30 seconds after the RAT came up. Those times are the same times reported by Boeing in the official ATSB and MY reports. In NONE of our simulations did the APU stop supplying power within the first 5 minutes, even when the plane reached very steep bank angles or entered phugoid dives and climbs. We observed both in our simulations. But the APU stayed on. Given that Boeing has never tested a real aircraft under these conditions, I assume the statement in “Definition of Underwater Search Areas” is based on Boeing’s engineering analysis, not actual experimental data. From my engineering perspective, APU fuel exhaustion prior to the 13 minute limit may be possible under the most extreme acceleration conditions, but it is unlikely due to the type of acceleration occurring at 00:19:37. If anything, that -.68g acceleration would have made it easier for the APU to draw fuel from the line.
@TBill: I don’t think the PF had any clue the AES was powered down when the Left Main AC Bus was depowered circa 17:21. Nor did the PF have any clue the AES would automatically reboot and logon when he restored power to the Left Main AC Bus circa 18:24. I don’t believe the PF removed power to the Left Main AC Bus to control the AES. It was done for another reason, and the AES power off and then back on was just an unintentional result the PF was completely unaware of. We know the PF disabled ACARS reports circa 17:21. So there was no need to turn off the AES to stop ACARS reports.
So, the question is, why did the PF turn off the Left Main AC Bus power for an hour? We can be reasonably certain that the plane was depressurized circa 17:21 to neutralize everyone in the main cabin. Turning off the power to most lighting and equipment in the main cabin was likely part of the plan to minimize the chance of interference from the 238 people in the main cabin. After an hour, the PF would be reasonably sure the deed was done. So the plane was probably repressurized then and the Left Main AC Bus power was restored so that the PF could take off his pressure mask and breath normally again. He may have gone back in the main cabin to confirm all 238 people were dead. Having confirmed, the PF made the final turn to the south. What the PF did after the FMT is still uncertain. He may have killed himself at that point, or later on the way south, or he may have remained alive to the end. But I think what happened between 17:21 and 18:40 is what I describe above.
During the time when the aircraft is presumably still flying, was there any attempt by Malaysian Airlines to send ACARS message to the MH370? Or even trying to SATCOM call the aircraft? I’ve watched a few documentaries on MH370 recently, however I didn’t come across any reference to ACARS message or SATCOM call. I was wondering whether anybody has look into this aspect.
@Alex: Welcome to the blog.
Malaysia Airlines operations tried to send an ACARS message over the SATCOM link at 18:03, and another over the VHF link at 18:39. Neither message reached the plane.
Operations also initiated two SATCOM calls: one at 18:40, and another at 23:14. The calls were unanswered, although we do have BFO data from both of these calls that were used to help reconstruct the flight path.
@TBill: According to the Safety Investigation Report (SIR), the following cabin functionality was provided by the SATCOM:
Cabin Packet Data (Data-3) – Interface via the Panasonic System 3000i IFE equipment:
– SMS/e-Mail
– BITE-offload
Also, according to the SIR, the SATCOM phone in the cabin was available for the cabin crew.
Perhaps the SATCOM was initially disabled via the left main bus to prevent data and calls from the cabin from reaching the ground. After the passengers and crew were incapacitated, the power to the left bus could be restored.
@victor. To clarify. Are you saying that IFE can be turned off by switch, preventing use of phone or text by passengers….but that the crew sat phone would only be disabled by shutting down the satcom link altogether?
@Paul Smithson: We had this discussion several years ago. I believe that Don and Andrew arrived at the conclusion that the IFE/PASS switch could disable the cabin phone on 9M-MRO.
What makes this all the more confusing is there is a distinction between exactly how it works, and how the captain might have thought it worked. For instance, it might not be safe to assume that the captain was aware that turning off the IFE/PASS switch would block SATCOM voice calls in the cabin, as the feature is not well-documented. On the other hand, powering down the SATCOM would be a certain way to block all communications that use the satellite link.
@Victor
@Paul Smithson
RE: “I believe that Don and Andrew arrived at the conclusion that the IFE/PASS switch could disable the cabin phone on 9M-MRO.”
Yes, the Boeing Service Bulletin for the installation of the Passenger Compartment Electrical Power Isolation Switches (ie the IFE/PASS SEATS and CABIN/UTILITY power switches) included functional tests to check the operation of the switches after installation. The IFE/PASS SEATS switch test directed the engineers to select the switch to OFF and then check that a number of cabin systems were de-powered, including the wall-mounted telephones.
As Victor mentioned, it’s not clear if the Capt knew the IFE/PASS SEATS switch would de-power the cabin wall-mounted telephones in addition to the seat units. The FCOM description of the switch is vague; it only says the switch removes power from “all IFE components” and “passenger seats, including: seat motor power, personal computer power outlets, and telephones”.
@Victor – Thank you from a reader of your blog for many years for taking the effort to continue to have a great forum for key contributors to discuss their thoughts.
@Andrew
As an aside to discussion on MH370:
You write: “…. including the wall-mounted telephones.”
In the unfortunate circumstance that Flight Crew had to disable the “CABIN/UTILITY” power, would this mean all communication between the Flight Deck and the cabin would be lost, other than personnel using the intervening door ?
@ALSM
For the record:
1. Neither @eukaryote234, nor I, said anything about a 100 NM glide. I can’t speak for @eukaryote234, but I believe the aircraft impacted the water close to the 7th arc, certainly not 100 NM away.
2. @eukaryote234 questioned the plausibility of impact by 00:21, given the distance from the 7th arc to Victor’s proposed High Priority Search Area requires a VERY high average groundspeed if the aircraft were to impact the water by that time. The two scenarios I mentioned that might explain an impact after 00:21 were proposed by the ATSB in MH370 – Definition of Underwater Search Areas, presumably with Boeing’s agreement.
3. To be frank, I think it’s a folly to assume the modelling of the APU run-time in the United simulator was an accurate representation of what would happen in the aircraft in a fuel exhaustion scenario. The RAT deployment and APU auto-start characteristics are certainly well known and are likely to be accurate. However, the modelling of residual fuel availability to the APU, especially during extreme attitude changes, is not likely to be accurate. As you stated in your comment “Boeing has never tested a real aircraft under these conditions”.
@George G
RE: ‘In the unfortunate circumstance that Flight Crew had to disable the “CABIN/UTILITY” power, would this mean all communication between the Flight Deck and the cabin would be lost, other than personnel using the intervening door ?’
No. The CABIN/UTILITY switch removes power from the galleys, the ground service bus (except the main and APU battery chargers and left forward fuel pump), the utility busses, the gasper air fan, the fluorescent cabin lighting and the beacon, wing and logo lights. The cabin interphone system is powered by the Captain’s Flight Instrument Bus via the Standby Power Management Panel. It is not affected by the CABIN/UTILITY switch.
Ta
@Andrew:
Regarding BOEING SERVICE BULLETIN 777-24-0074, Revised October 5, 2006
Here is the list of systems that are tested after installing the IFE/PASS switch. I don’t see mention of testing the cabin telephones:
– See that all video entertainment players and audio entertainment players are off.
– See that all video monitors and projectors are off.
@Andrew: I did not mean to infer that you or @eukaryote234 were suggesting an impact 100nm from the arc. But some people do still believe that was possible. I know you and I agree that it is relatively close to the 7th arc.
As I stated, consistent with the ATSB statement, impact shortly after 00:21 is certainly possible if the plane was in a steep bank to the left or inverted at 00:21. (That is, both Ball HGAs were pointed away from the satellite.) If that was the case, impact must have followed soon thereafter.
I agree that the simulator probably does not accurately model APU run time under the most extreme attitude/acceleration cases. But how bad does it have to be for the APU to flame out before 13 minutes of fuel in the line is exhausted? Clearly, the ability to draw fuel from the left tank is affected by attitude and dynamic forces. But how much do attitude and dynamic forces affect the fuel in the line, assuming there is no air in the line? I assume the APU has a fuel pump. Can you confirm?
@ALSM
Thank you. Re: pilot having no clue, the pilot does get SATCOM warning messages on the EICAS screen when the power is cut on the LEFT BUS. Thus I would tend to feel pilot probably knew when SATCOMs were on or off.
@All
Just to be clear, my understanding is the IFE/PASS switch in 9M-MRO was an modification installed later (not in orig B777 delivery version until later in production)
@Victor Iannello,
The subject of BOEING SERVICE BULLETIN 777-24-0074, Revised October 5, 2006 is ‘ELECTRICAL POWER – General – Install the Passenger Compartment Electrical Power Isolation Switches (Partial)‘
For BOEING SERVICE BULLETIN 777-24-0075, Revision 4: January 08, 2014, the subject is ‘ELECTRICAL POWER – General – Install the Passenger Compartment Electrical Power Isolation Switches (Complete)‘
SB 777-24-0075 does include a test for ‘airplanes with wall mounted telephones, make sure that the telephone does not operate. Swipe a valid credit card through the card reader. Make sure that no dial tone can be heard.‘
The qualification of the test set out in 777-24-0075 suggests, with reference to credit card payment, that the test relates to a passenger amenity provision of telephone service.
Provision of a SATCOM telephone handset at the purser workstation would be, at a minimum, related to airline operational use or even be considered safety related.
Passenger amenity service would route through the Cabin Telecommunication Unit (CTU) whereas airline operational or safety service is likely to be a direct connection.
The SATCOM SDU provides four direct analogue voice connections: two for flight crew use and two that may be routed to the cabin crew purser workstaton and another cabin crew station. The SATCOM SDU also provides a CEPT-E1 (digital, multiplexed) connection for the CTU.
The level of detail describing connection of the purser workstaton or other cabin crew station phones is not (yet) to hand.
Releasing the IFE/PASS switch would not affect the SATCOM SDU direct analogue voice connections.
Use of passenger seat located handsets, via the CTU, would be disabled by release of the IFE/PASS switch but as stated elsewhere MAS had revoked passenger air-to-ground calling service.
@TBill
The SB for IFE/PASS switch modification was incorporated on 9M-MRO. There are a number of flight compartment photographs where the switch is evident on the P5 electrical system panel.
@TBill: Re: “…the pilot does get SATCOM warning messages on the EICAS screen when the power is cut on the LEFT BUS.” Can you provide a reference? What are the specific “SATCOM warning messages”? When the LEFT BUS power is cut, how many similar messages show up all at once?
Don Thompson: Thank you. In contrast to SB 777-24-0074, SB 777-24-0075 does make it clear that wall telephones in the cabin are disabled by the IFE/PASS switch.
I highly doubt there is an EICAS message related to cabin SATVOICE that would be generated by the IFE/PASS switch.
On the other hand, isolating the left bus WOULD generate EICAS messages that definitively indicate that no SATCOM services would be available, including SATVOICE. Even though this information is available in the aircraft training manual and the PMDG 777 simulation model, it might have been verified on a flight previous to MH370.
So based on what we know, my best estimate for why the left bus was isolated and then later powered was the pilot’s desire to disable cabin SATVOICE (with EICAS message confirmation) during the time period when use of the phones in the cabin was possible.
@airlandseaman: The FCOM clearly states that the following EICAS alert messages are displayed when corresponding functionality is lost:
SATCOM
SATCOM DATALINK
SATCOM VOICE
SATVOICE LOST (temporary message)
These messages also appear in the PMDG 777 simulation when the left bus is isolated.
Victor:
Thanks for the SATCOM message details. But what I was interested in are all the non-satcom related messages, if any. IOW…If the Left Main AC Bus looses power, wouldn’t there be more than SATCOM messages, given that there are many loads on the bus other than the AES?
Victor:
Re: “So based on what we know, my best estimate for why the left bus was isolated and then later powered was the pilot’s desire to disable cabin SATVOICE (with EICAS message confirmation) during the time period when use of the phones in the cabin was possible.” OK. I’m warming up to this possibility, given new (to me) details. If this was the case, why do you think the BUS was re-powered circa 18:24? What purpose would be served? A confirming visit to the main cabin?
@airlandseaman: With all passengers and crew incapacitated, there would be no reason to continue flying with no left bus.
The list of EICAS alert messages generated when isolating the left bus includes:
ELEC AC BUS L
HYD PRESS PRI C1
HYD PRESS DEM L
ELEC GEN OFF L (from turning off the left IDG)
SATCOM DATALINK
SATCOM
SATVOICE LOST
ELEC BUS ISLN L (from opening the bus tie)
So, re-powering the left bus clears the EICAS alert messages, restores the redundancy, and provides an opportunity to monitor attempts at incoming SATCOM calls. Perhaps there are other reasons.
@Victor @TBill
Many years ago in 2016 or earlier I participated in an exchange on this site regarding an active pilot with @TBill and others. @Victor responded as recently that this did not allow for a specific entry point and active pilot should not be considered.
I appreciate all of the great work done by this group and appreciate the work in support of a S34.23, E93.79 entry for an unpiloted straight route.
But if a live pilot wanted to enter the ocean at S21.0, E104.0 with zero fuel without dumping, he could do s-turns, holding, or other routes to allow it. The Inmarsat data would need to be met by the route followed but there are infinite paths to that end point.
Given the great care to plan the path into the South Indian Ocean, it makes sense for the pilot to just finish the mission and fly the aircraft to the exact spot where he wants to remains to be.
This is clearly feasible and is as likely as assuming autopilot cruise to fuel exhaustion on arc 7 at S34. An active pilot could have flown much further north along arc 7. Clearly drift analyses and maybe even review of ping information from earlier searches may still be relevant.
I support TBill because anything is possible with a capable pilot on a mission and the aircraft is still on the bottom in the ocean on arc 7 south.
The pilot is too capable an aviator to leave the final resting place to chance when he is capable of putting it into the water with zero fuel exactly where he wanted it to lie for eternity.
@Hank: I don’t think you understand my position. Sure, an active pilot could guide the plane to where they want. I’m saying this:
1. It would be unlikely that a route with maneuvers after 19:41 produced the BTO/BFO signature of an automated flight with no pilot inputs. The more significant the maneuvers, the less likely.
2. Once you allow maneuvers, I believe it becomes very difficult to use the data sets we have to predict a unique 7th arc crossing. I’ve asked Bill for his objective criteria for favoring his route. I still have not seen anything, despite claims of a “natural” fit. On the other, people often express opinions about intent, and fit a route on that basis. It’s possible to use this method and be correct, but that relies heavily on subjective criteria, and it should be recognized as such.
@Victor
RE: Service Bulletins 777-24-0074 and 777-24-0075
Eagle-eyed readers might notice that, of the MAS B777s, only WB161-WB173 were affected by the two service bulletins. 9M-MRO (WB175) is not among those aircraft; however, both bulletins state that “An equivalent change is on subsequent production airplanes.” I therefore assume the service bulletin changes were incorporated when 9M-MRO was manufactured.
@ALSM
RE: “But how bad does it have to be for the APU to flame out before 13 minutes of fuel in the line is exhausted? Clearly, the ability to draw fuel from the left tank is affected by attitude and dynamic forces. But how much do attitude and dynamic forces affect the fuel in the line, assuming there is no air in the line? I assume the APU has a fuel pump. Can you confirm?”
The ATSB report states “…the difference in location between the left engine fuel inlet and the APU fuel inlet would result in approximately 30 lb of fuel being available to the APU after a left engine fuel exhaustion.” It is not clear if that fuel is in the fuel line, the tank, or both, but it seems clear that some of it, at least, is in the tank. The question is how much?
To answer your question, there are two fuel pumps that would operate in the MH370 flame-out scenario:
1. The fuel pump inside the APU fuel cluster, attached to the APU. That pump pressurises fuel received from the aircraft fuel system before it passes to the fuel filter and APU fuel metering valve.
2. The APU DC fuel pump, attached to the rear spar of the left wing, at the back of the centre tank. That pump operates if the APU is commanded to run and there is no fuel pressure in the left engine feed manifold. It also operates in the event of a left engine flame-out, if there is no fuel pressure in the left engine feed manifold.
In my view, the APU should run for at least a few minutes using the fuel already inside the APU fuel line when the auto-start sequence commenced. Ordinarily, the APU DC fuel pump would replenish the line with fuel taken from the left tank. However, there are two conditions that might limit the amount of residual fuel the pump could provide to the APU:
1. If the inlet to the APU DC fuel pump is uncovered, the pump would not provide fuel to replenish the APU fuel line. It is not known how much attitude change would be required to uncover the inlet; however, it might be small, given the small quantity of fuel sloshing around in the bottom of the tank. A left bank combined with a nose down attitude, might be sufficient to uncover the inlet.
2. Given the left engine flame-out and no pressure in the left engine feed manifold, the APU isolation valve would open to allow the APU DC fuel pump to supply the left engine, as noted above. The pump would therefore supply both the left engine as it attempted a relight, and the APU. It is not known how much of the residual fuel would go to the engine and how much would go to the APU.
@Victor @ALSM
There are potentially a number of reasons for turning SATCOM back on. If I recall correctly from discussions years past, the IFE video cam might be activated, allowing monitoring of the cabin. Incoming SAT calls could be monitored, though apparently not answered.
The inherent assumption Jeff Wise makes is that turning SATCOM back on was a huge mistake (as far as allowing us to know MH370 was still flying). Jeff asserts a knowledgeable pilot would not have done that, instead a knowledgeable pilot would have maintained radio (and SATCOM) silence. This logic then serves as Jeff’s jumping off point to Russia conspiracy theories.
I personally consider the pilot may have known almost exactly what he was doing. I see the SATCOM going off later at ARC7 for the obvious reason: the pilot knows we might figure out (from SAT phone etc) he was still flying, and at Arc7 the pilot now finally does want radio (and SATCOM) silence and probably visual silence.
@All,
Coming at this from the accident scenario POV. I try to explain the return of power to the SDU to be a complete consequence of a damaged electrical system.
Perhaps, it was the main battery going flat that caused this reconfiguration of the electrical system. Initially, ELMS had something to do with the complete down power of the L Main. After one hour and being the only remaining power source to ELMS, the battery went flat, effectively disabling ELMS. Power to the L Main returned.
But who knows, a damaged electrical system would be completely unpredictable.
@Tim: I am struggling to understand your scenario.
The only way the battery could fully discharge is if both IDGs, the APU, both BU generators, and the RAT all failed.
Yet somehow, after the battery was fully discharged, power was restored to the left bus?
And even with the degraded electrical configuration, the crew did not divert to the nearest suitable airport?
@Victor,
This scenario assumes the L side of the MEC has been damaged by rupturing O2 bottles. The battery charger, C1, C2 TRUs have been damaged leaving the battery to power the flight instrument bus. The battery might last an hour. When it failed it caused ELMS to fail as well, the battery being the last power source to the P310 panel. Reversing any load shed to the L Main that might have happened at IGARI.
Unusual caveat—-damaged electrical system won’t behave as expected.
@Tim: So despite the massive electrical system failures, the crew continues past Penang Airport at cruise altitude, turns northwest up the Malacca Strait and joins N571 at VAMPI. At some point, power is restored to the left bus due to the additional failure of ELMS.
I’m sorry, but I view that scenario as very, very unlikely.
@Victor,
No, in this scenario the crew are unconscious a few minutes after the IGARI turn, the aircraft is then a ‘ghost flight’, autopilot off, flying controls down graded to secondary.
Yes, fortunately a very, very unlikely scenario, but makes more sense than a murder/suicide. Just a single point of failure, no need for any contrived, unrealistic planned suicide.
I know I have a different opinion to most on here, but I have yet to see convincing evidence for a planned suicide. At the moment I think the O2 bottle rupture fits so neatly with all the circumstantial evidence we have.
@Tim,
It may “make more sense” to speculate upon a scenario where some situation developed resulting in loss of some or many electrical services, and where the pilot (whichever one) then attempted a return to base, or alternative airport.
The initial turnback may be so interpreted.
If the available evidence indicates an increase in altitude and higher speed on the backtrack, then one may speculate on the reason for this.
One may even speculate that the next turn may have been an unsuccessful attempt to divert to (say) Butterworth with a degraded aircraft system, or systems.
We may further speculate that by some means, the pilot was later able to restore some of the previously lost electrical systems.
If by this time, still with a degraded aircraft, and speculating again, now with the knowledge that all other persons in the aircraft had demised, we can only speculate as the frame of mind of the sole person alive on board.
It takes little stretch of the imagination to consider that subsequent actions may have eventually resulted in the aircraft being pointed in one direction, and left in that state until fuel expiration.
Of course, one necessary speculation to allow all the above would be that whatever the nature of the initial problem the aircraft was not so degraded as to prevent continued flight at high altitude until fuel expiration.
Another speculation, which takes little imagination, would be that after reaching cruise and now in the that cruise phase of the flight, one of the pilots had left the flight deck and entered the main cabin.
Regardless of whatever pieces of speculation may be put together to tell whatever imagined story, the few pieces of evidence we have as to the probable final location of the aircraft are all we have.
It is to be hoped that when the aircraft remains are found that the flight data recorder is located and is still in such condition to provide information.
Then, and only then, will there be a chance, and perhaps only a chance, to determine what imagined scenario is closest to what occurred with 9M-MRO.
AND, regardless of scenario, perhaps there can then be a reduced chance of the same scenario re-occurring in the future.
@Victor, @Andrew. Adding to Andrew’s response to ALSM above, the below supposes there to be an experienced active pilot at left engine fuel exhaustion (LEFE).
For completeness it iterates some of what Andrew says.
Such a pilot might well have started the APU before LEFE, to exercise full control afterwards. Both @Jean-Luc Marchand and @Paul Smithson have postulated this.
To explain what would replace an APU auto-start as a source of the SDU reboot and so the 7th arc log-on, Jean-Luc said that the break-transfer of the load from the engine to the APU during engine run down would cause that reboot. However, based on an ATSB report that the SDU would “hold up” during similar break-transfers, such a reboot would be most unlikely in my view.
Likewise I do not think that Paul Smithson’s theory as to how the SDU could have been re-booted is consistent with what to expect from the APU, its fuel supply and auto-start.
Having now given further thought to what else could prompt this reboot I believe it possible that an air pocket in the APU fuel line might explain it.
At LEFE with the left tank dry both the engine and APU would both suck air into their fuel supply lines pending APU DC pump start and delivery to both of available residual fuel.
That pump would start on the detection of left engine failure, which would be when it had consumed the fuel in its line from the left tank and from its fuel system.
Once the pump then started refilling the engine’s line with residual fuel, it would deliver to the APU line too, that following the air already sucked in.
When that air pocket reached the APU that could flame out in turn.
As to the size of the pocket, that would be set by the time taken for the engine to fail after the left tank ran dry multiplied by the APU fuel consumption rate, 1 kg/min.
Because the tank can supply the engine by gravity I assume it to be sized for low line pressure losses. With a large diameter it would take longer to drain. However I do not know its size, so the fuel quantity it contains, or how long fuel within the engine fuel system would last.
Based on what I remember as @Andrew’s estimate of the APU pipeline internal diameter, 0.75 in., its length being about 100 ft., at the APU fuel flow rate of 1 kg/min fuel that pocket will traverse the pipe in about 7 mins, less the forshortening from its pocket length.
Supposing in a flame out the APU dropped below 95% rpm, at that point it would shed its electrical load, de-powering the SDU. Should it then recover before dropping further to 88% (when it would enter protective shutdown) the SDU would be re-booted, prompting the log-on request (LOR).
Yes the above relies on assumptions but is worth exploring I think should the presence of an experienced and active pilot at LEFE be conjectured sensibly, i.e. on the basis that the dive evident at the log-on acknowledgement, 7 secs after LOR, was deliberate.
More generally, it is the only potential explanation I know of as to how an LOR might result from other than an APU auto-start, leaving aside @Tim’s theory above.
As to the time between LEFE and LOR, that would include up to about 7 minutes before the APU flame out and recovery (up to 7 times that for an auto-start), that then followed by a minute for the SDU re-boot. That would mean earlier fuel exhaustion than UGIB has it, the difference that would make to the 7th arc crossing being just one consideration if an active pilot is supposed.
As footnotes to the above, the APU DC pump’s intended use during a double flameout from such as rain ingestion supposes of course that there is main tank fuel, so air ingestion into the APU fuel line does not arise.
Likewise, as to the unpiloted case of @Andrew’s earlier ATSB quote, without an APU manual start before LEFE again there would be no similar air bubble introduced to the APU line, so the above would be irrelevant to that. By ‘similar’ I mean in effect. I do not include air introduced by unmanned aircraft pitching etc. That would not reach the APU before LOR.
Then, unmanned there is the possibility also of APU flame out from vapour lock though in a pilot induced dive that would be less likely, based on an Excel analysis I posted a while back.
@Andrew, adding to what you say in your last two sentences, had the pilot selected crossfeed valves open before the right failed, and he could have ‘balanced’ tank fuel levels, I believe that as either main tank ran dry the opposite engine’s main boost pumps could supply fuel to both. Then if the left failed first, it is possible that the APU DC pump would keep the right running briefly at low power, or at least supply it residual fuel for relight, while also supplying the left for any relight attempt and the APU.
@Paul Smithson. Opening the crossfeed would release any fuel in that line for engine use, as we discussed.
@David,
Crossfeed valves permit fuel pumped from either main tank to directly supply the engine manifold of the opposite engine. If the crossfeed valves are open, and both main tank’s boost pumps are operating, both engines will experience fuel exhaustion simultaneously. Subsequently, open crossfeed valves and operation of the APU DC pump will supply both engine manifolds. So, both engines and the APU ‘competing’ for any remnant fuel accessible by the APU DC pump.
Does what you posit move the fuel exhaustion scenario on to something significantly different from asymmetric fuel exhaustion?
@Tim wrote ‘[…] damaged electrical system won’t behave as expected‘. Not true, the responsibility of the designer is not only to develop the normal operation of their creation, but also how its operation degrades through failures.
@Victor Iannello:
Re: Boeing simulations (earlier comment March 16, 2023 at 1:31 pm):
Do you have a source for the exact “2 mins” timings or did you have to determine it yourself from the image? Did you not ask the ATSB for that information in numerical form?
All that would be needed is a simple list of the time values for “2 mins” in all of the cases. Without knowing these timings, it’s not possible to do any kind of meaningful analysis with the data. So I can’t really understand why the ATSB would provide the rest of the data in clean and accessible form but leave out the timings.
@eukaryote234: First, I rotated all X-Y positions and shifted the longitude so that the initial track is along the BEDAX longitude. The time for fuel exhaustion and loss of autopilot is evident if you study the output parameters from the simulations, i.e., there is a drop in speed and a deviation from the previous track. Then, I shifted all latitudes so that the crossing of the 7th arc occurs 2 minutes from then.
@Tim: The flight path (straight with smooth turns around Penang and smooth intercept of the VAMPI radial, joining N571) is not consistent with flight controls degraded to SECONDARY with no pilot inputs.
@Victor Iannello: Thank you for replying. Somehow I did not expect that moment to be so sharply evident in the parameters, but looking at one of the cases, it indeed is as you said.
We published a response for Netflix in french.
https://youtu.be/ArqOJ-Gxvtk
@Don Thompson, “Does what you posit move the fuel exhaustion scenario on to something significantly different from asymmetric fuel exhaustion?”, I doubt it. Its significance lies more in what opening the crossfeeds would do to the residual fuel in the left tank, of more general interest.
On what I posit more generally though, there is the possibility that the search areas recommended are flawed for some as yet undisclosed reason. To me, having an reasonable explanation for the 7th arc log-on with a professional pilot active, which is currently missing, then would allow such a possibility to be considered: that is all.
As to the implications for track and the search area, because an active pilot would not necessarily follow the set last track of the unpiloted, as @Victor has observed there would be many uncertainties introduced. Variations as to what he might have done with crossfeed valves and their consequences would be just another complicating factor.
On closer examination what I have put might proved flawed. It might have underlying assumptions that are unfounded or unrealistic, including some unstated. For example, it supposes the pilot would be aware that fuel in the APU line would keep it running for a while after left engine failure, even if unaware of the other residual fuel in the left tank (as is likely).
Also I forgot to mention that air in the APU line would need to penetrate to the junction with APU DC pump delivery before it would form an air pocket between that pump delivery and APU.
To get to the details one would need to know the sizes of pipes, the sensitivity of the APU to air pockets and how fast it would decelerate.
@David
RE: “At LEFE with the left tank dry both the engine and APU would both suck air into their fuel supply lines pending APU DC pump start and delivery to both of available residual fuel.
That pump would start on the detection of left engine failure, which would be when it had consumed the fuel in its line from the left tank and from its fuel system.”
There are two scenarios where the ELMS will command the APU DC fuel pump to run:
1. APU fuel feed – no pressure in the left engine feed manifold with the APU running, or with the APU selector in START or ON.
2. Left engine fuel feed – no pressure in the left engine feed manifold and left engine below engine run speed with the fuel control switch in RUN and the aircraft in the air.
In your scenario, the APU is already running, so the ELMS will command the APU DC fuel pump to run as soon as there is no pressure in the left engine feed manifold. It won’t wait for the engine to drop below run speed.
Given the geometry of the fuel system, I think the APU DC fuel pump would start running and the fuel line would remain pressurised without “sucking air”, so to speak.
“…had the pilot selected crossfeed valves open before the right failed, and he could have ‘balanced’ tank fuel levels, I believe that as either main tank ran dry the opposite engine’s main boost pumps could supply fuel to both. Then if the left failed first, it is possible that the APU DC pump would keep the right running briefly at low power, or at least supply it residual fuel for relight, while also supplying the left for any relight attempt and the APU.”
I suppose residual fuel could be fed to the right engine if the crossfeed valve/s were open and the ELMS had opened the APU isolation valve for a relight attempt of the left engine. However, there can’t be much residual fuel in the left tank if some of the available fuel is already in the APU fuel line. I can’t see the residual fuel in the left tank being sufficient to support relights of both engines.
All,
Here is a new report (largely an update of one from 3 years ago) deriving confidence limits on a search zone (specifically the 7th arc crossing latitude) using just the SATCOM data but this time making projections for the proposed Ocean Infinity search zone. The analysis has been formulated in a way that permits imposing different assumptions about the quality of the data and subjective considerations on what is a sensible route. The constraining power of each contribution to the figure of merit on the 7th arc crossing is examined. A significant change from previous studies is that the time of fuel exhaustion is now an integral part of the route optimization process – not tacked on at the end as has been done previously. Because fuel burn rate is a function of altitude, this constraint helps reduce the degeneracy between Mach and altitude (although it does not eliminate it.) Another significant addition is the inclusion of simulations where the predicted BFO and BTOs of the proposed Bedax route south are subjected to random errors with similar statistical properties as the actual data and then rerun through the route finding optimizer. The results are sobering. The 7th arc crossing latitude ranges between -31.1 to -36.8 degrees, even though the “true route” crosses at -34.3. Simply put, the SATCOM data alone have no ability to define a “hot spot” on the 7th arc.
https://drive.google.com/file/d/1DTNe-4zh7FR8P0GNJhZLsW4RbTTsGzId/view
@SK999
Thank you.
@sk999: Thank you for the report, a few comments:
Page 26 (OI search zone): The map in Figure 9 makes it seem like the intention was to only search the previously unsearched side zones (5600 nm2, 92 days) and not the whole 183×88 nm area, which would make no sense with regard to the “hotspots”. After Plunkett’s recent comments about not having known that the 2022 anniversary event would be broadcasted, my impression is that this was never intended to be a serious proposal but more like just speculation for the event.
Page 33, 2nd last paragraph (unless I’m misunderstanding your point): The 98% figure represents the confidence level of the zone A1 with respect to the specific S34.2342 crossing point, not the overall probability of the crossing point latitudes within the zone (not comparable with the 30%).
@sk999,
Your recent paper is most interesting, and it generally corroborates the post-19:41 route and fuel probabilities presented by UGIB (2020). Niels Tas has also done this with similar results.
I have written a short note which shows the UGIB prediction most comparable to yours – involving the product of the route and fuel probabilities:
https://drive.google.com/file/d/1sgB151-cfE4N6znRsyGhxhtfY_TN03t7/view?usp=sharing
There is a good correlation of your result with UGIB (2020). In particular, the northern edge of your PDF is at -30.5 degrees which agrees with the UGIB prediction. There is a difference in the southern edge, which you predict to be at -34.5 degrees. My note (linked above) describes the revision to the UGIB fuel probability circa -36 degrees. Some time ago, other readers of this blog suggested some additional routes, ending circa -35 degrees to -36 degrees and which had adequate fuel and acceptable matching to the SATCOM data. I have confirmed and incorporated those additional routes, and they have the effect of shifting the southern edge of the fuel probability about one degree farther south. Using this more accurate fuel probability moves the southern edge of our route/fuel probability to -36.5 degrees, whereas your result only extends to -34.5 degrees. Thus, our revised prediction extends southward beyond your edge. It seems likely that your fuel model is excluding this zone from -34.5 degrees to -36.5 degrees. Perhaps you can explain why this is so. At least three people have previously reached the conclusion that routes ending in this zone can have an acceptable MEFE time and therefore a high fuel probability.
To clarify several points:
1. Our route and fuel probabilities were not calculated independently. Each pair of values is based on the same fit. That is, we don’t figure a fuel probability for any route which is not included in the route probability, and vice versa So, we figured these two probabilities simultaneously.
2. You have somewhat mischaracterized our method described in Appendix G.5 (Route Parameter Sensitivity Studies). We did not, as you supposed, simply vary one parameter while holding all the others fixed. That doesn’t tell you very much. Instead, we stepped one parameter through a series of assumed values, usually holding several specifically-listed parameters fixed, and we re-optimized the remaining parameters at each step. How many were held fixed and how many were re-optimized depended on the study parameter. For the longitude study, as indicated in Figure G-5 we held the flight level, course, and speed mode fixed and re-optimized the remainder. For Figure G-7, the initial bearing study, we fixed the navigation mode to be a great circle and held the flight level and speed mode fixed, and then we re-optimized the remainder. Therefore, your conclusion regarding the actual probability of the search area is inaccurate because we did not do the calculations as you seem to suggest, and for other, more important reasons given below.
3. None of our parameter sensitivity studies were used to predict the probability of the location of the aircraft, nor to estimate the probability of success within the recommended search zone. Search Area A1 was based on the assumption that the highest probability route was the one actually followed. Then the various uncertainties listed in Table 1 on page 55 were used to figure the search radius around that last estimated position. So, as @eukaryote234 said, the 98% probability refers to the conditional likelihood of finding the debris field if the assumption of the BEDAX 180 degree route were true. Thus, A1 represents the minimum area that must be searched. Without the assumption of a specific route, the area that must be searched is much larger, effectively being an area equivalent area to A1 around all acceptable route crossings at Arc 7. This is a large latitude range, even after figuring the aerial search and drift probabilities, which particularly constrain the northern edge of the Joint PDF to be considerably south of the northern edge based solely on route and fuel probabilities. This will be illustrated in our upcoming paper.
@sk999
@DrB,@Victor
Please find attachment: https://www.dropbox.com/s/8ruivq770gaiuzl/MH370%20-%20Another%20Search%20is%20anticipated.pdf?dl=0
The last paragraph reads:
Other than questioning the specificity of the UGIB paper, which questioning should prompt review and answer from the authors, the sk999 paper presents a preparatory history of the search zone definition. This provides background for the subsequent statistical analysis.
Reading some old articles and references here to the capability of the captain, if he had to choose a latitude it seems like he could have aimed for an end point for the flight at a latitude of a city where his daughter lived in Geelong, Australia at that time since he wanted to retire there near her. That would be a 38.14 S which seems significantly away from recommended search areas but could have been intended. Of course this is pure speculation but the human mind is so complex that one never knows what is too far from the truth or too close to truth until the debris field is found.
There is no evidence the PF intended to end the flight at any specific location. The plane flew south until fuel was exhausted. That is not consistent with any plan to sink the plane in some canyon.
@Andrew. From your post yesterday, “In your scenario, the APU is already running, so the ELMS will command the APU DC fuel pump to run as soon as there is no pressure in the left engine feed manifold. It won’t wait for the engine to drop below run speed.’ I see, thanks. So much for that theory!
But as per your paragraph “2.”, as distinct from pump supply to the APU, that to the left engine would be delayed in this way, i.e. until the left engine had dropped below run speed.
So more generally, in the auto-start cross-feed-closed case the APU DC fuel pump would need to refill the line to the engine and likewise fill and purge the engine fuel system to its nozzles before there was any possibility of ignition.
In your most useful paper on engine relight and APU auto-start you allow 20 secs from APU DC fuel pump start to light off, taken from simulations. Presumably that time includes the above recharging but does your 0.8 kg fuel consumption of the 13.6 kg of residual fuel available?
Your paper supposes the flow rate on which that is based will be that of engine consumption, 140 kg/hr. However I suspect its average would be higher: the APU delivery rate specified in the Aircraft Maintenance Manual 28-25-00 p.8 is 1430 kg/hr, at 24 psi. At that extreme, in those 20 secs an engine (or the two in the cross-valves-open instance, these having failed simultaneously) might consume something between the 0.8 kg (1.6 kg for 2) and the 1430/180 (8 kg) of the maximum pump delivery rate.
If so that would reduce the prospects of a relight and, were there no immediate light off, there would be the continuing higher flow of up to 24 kg/min, so the residual fuel remainder could drop much more quickly.
That in turn would reduce the prospect of a substantial fuel addition to the APU fuel line and also of any relight reaching much thrust before a repeat flame out from fuel exhaustion.
Also though, the 1430 kg/hr APU DC flow rate, much lower than the later engine fuel consumption rate examples in your paper, would reduce the maximum thrust of a relight of both your cases there, though also extending the time.
About that and the 7th arc log-on’s high rate of descent, of the timing of a particular airline simulation your paper concludes, “Further analysis is required, but perhaps the onset of the high and increasing rate of descent might be delayed if the engine restarted and then flamed out immediately after reaching the intermediate thrust setting. If that were the case, the timing of the SATCOM transmissions might fit the increasing rate of descent, however, it is not clear if the downward acceleration would also match that suggested by the DSTG.”
@Andrew. Please disregard my third last paragraph.
Hey did you guys see this yet? Remember the Chinese spy balloon & people were using HYSPLIT air current models to try to figure out where it came from? Well, some other people used an AI photo scanner (RAIC) to comb through massive amounts of satellite imagery and found actual images of the balloon and figured out it came from Hainan Island instead of somewhere in Xinjiang where a lot of people were speculating it originated from. From the article:
“Synthetaic’s founder, Corey Jaskolski, knew that the balloon would appear as several differently colored blobs in a satellite photo. He drew a sketch of what the balloon might look like and uploaded it to his company’s image analysis platform, RAIC, which stands for rapid automatic image categorization. RAIC helped him to identify objects that resembled his sketch in satellite imagery provided by Planet Labs and the European Space Agency.”
This sort of scanning technology has only been available for the last couple of years, but it could maybe be retroactively applied to old 2014 images?
https://www.nytimes.com/interactive/2023/03/20/science/chinese-space-balloon-incident.html?unlocked_article_code=HKb4V58O5r1KQ-rZsTYomITAdOKfJjDlkrXhY-ZJALDk4FneVn7FIfoSM9Lk3sbQhCf2iF5kHZnpmwXIS1Q37HqePyfT4UaKA-dlrmu7FnXfUN04yHG5U_HIqISOnZHGEABLxjFT0Bew9nVubC-sFuRaSSQZhqQDnJRkVmXEc-6Ip2O3UH5yXRDonuXS8QLeiuDh9WEq-ARtgpFqpMLvI0cUF8dKlDCRsuLiHfC_sAFDMl7UzPOKtXikkNUCoyG8BgrZe8MO7lal1X1_od4EZjXZVnzVhVemlWPm5lZBevIDGSulZCeJ2vuXdvUAImgC3E4I690LB51-0nGlfp0qWnLwNRVv9yKTGMKhIitCSU3yMrJP3ulRTks
Warren: This technology is very interesting, but the MH370 flight was in the dark for all or nearly all of the time. So how could it be used in the case of 370? I assume visible (not ir) images are required.
@David
You asked: “…you allow 20 secs from APU DC fuel pump start to light off, taken from simulations. Presumably that time includes the above recharging but does your 0.8 kg fuel consumption of the 13.6 kg of residual fuel available?”
No, it does not. I do not know how much fuel is required to ‘recharge’ the left engine feed manifold, etc after an engine flame-out caused by fuel exhaustion.
As I said previously, if the 30 lb of residual fuel reported by the ATSB is split between the APU fuel line and the left tank, there can’t be much fuel left in the tank. I recently estimated there would be about 12 lb of fuel in the APU fuel line, assuming an internal diameter of 15 mm and a length of 36.6 m.
That 12 lb would only leave about 18 lb, or 10 L of residual fuel in the tank. Some of that fuel would be fed to the APU and some to the engine. My view is there would not be sufficient fuel for a relight of the engine, especially if the aircraft attitude changed and the fuel level dropped below the APU fuel inlet. If a relight did occur, I think the engine would have flamed-out again almost immediately.
@Warren Platts
Earlier this week, I followed a conversation on Twitter and Synthetaic’s blog post on this topic for identifying the track of the Chinese balloon.
The key points I ‘took away’ is that the process would be reliant upon a rapid revisit cycle to a region of interest.
That revisit cycle is inherent in the Planet Lab LEO constellation (Planet states 5-7 overflights per day) but would require tasking of image acquistion over open, empty, ocean.
The target speed over the ground must be compatible with image acquisition tempo and the target’s altitude such that the R-G-B elements and/or other sensor bands represented in the imagery would not be correctly registered, hence, readily discriminated by the AI.
In 2014, there were no known EO satellite missions with the tempo or tasking that surveilled the eastern Indian Ocean as 9M-MRO remained airborne.
Aside from Planet Labs, the LEO SAR constellations such as Iceye and Capella provide an analogous source that has been demonstrated for maritime vessel tracking purposes.
One thing I realized after watching the documentary, is that the Malaysian government stated MH370 was tracked over the straits only after receiving the satellite data from Inmarsat, before that they were cautious to make any definitive statements about the flight path of the plane, can someone explain why ?
And since primary radar can’t identify an aircraft, how do they know it was flight 370
We know it was 370 from the 17:52 cell phone logon at Penang.
Mike R:
http://bit.ly/2DRZjo9
@All
For several reasons I have been hesitant to join any of the major MH370 blogs for the past few years. However, as I’m worried about the consensus towards S32 – S36 as the main focus latitude range, I decided to share some of my findings here. First of all the work Bobby was referring to:
https://www.dropbox.com/s/34f3zy9m8h1flc3/MH370%20Satcom%20data%20analysis%20combining%20explicit%20and%20implicit%20path%20generation.pdf?dl=0
The results of this analysis indeed seems to confirm the mentioned focus area. However, it comes with a warning. I’m not really happy about some aspects. It heavily relies on the assumed BFO error distribution, and that this is reasonably “well behaved”. This distribution is used in the first explicit path estimate step and works as a strong “pre-filter”. I’m now running a pure “implicit” path fit procedure (Monte Carlo style) and I see many good fits further south (after 5 million GC trials) which somehow I missed in the linked analysis. These then should be “cut-off” by fuel limits. So, I’m also working on a new way to couple ~18:30 UTC fuel estimates to (upper limits) of 19:41 UTC fuel available, which I will apply to all paths, and first results indicate that hard cut-off may well be south of S37.0.
For the Monte Carlo approach I might need some help with statistical analysis, as I’m not sufficiently experienced in this branch of mathematics for an in depth analysis. What I noticed so far is that for many paths there could possibly be an issue with the arc 5 BTO fit (impacting probabilities), and that this issue is less present for the GC paths ending further south. Note that the UGIB “best fit” path has an arc 5 BTOR of -63.0 microseconds, which is well beyond 2 sigma.
A first thought: there would be a 5% probability for any of the BTORs to be beyond 2 sigma, so as we’re looking at 5 of them (arc 2 – 6), a single BTOR beyond 2 sigma could occur in roughly 2-3 out of 10 realizations. So not really extraordinary. Nevertheless: It looks this would impact probabilities “far south” vs. “32.0 – 36.0”.
@MikeR
I would say historically Inmarsat *did* know it was 9M-MRO from the satellite transmission, and Arc1 is close match of apparent radar blip to Inmarsat arc.
@Niels, @all: looking back at the arc calculations recently, I realized that arcs 1-6 are probably off by 1-2 nm. When we received the MH371 Inmarsat data, Victor and I both worked to refine the BTO bias estimate. Ultimately we agreed that it should be nudged a bit based on the combination of 370 and 371 observations. At the time, I was focused on giving OI the best estimate we could for the 7th arc. But I dont recall ever going back and recalculating arcs 1-6 with the revised BTO bias value. Maybe Victor and others did that, but if not, maybe it’s worth reviewing. I emphasize the change was almost in the noise, but perhaps worth checking.
@Niels, @all: Well, after a little digging, I think my previous post should be ignored. Failing memory.
It was not the BTO bias (-495,679 usec) that changed after looking at all the MH371 and MH370 data together. It was the R600-R1200 correction that was adjusted slightly. That only affected the 7th arc, since the 00:19:29 and 00:19:37 arcs were not both R1200 data rates. From my notes, I think we concluded that the R600-R1200 correction was closer to 4583 usec, not 4600 usec (which was originally calculated based on a single logon observation set circa 16:00 on the ground as I recall). Anyway, I think all the other arcs are good except perhaps arc 1a, which might be off 1-2nm for the R600 observation.
Victor: Can you confirm or correct my recall on this?
The only correction I recall is the adjustment to the 7th arc, which was in the search recommendation post:
https://mh370.radiantphysics.com/2020/02/01/search-recommendation-for-mh370s-debris-field/
Here is what I wrote:
When the SDU logs onto the Inmarsat network, the SDU begins the log-on sequence by first transmitting a log-on request, which is followed some seconds later by transmitting a log-on acknowledge. For MH370, those were the final two transmissions, transmitted at 00:19:29 (BTO = 23,000 μs) and 00:19:37 (BTO = 49,660 μs), respectively. From past work [6,7], we also know that the BTO values for the log-on request and log-on acknowledge are “anomalous” in that the raw values are outliers that require a correction. Fortunately, the required corrections are repeatable, and can be determined by analyzing prior flights.
Using the Inmarsat transaction logs for MH371 and MH370 [8], the BTO log-on statistics from March 7, 2014, 00:51:00, to March 8, 2014, 16:00:00, were analyzed to determine what offsets might be applied to log-on requests and log-on acknowledges. There were 29 cases in which there was an R-channel burst just after the initial (R600) log-on request and subsequent (R1200) log-on acknowledge. Of those 29 cases, the number of packets in the burst was 3 for 20 bursts, 2 for 6 bursts, and 1 for 3 bursts. The average of each burst was used as the reference for the log-in request and log-on acknowledge. In 4 of the 29 cases, the correction for the log-on request was near zero, i.e., the BTO values were not anomalous, so only 25 cases were included for log-on request statistics.
For the log-on requests, the mean offset from the R-channel burst is 4,578 μs with a standard deviation of 94 μs. The maximum offset was 4,800 μs (+222 μs from the mean) and the minimum was 4,380 μs (-198 μs from the mean).
For the log-on acknowledge, we considered a correction of the form (a + N × W), where a is a constant, N is an integer, and W represents the delay per slot. We found that the standard deviation of the correction error (using the average of the R1200 burst as the reference) to be minimized for W = 7812.0 μs. That’s very close to the 7812.5 μs value suggested by the 128 Hz internal clock of the SDU. By forcing W=7812.5 μs, the mean error to the correction is 23 μs, and the standard deviation is 30 μs. The observed standard deviation is very close to the 29 μs that DSTG recommends to use for “normal” R1200 values [7]. The consistency of the standard deviation of the corrected anomalous values with the standard deviation of the values not requiring a correction is reassuring. The total correction to the BTO for log-on acknowledges is therefore (23 + N × 7812.5) μs.
Using these log-on corrections produces corrected BTO values at 00:19 equal to:
00:19:29: 23000 – 4578 = 18422 μs
00:19:37: 49660 – 23 – 4 × 7812.5 = 18387 μs
We combine these values to determine the BE value of BTO by using the inverse of the variance as weighting, yielding a BE value of BTO = 18,390 μs (σ = 29 μs). Using this BE value of BTO with the longitude of E93.7875° and an assumed geometric altitude of 20,000 ft results in a position of S34.2342° E93.7875° at 00:19:29, which we assign as the LEP.
@Andrew. “If a relight did occur, I think the engine would have flamed-out again almost immediately.” Yes even more likely with that recharge fuel now debited.
Also, irrespective of simulations I am unclear how long an engine would take to self-reprime, anyway, without manual air bleeding of fuel system components as common on fitment. Indeed, as distinct from a ‘normal’ flame out where this is unnecessary, it may not at all.
@Victor
Thanks for the detailed reminder. I forgot about the separate correction for the first R1200 BTO. Anyway, Arcs 2-6 are fine, and Arcs 1c-f are ok, but maybe it would be worthwhile to apply the refinded corrections to the 18:25:27 logon. Your thoughts?
@ALSM
Thank you, Mike. I’m mainly looking at arcs2-6 and using the values given by Inmarsat, which should still be ok.
The link below gives a histogram (no. paths vs. latitude) for the subset remaining of 5 million GC trials (air packs off) after applying the following “soft” selection criteria:
mean_BTOR < 16 microseconds, SD_N-1_BTOR < 45 microseconds, all BTOR < 87 microseconds and 19:41_weight < 201.5 tonnes. There are 1253 paths remaining.
https://www.dropbox.com/s/sd6ct4nf12fbx9m/Figure_allBTOR87_fuel201_5_sigma45_mean16.tif?dl=0
I'm currently checking if the distribution is influenced/biased by one of the initial boundary conditions used in the Monte Carlo simulation.
@airlandseaman: In the paths I fit in that timeframe, I typically combine the BTOs into three clusters with reduced error bars. So the first two BTO values are weighted by their respective inverse variances and the others are averaged (since the variances are equal). Remember that the first (log-on request) BTO value has σ = 94 μs, so its utility on its own is limited, and better combined with the second (log-on acknowledgement), which has σ = 30 μs, as I did above for the log-on at 00:19.
@airlandseaman @Don Thompson @Mick Gilbert @Victor
« All the raw data is in range and azimuth coordinates that exactly match with the KB and BU radars »
After comments and feedback on the data, and the geometrical analysis which was too quick, let’s assume that the data is from KB and BU.
Thus I « dove » and analysed the data. The time tags raise a serious concern thus they don’t allow computing local speeds other than averaged ones. Anyway as we know 3 key points (Exit of the U-Turn, Mobile Phone detection and Exit from radar coverage at 18h22) with the time, this exercise of estimated the local speed is of low importance 🙂
The revised document is here :
https://www.mh370-caption.net/wp-content/uploads/KB-BW-radar-data-discussion.pdf
« Why would anyone care about the IAS anyway? »
The IAS and Mach (TAS) are the only speeds that a pilot uses for flying, you know that. The ground speed is a just consequence. That is why the document is centred on these speeds to verify the « flyability » if I may say so. And the conclusions are clear from the analysis that at high altitude the Mach limit is not respected but it is respected at lower altitude. At FL384 the average Mach is .88 basically all the way long during the time the aircraft stayed in radar detection. This means that either the local speed stayed continuously at M.88 or not. In the later case, it means it went well above the flight envelope.
« We know the altitude at Kota Bharu was ~40,000 feet »
Nothing is casted in concrete like this sentence seems to say. The studies performed so far used the time tags as a sure thing but these tags are raise concerns as explained in our doc. In addition,the fact that at 40538ft True Height (FL384) the average Mach is always at M.88 in the two data sets does not support the error of +/-5kt. The error is claimed to be always +5kt and that the reading should be M.87. I don’t think this is statistically sustainable 🙂
« there is no evidence at all that the aircraft traversed the Malay Peninsula at FL300. »
In the contrary, the analysis shows clearly that at FL300 the Mach is around 0.85 and corresponding to the adequate ground speeds. In addition, FL300 can be justified by : 1) a level still acceptable for the ears because of depressurisation, 2) a good compromise for a speed staying below the amber/red speed ribbons 3) staying below usual traffic and 4) in view of the trajectory after FMT , FL300 at M.706 which shows the exact fuel consumption in time.
@all
We have updated our full trajectory analysis report.
We have included a recent comparison with Boeing trajectories analysis presented in their Appendix 1.6E of the SIR. Our findings are matching their estimation for the fuel and the range at TAS431kt.
https://www.mh370-caption.net/wp-content/uploads/3-known-trajectory-and-recalculated-trajectory.pdf
@airlandseaman
This trajectory should be included in your summary 🙂 You exclude long glidings with no solid reason. The long glidings are well described by Boeing specifications (Minimum drag glide or drift down glide) … so why ignoring them a priori ?
@Jean-Luc Marchand said: This means that either the local speed stayed continuously at M.88 or not. In the later case, it means it went well above the flight envelope.
Yes, Mmo is M0.87. But with the autothrottle disengaged, my estimate is that speeds a bit higher would be allowed before envelope protection raises the nose to reduce the speed. If envelope protection occurred exactly at M0.87, it would not be possible to cruise at that speed and maintain altitude, as effects such as mountain wave would cause speed variations that the autothrottle could not correct fast enough.
@Andrew, what is your opinion? Wouldn’t you expect overspeed protection to occur at speeds a bit higher than Mmo?
@Jean-Luc Marchand
Jean-Luc, I’m sure that Victor, Mike and Don will address your post more cogently but did you use the radar data to plot what the track would be using 30,000 feet as the target altitude?
Just using back of the napkin calculations, using a target altitude of 30,000 feet, the initial loss of contact at 17:36:43 UTC would have been at 6° 19′ 12″ N 102° 21′ 22″ E and 132 seconds later, the re-acquisition at 17:38:55 UTC would have been at 6° 8′ 27″ N 102° 2′ 37″ E, there or thereabouts.
That’s 21.5 nm in 132 seconds for a ground speed of 586 knots! Does that strike you as impossibly high?
@Victor
RE: “Wouldn’t you expect overspeed protection to occur at speeds a bit higher than Mmo?”
Yes, the Mach at which the overspeed protection activates is higher than Mmo. It is also higher than the Mach at which the overspeed warning activates. The regulations state that the maximum tolerance for the overspeed warning is MMO+0.01.
I don’t have numbers for the B777, but on Airbus aircraft, for example, the overspeed warning activates at MMO+0.006 and the overspeed protection activates at MMO+0.03.
@Mick Gilbert @Victor
« the initial loss of contact at 17:36:43 UTC would have been at 6° 19′ 12″ N 102° 21′ 22″ E and 132 seconds later, the re-acquisition at 17:38:55 UTC would have been at 6° 8′ 27″ N 102° 2′ 37″ E, there or thereabouts.
That’s 21.5 nm in 132 seconds for a ground speed of 586 knots! Does that strike you as impossibly high? »
Mick, you could not illustrate better my point with the post above. Several elements in my answer:
1) your coordinates appear to me at 23000ft True height (~FL220), my coordinates are 6° 18′ 35.9″ N 102° 21′ 03.1″ E. This gives ~20.5Nm. This gives 564Nm which is not good either.
2) we dont have the same timing also. I have 17h36:44.742 for example…
Most importantly
3) Please do read my paper where I explain that there exist several time tags depending of the source which show a clear question of confidence in them.
4) the next point is : who does really care about the CoS when the time tags are flawed (and especially in a so “unoperational” domain of the radar which is not meant for these altitudes so close to it)? what matters is speed that an aircraft can fly overall. So can we find this ?
5) To minimise the timing errors and measurement errors, to my view, the best low pass filter of the data is to consider two points only : the entry in the KB radar coverage and the Exit of this radar (at 17h30:34.977 and at 17h48:06.766). Doing so, we can see in our paper that at true height 40500ft the distance is 120.8Nm with a Mach at 0.88 (in average) which means MMO+0.1. According to Andrews, this would triggered the protection actions by the aircraft more than a few times during the crossing of the radar coverage. Below at true height 31500ft, the distance is 121.2Nm with an average Mach at 0.86 (MMO-0.2) which is well below the limit and ensure safe flight conditions… for the same timing at the same locations !
Oups ! Correction kt and not Nm…please read :
This gives 564kt which is not good either.
@Jean-Luc Marchand said: According to Andrews, this would triggered the protection actions by the aircraft more than a few times during the crossing of the radar coverage.
That’s wrong. Assuming the same Mach alarming and protection spacings above Mmo as the Airbus aircraft, there would be a warning (not a protective action) at M0.876 and envelope protection would begin at M0.90. So, there is absolutely nothing preventing a B777 from flying at M0.88 with the autothrottle disengaged.
But in any event, according to my calculations for the COS, at a standard altitude of 39,293 ft and a true altitude of 41,486 ft, the speed across the COS would be GS = 525 knots, corresponding to a TAS = 500 knots with a tailwind of 24 knots. The Mach number is M0.870 at OAT=218K, which equals Mmo.
All,
I have been revisiting the details of the search zone definition for Air France 447 from 2009 to 2011 to see if they might provide insights relevant to MH370. The documents that I found most relevant are as follows.
1. “Search Analysis for the Location of the AF447 Underwater Wreckage”
(Metron report from Jan 2011).
https://bea.aero/uploads/tx_elyextendttnews/metron.search.analysis.pdf
2. “Sea Search Operations”
Review of sea search operations after the wreckage had been located.
https://understandingaf447.com/extras/sea.search.ops.af447.05.11.2012.en.pdf
3. “Bayes Search for Missing Aircraft” (Larry Stone)
Includes a discussion of MH370
https://www.nps.edu/documents/103424533/106018074/
Bayes+Search+for+Missing+Aircraft+NPS+20+Apr+2017.pdf
Video: http://faculty.nps.edu/gsois/OR%20Video/Stone_4-20-17.mp4
There are several other pubications of interest as well. The Larry Stone article and video were discussed here previously back in 2017 (I think).
Some observations:
1. In the methodology used by Metron, when constructing an initial search zone, the “prior” for the search zone was formed by combining different probability distribution functions (PDFs) as a weighted sum, not a product. In practice what they did was to combine a flight dynamics map and a reverse drift map to get an initial prior, then multiplied by the aerial search map weighted at 30% to get a new prior for combining with the underwater search.
2. The initial aerial search for AF447 floating debris turned out to be useless, even though at least 5 different flights passed close to the likely track of the debris and should have detected it. The first positive identification of debris was made by ships 5 days after the crash. This identification was made ~38 nm north of the Last Known Position (LKP). Debris was recovered for another ~11 days.
3. Three sets of reverse drift models were made. They also ended up being essentially useless, even though a few individual predictions later proved to be close to the Point of Impact (POI). The second set of models, which defined a 95% confidence zone, missed the actual POI by ~15 nm to the NW but were given high credibility and probably delayed the search by a year.
4. Satellite images were examined, but they also proved to be useless.
5. The three ELTs onboard AF447 proved to be useless.
6. The ULBs attached to the black boxes proved to be useless, even though it was though highly likely that they would have survived the crash. Only one was later recovered, and it did not function properly when tested. A purported detection of a ULB signal triggered an underwater search, but it turned out to be spurious.
7. The most accurate predictor of the POI was the BEA/MAK study of upset accidents, which found that the POI was generally close to the point of loss of control and no more than 20 nm distant. This study was presented after Phase 1 and Phase 2 searches had been completed but appears not to have been used for Phase 3. It was first used in the Metron report. It should be noted that the loss of control, beginning with the plugging of the pitot tubes, started at 02:10:05, 29 seconds before the ACARS broadcast of the LKP. Thus, the distance from the onset of loss of control to the POI was about 10 nm. The use of the LKP as the center of the probability map was reasonable.
8. The final discovery of the underwater wreckage was helped by the fact that it was located on a relatively flat plain, whereas most of the surrounding seafloor is rough terrain.
Predictably, one link was messed up:
https://www.nps.edu/documents/103424533/106018074/Bayes+Search+for+Missing+Aircraft+NPS+20+Apr+2017.pdf
@sk999: In your opinion, what are the lessons learned as applied to the search for MH370?
Reply comments to Jean-Luc Marchand – CAPTION:
1. “The time tags raise a serious concern thus they don’t allow computing local speeds…”. This is not true. The KB and BU Civil PSR data is time tagged approximately every 4 seconds. (The KB antenna rotation speed was 3.814 seconds). As I stated in my April 23, 2018 Paper (http://bit.ly/2QExcw1):
“The original data contained time stamps believed to be produced by SASS-C software. This software reads the raw ASTERIX data from the radar head and logs that data asynchronously using a nominal 4 second clock. But the radar antenna rotation speed is slightly different, measured at 3.814 seconds. Thus, the observations in the SASS-C file were mapped back to the original radar time base, adjusted for azimuth angle changes. Changes in azimuth add to the target observation time a “phase correction” of 3.814*(az/360) seconds. These radar target times were then substituted for the original SASS-C Time stamps. This substantially reduced the observation time “noise” observed in the original analysis, but not the fundamental results reported on April 13, 2018.” So the time stamp issue with the original April 2018 KB and BU data was resolved 5 years ago, and I published the revised data.
2. Regarding the altitude at KB: The original KB and BU data sets I received from Malaysian friends in April 2018 were found to contain signs of data processing (filtering and “coasting”) that had no significant effect at longer distances from the radar head, but which caused some error in the altitude reconstruction for ranges close to the COS. In the paper cited above, the original April 2018 data was used. Thus, the altitude estimates were a few thousand feet higher than what we ultimately determined using the second set of files obtained in January 2019. The January 2019 files contained the raw radar head data (UTC time, rho and theta…no filtering or “coasting”). Using this data, we were able to eliminate the track error near the COS. A paper published in March 2019 reported on the revised KB altitude estimates. (http://bit.ly/2tTSps4)
3. In another paper from March 2019 (https://bit.ly/37HY8W5), I used azimuth smoothing to greatly reduce the speed noise in the data. Paul Smithson was first to note that the noise in the Jan 2019 data was dominated by the noise in the azimuth variable, not range. By fitting the (slowly varying) azimuth data to a 6th order polynomial and resampling, the noise level was substantially reduced as shown in this paper. Between 17:31 and 17:38, the noise is < 1%. Of course, it remains higher after passing KB due to the hot jet exhaust.
Victor asked “In your opinion, what are the lessons learned as applied to the search for MH370?”
I have no “lessons learned” to offer other than that I am skeptical that either reverse drift modeling or aerial search results can be trusted to locate the wreckage of MH370 with any precision, given that they failed to do so for AF447.
As an aside, it can be noted that the maximum distance that AF447 was estimated to have flown (40 nm) beyond the LKP was determined by its failure to transmit an expected ACARS message, similar to how MH370 failed to transmit the IFE startup sequence. (The missed message was not a subsequent position report, as is implied by multiple sources, but rather was a maintenance message.)
@sk999,
Thank you for reminding us that the AF447 aerial search now appears to have been somewhat ineffective.
Could the same have occurred for MH370?
Including (or not) the MH370 aerial search probability has a profound effect on search area recommendations. Indeed, the latitude range from 33S to 30S must be allowed (and searched) if one excludes the aerial search probability presented by CSIRO. So, the search area roughly doubles along the arc if one ignores the MH370 aerial search altogether.
I know from personal experience how difficult (and tiring) it can be to visually scan the sea surface for small floating debris for long periods of time. It would not surprise me if the probability of a visual sighting given the aircraft passed near a floating object was lower than one might guess. Of course, there were many floating debris generated by the crash, so one must look at the probability of sighting the floating debris field, not every object. That depends on how many floating debris were assumed to be visually detectable, how far apart they are, how accurately they are predicted to drift since the crash date, etc.
The reliability of the aerial search probability is a key factor in predicting the MH370 crash location. If one can confirm its reliability, then you cut the predicted crash zone area in half.
The area 30S-33S HAS been searched. Why this willingness to disregard the null result of a thorough seabed search?
@Paul Smithson: Can you define “thorough”? What do you think the probability is that parts of MH370 were not missed or not properly classified? What is your basis for assigning the probability?
@Paul Smithson,
In addition to Victor’s comments, none of Arc 7 has been searched out to the maximum glide range.
@Victor, Dr B. My point is that priority areas are being discussed as if there had been no search at all.
There must, of course, be a finite probability that the wreckage was missed – due to data holiday, misclassification or long glide. All, I think we can agree, are very low probability conditions – though we might quibble over whether their combined probability amounts to more or less than 5%.
If we are so convinced that a certain latitude bracket must contain the wreckage, it leads us to supposed that the aircraft MUST be there and therefore MUST have been missed. If, in doing so, we do not acknowledge that
the latter is highly unlikely, then we fall into trap of confirmation bias.
@Paul Smithson: About as “unlikely” that the San Juan submarine was missed the first time.
If the MH370 crash was as far south as you suggest, it means our fuel flow models are wrong by several percent. That’s possible, but unlikely. Basically, you believe the fuel flow model error is more likely than the possibility of missed debris or a glide beyond the search area.
We are trying to assign relative probabilities based on the facts at hand. I wouldn’t call that confirmation bias.
My comment was not posed as a binary choice between Paul’s preferred path and anywhere within the length of the 7th arc that has been searched.
But since you want to juxtapose them and talk about relative probabilities, I draw your attention to the residual probabilities section, figure 11, p20 of the First Principles report.
https://web.archive.org/web/20161230113201/https://www.atsb.gov.au/media/5772107/ae2014054_final-first-principles-report.pdf
For what it’s worth, I don’t suppose that Boeing’s fuel flow tables are in error by several percentage points, but that there is a flawed assumption nestled elsewhere in our fuel endurance inference.
@DrB
Does max glide range allow for flaperon trailing edge being water impact vs. flutter? If so the numbers of debris are potentially less, re: air visual search.
@Paul Smithson: I am aware of the missed probabilities that the searchers believe should be assigned. When searching for AF447, there were assigned probabilities for the failure of both underwater locator beacons (ULBs) that delayed scanning the correct area. And the San Juan was only found after localization from the acoustics analysis led to the re-scanning of an area that was previously judged to be clear.
My point is we really don’t know the relative probabilities of missed debris versus long glide versus a crossing of the 7th arc further south or north.
@Victor,
Here is a somewhat more detailed description of the ARA San Juan events. It is useful to understand those events because some may have relevance to MH370.
The ARA San Juan wreckage was initially detected in the normal scan process. However, it was misclassified as a geological feature. Apparently coming up empty, OI left the area. Then, in a surprise and unannounced move, OI returned to the search area and specifically to that spot, making passes from a direction that allowed them to get closer without risk of the AUV impacting terrain. The higher-resolution scans made it immediately obvious the feature was not geological but was the shredded submarine.
It seems the data review process continued after OI left the search area, and possibly somebody made a successful plea to revisit at least one (and possibly more) previous detections to obtain more reliable classifications.
@TBill,
You said: “Does max glide range allow for flaperon trailing edge being water impact vs. flutter? If so the numbers of debris are potentially less, re: air visual search.”
Regarding your first question, I don’t think that can be known definitively. For instance, an active pilot could glide a long distance, and then pitch the aircraft to enter the water at a steep angle. So, I don’t equate a long glide with a ditching attempt.
I am doubtful a piloted glide occurred, primarily because there is not enough fuel to reach 34-36S unless the air packs were off. If the air packs were off, there could be no active pilot at MEFE.
I think flutter damage to the flaperon trailing edge due to overspeed in an uncontrolled descent is the most likely scenario, but this has not been definitively proved.
It’s too bad the aerial search more or less stopped near 33S. I have wondered why that occurred. I recall that Boeing did define some bounds on the 7th Arc based on available fuel. I am sure Boeing allowed a fuel-efficient cruise (probably MRC or LRC), but I have not been able to determine if they allowed the possibility that the air packs were off after 19:41. If they had allowed that possibility, then 35S would have been reachable. Would making that assumption have affected the aerial search zone, pushing the southern boundary from 33S to 35S?
In my opinion, the recovered MH370 debris are only compatible with a disintegration of the aircraft upon impact. The few large pieces of flight control surfaces could have come off before impact. Everything else found to date is small fragments.
So, my guess is that the reasons the aerial search was unsuccessful are more likely to be (a) the chosen search area did not include the POI and/or (b) the actual probability of visual detection was much lower than estimated. I doubt it was because there was a very small number of floating debris.
@Paul Smithson
You said: “For what it’s worth, I don’t suppose that Boeing’s fuel flow tables are in error by several percentage points, but that there is a flawed assumption nestled elsewhere in our fuel endurance inference.”
If that is true, then Boeing’s predictions are off by twice that error.
The UGIB fuel model has withstood scrutiny, so far, with no significant errors being identified. In addition, the UGIB fuel model allows routes ending noticeably farther south than any prediction I can recall from Boeing. The reason for that is solely that we allowed the air packs to be turned off for most of the post-19:41. So, if UGIB’s MEFE predictions are wrong in disallowing far-south POIs, Boeing’s predictions are wrong by an even greater error. That seems highly unlikely to me.
@DrB: I did write an article on the search for the San Juan and the implications on the search for MH370:
https://mh370.radiantphysics.com/2018/11/17/ocean-infinity-finds-argentine-submarine-after-not-finding-mh370/
@Victor – thanks for re-sharing the earlier article on San Juan, which includes your recap of ATSB’s aggregate probability (94%) to detect MH370 in the 120000sq km searched. That roughly corresponds with the 2-sigma cut-off that statisticians are fond of and (in my lexicon) “highly unlikely” that the wreckage is to be found within the area searched to date.
@DrB
Thank you. You make a good history point I had not been keenly aware of “the aerial search more or less stopped near 33s.” However, I currently feel perhaps MH370 is so far from Arc7 that the debris might have missed for that reason. Also other evidence (or lack thereof) such as acoustic sounds based on Arc7 location at 00:19, both crash time and Arc7 location I personally question at this point. I have no problem whatsoever with Arc7 accuracy/physics, just not end of flight for me right now.
@DrB. From your response to TBill, “I am doubtful a piloted glide occurred, primarily because there is not enough fuel to reach 34-36S unless the air packs were off. If the air packs were off, there could be no active pilot at MEFE.”
If he closed the outflow valves and shut off bleed air at around the 18:25 log-on when pressurised, then topped that up from time to time he could both save on fuel and preclude decompression sickness.
Still very cold though seat and foot heating might help a little as would the top ups.
Also switching off the ventilation fans would save on electricity were range such a priority.
If in poor shape at the end he might ‘lose’ the aircraft for a while, explaining the plunge.
A possibility perhaps.
Given the full context of what we know, it is more likely that the plane was depressurized at the IGARI turn when the transponder was turned off. It was probably repressurized when the L Main AC Bus was was repowered circa 18:23.
I wouldn’t say “probably” but that course of events seems a sensible working hypothesis.
Paul:
Based on the evidence we have in hand, I think it is virtually certain the plane was depressurized circa 17:21. I think it is likely the plane was repressurized circa 18:23. If it was repressurized then or soon thereafter, the PF could have flown it to the end. If not, then it is more likely the PF was incapacitated or dead prior to the 00:19 steep descent. This has implications for the fuel model.
@David,
I have not tried to model the fuel savings of your suggested scenario, wherein the plane was periodically pressurized with the outflow valves being fully closed, followed by the cabin air pressure slowly dropping due to leakage. The inherent uncertainty of my fuel model is sufficiently large that this intermediate case of intermittent air packs on/off is not reliably detectable.
From a motivational point of view, It seems unlikely to me that a PIC would do that. There are other, easier ways to save similar amounts of fuel. For instance, why not fly at MRC speed rather than LRC after 19:41? That would increase the post-19:41 range by 1.0%. In addition, why fly the first hour after diversion at M0.84/MMO? That costs 4% in fuel flow (for an hour) compared to MRC, so clearly the priority then was speed, not range. In my opinion, these two examples demonstrate that achieving a per cent or two in additional range was not an overriding factor at any time during the flight. This implies that turning the air packs off was also not driven by a desire to achieve a few additional miles of range at MEFE.
The entire savings with the bleed air off is only 1.2% at cruise altitude. So, I don’t see extending the range by about 1.2% as a primary motivation for depressurizing the aircraft (either immediately after diversion or later in the flight). There is an obvious motivation for depressurizing early (circa 17:26) – to disable everyone else on board and prevent their interfering with completion of the diversion plan. Possibly there was an additional purpose – for the PIC to commit suicide (by oxygen starvation) once the southbound course was set in the FMC. The PIC could have set the remainder of the course (waypoints, flight level, and speed setting) as early as 18:28 or as late as 19:41.
@airlandseaman,
It is unclear to me whether or not the aircraft was ever re-pressurized, even briefly, after 18:28. The fuel model can discern the air packs being off for 4-5 hours, but not for one hour. In the UGIB (2020) FMT scenario, the aircraft is at FL100 from 18:44 to 19:24, during which time the aircraft would be reasonably pressurized with the air packs off (and even with the outflow valves remaining open), and supplemental oxygen might be desirable but not required for a PIC to function. So, the fuel modeling does not require the air packs to be turned on at any time after 17:26 (nor does anything else), and it indicates the likelihood of the air packs being off for at least 4-5 hours after 17:26.
Therefore, it is possible the aircraft was depressurized near IGARI and was never re-pressurized. There is no necessity for a re-pressurization circa 18:28 to match any available data. In fact, the predicted MEFE time is best matched if the air packs were off the whole time from 17:26 to MEFE.
@all,
Speaking earlier of MRC after 19:41, I wondered why, in hindsight, ATSB identified in 2015 an indicative search area extending down to 39.2S, if now I think there is not enough fuel to reach that spot. Looking at the ATSB report dated December 2015, they reasonably used a very conservative Boeing prediction of maximum range. In that calculation, Boeing made some assumptions which allowed greater range, including the following:
1. FMT at 18:28 with no turns thereafter,
2. MRC,
3. wind modeling (but not temperature, which ignores a 2% penalty for +10C), and
4. ideal step climbs.
Note that turning the air packs off is not on Boeing’s list. Item 2 adds 1% to post-18:28 range, but it turns out that MRC is generally a noticeably worse match to the SATCOM data than LRC. Item 3 (ignoring high air temperature) adds 2% to actual achievable range. Items 1 and 4 add at least 1% together. So, the conservative Boeing estimate of maximum range may be optimistic by 4% or more (not considering bleed air savings). In addition, there was no fuel modeling of individual DSTG routes, so far-south routes requiring higher speed were accepted by DSTG without any range penalty being applied to account for the necessarily higher fuel flow. Five years later, in UGIB (2020), we did the fuel flow calculations for every route to eliminate routes which were not feasible with the available fuel.
All differences in the UGIB (2020) range predictions and the Boeing range predictions are dominated by differences in the assumed speed, flight level, air temperature, and air packs state, not to any real differences in the fuel flows for a given scenario (I believe those minor differences are typically a fraction of 1% because we matched the Boeing fuel flow tables very precisely).
@DrB: Looking only at range and neglecting what speeds satisfy the BTO constraints, a 10K increase in temperature from ISA results in a 3% increase in fuel flow rate, but the true airspeed (at the same Mach number) increases by around 2.3% (at the tropopause, [227/217]^0.5 – 1 = 2.3%). So the loss in range is around 0.7%.
@Victor Iannello,
To be precise, my fuel model predicts a 3.35% increase in FF per +10C (the Boeing table footnote is rounded off to 3%), and a 2.3% increase in speed, so the fuel mileage is reduced by 1.0% by +10C air temperature above ISAT. So, it’s a 1% range loss rather than the 2% I mentioned above. The conclusion is unchanged, that the Boeing-predicted maximum range was higher (by about 3% or more) than what 9M-MRO could achieve that night while matching the SATCOM and GDAS data.
I’m not being critical of what Boeing or DSTG did back in 2015. Both were quite reasonable for that time. Since then, our understanding has improved, and today I would assert the southern half of the “indicative search area” is not reachable while maintaining consistency with SATCOM/GDAS.
@DrB said: Since then, our understanding has improved, and today I would assert the southern half of the “indicative search area” is not reachable while maintaining consistency with SATCOM/GDAS.
I agree that it’s unlikely.
Regarding fuel limits:
To estimate the influence of available fuel on 00:19 UTC latitudes that can be reached, I developed a procedure to estimate the upper limit of available fuel for 19:41 UTC latitudes in the range of S2 to N6 deg. This upper limit is based on an assumed early FMT at 18:30 UTC with the position and weight consistent with the UGIB paper (and kindly provided by @DrB). For the estimate, each possible 19:41 UTC position is connected to the FMT position through a CTT path in holding configuration, with the flight level optimized between 100 and 400 to match the particular distance traveled in 1h11m. This way a 2D function is constructed which gives the 19:41 weight as a function of 19:41 lat and lon.
This then is combined with a set of 5 million randomly generated paths, of which a fraction is compatible with the measured BTOs. Each of the 5 million generated paths has the 19:41 lat and lon, as well as the 19:41 UTC weight (consistent with 00:17:30 fuel exhaustion) recorded, implying the connection with the pre-19:41 fuel model is easily made.
Here are the first results, based on a set of 5 million great circle paths with ac packs assumed being switched off after 19:41 UTC:
https://www.dropbox.com/s/b0yipiehyxyvmyu/April2023_Fuel_Limits.pdf?dl=0
@DrB, Paul Smithson. Thanks.
Yes a rationale would be needed for such a priority choice just for then.
Somewhat similar is the choice to select air packs off when depressurising. Just opening the outflow valves, fully if necessary, would do: potential outflow rate greatly exceeds that of pack inflow, particularly at altitude.
Presumably an experienced pilot would be awake to this.
He might contemplate that leaving the packs on could delay alerting those in the cabin, or at least confuse them; and, later, would keep the interior equipment closer to normal operating conditions.
Fuel – Another Perspective
This first link below (F4) shows a Fuel On Board comparison from two trials subject of the UGIB Report, or Paper, of March 2020.
The “Start” Point: referred on the Chart is at UTC 19:22:42 on 7th March 2014 and basically at the latitude of Aviation Waypoint “BEDAX”. The two trials slightly differed in the corresponding longitude, as discussed in the UGIB Report. (Trial #854 was tweaked to pass approximately through “BEDAX” whereas Trial #815 passed closely by.)
The data for Trial #854 was also otherwise tweaked, or adjusted from, the earlier Trial #815 due to an apparently improving understanding of the situation as the analysis progressed. One of those adjustments was to consider the air bleed OFF for Trial #854 whereas for Trial #815 air bleed had been considered ON. (This is although the relevant text field of Figure 35 of the UGIB Report – for Trial #854 – had confusingly not been updated.)
The Chart (F4) shows the comparison of the fuel remaining on board between the two Trials at the start of the straight south flight concluded by the Authors UGIB.
For Trial #854 a slight adjustment upwards, by 0.1 tonne, has been indicated and this is explained below.
The chart presumes that both trials will reach Arc 6 and subsequent fuel exhaustion at approximately the same time. The deliberate adjustment of 0.1 tonne has been made to ensure this.
For both trials the Leg Average Ground Speed in the region between the “Start” Point and the UTC time of 19:41:03 for Arc2 is within 1 knot of 480 knots and within 0.3 knots of each other.
Please Note that the two trials shown on Chart F4 are very close to five (5) minutes of each other.
Five minutes at 480 knots equates to 40 nautical miles.
__________________________________________
The “Final Major Turn” took approximately one hour prior to the “Start” Point for the two discussed UGIB trials.
The straight south flight concluded by the Authors UGIB took virtually four and one half hours.
If the possible fuel usage comparison during the FMT without and without air bleed was proportionate to that as described above for the straight south flight, then another 9 nautical miles might be added to the possible range achievable with bleed off compared to that with bleed on.
__________________________________________
The second link below (F3) shows the final fuel burning end of the two trials.
This will help to explain why an adjustment of 0.1 tonne has been added to Trial #854 for the above observations. The adjustment is to get both trials to approximately the same time estimate for fuel exhaustion. No attempt has been made to consider the fuel situation following the first engine flame out very soon after Arc6.
https://www.dropbox.com/s/1pjuq44d9mui7ed/F4.pdf?dl=0
https://www.dropbox.com/s/dx3ju8s52j73fqp/F3.pdf?dl=0
@sk999
@DrB
The above discussion concerning fuel has been a slight diversion to a slow progressive, often interrupted, consideration of the Spheres of Uncertainty around the possible end to the powered flight of Flight MH370.
It follows the presentation of a new report by sk999 via comment #34701 on March 21, 2023 at 2:30 pm, and also subsequent reply from DrB on March 22, 2023 at 2:02 pm.
In particular, I started out to review the sensitivity studies in Appendix G of the UGIB Report, but this developed into a much more comprehensive review. For example I am am beginning to wonder if some of the statistics used by the Authors UGIB are superfluous. I’m attempting to put that concern mathematically, or alternately, graphically.
Note that one conclusion has been that it may not make much difference.
For example, see the linked attachment, BvA, an extract from one file.
And that particular relationship may not be one of the possibly superfluous.
As a tool, I have made comparisons between Trials 815 and 854 of the UGIB Report, the linked extract being one example.
Steve, I made a chart of your Table 3. Linked as “Chi-Sq Bins”.
https://www.dropbox.com/s/ld668h3cz5ffwm6/BvA.pdf?dl=0
https://www.dropbox.com/s/g3ih26b39og6qtp/Chi-Sq%20Bins.pdf?dl=0
@Victor,
Would you kindly please amend my faux pas “the UTC time of 19:41:03 for Arc1” to correctly refer to Arc2.
Ta, in advance.
@George G,
In your example comparison (“BvA”) of BTOR versus Along Track Position Error (ATPE) from UGIB, the examples you showed are for routes that are high probabilities overall. Thus it is expected that there would be no correlation (i.e., no slope in your plot). This matches expectations for the true route. It is also obvious that an ill-fitting route with errors in ground speed can show a considerable slope with a significant correlation coefficient. Such routes would have a lower probability. This particular parameter is an effective contributor to the overall probability, because it tests the consistency with GDAS winds and air temperature along the route.
Not all the statistics are as useful. I suspect there are several whose contributions are small. I chose the statistics to be combined in the overall probability estimator based on a theoretical assessment. In addition, even if several of the statistics are not significant discriminators with the limited data we have to assess, including them should not introduce a bias, and computing them is not time consuming.
@Niels,
In your comment above, you said: “This then is combined with a set of 5 million randomly generated paths, of which a fraction is compatible with the measured BTOs.”
What do you mean by “compatible”? Are you using mean BTOR, standard deviation of BTOR, and/or RMS of BTOR to assess consistency with expectations?
You did not mention BFOs. Does that mean your plots of accessible latitudes do not consider the BFOs at all?
If so, then it appears you are generating a fuel probability which is conditional on the route matching some of the BTOR statistics, but none of the BFOR statistics.
So, your result is not a pure fuel probability (of reaching Arc 7). It is a conditional probability, but a different conditional one that I used in UGIB. The “fuel probability” in UGIB is the probability of matching the MEFE time for each of the best-fit routes which intersect Arc 7 at closely spaced intervals (set by varying the initial bearing). Therefore, what really counts in the UGIB method is the product of the “route probability” (which is the probability of matching all the SATCOM/GDAS data) and the “fuel probability”. That product tells you the maximum likelihood that a route ending at a certain latitude on Arc 7 ran out of fuel at the right time and was consistent with all the SATCOM/GDAS data.
What you are doing is different because it is the probability that a given route runs out of fuel at the right time and is consistent with part of the SATCOM/GDAS data (all but the BFOs).
So, one should not interpret your current probability distributions as indicating routes which are fully compatible with SATCOM/GDAS, if indeed BFO is ignored in your plots. In that case, your distributions must be multiplied by the probability that the BFORs match the expected BFOR statistics, in order to assess which range of POI latitudes are possible MH370 crash locations.
@DrB @David @Victor
In my view, part of the reason UGIB hits Arc7 at 34s is taking extra loiter before Arc2. The extra loiter (about 7 mins or so) is necessary to allow the LNAV flight path to hit Arc7 at the correct time.
By the way, I don’t think I see too much difference in UGIB for packs on/off, both seem to end about the same point on Arc7. Also at FL400, there seems to be much less ISA temp correction from standard conditions.
My vision- fuel savings very important. Less loiter, intermittent bleed air to hold pressure makes sense depending on how well the pressure would hold, MRC or CI52, descent before Arc6 which saves yet more fuel, If we go with Boeing’s numbers for MRC at FL400, believe it is possible to hit Arc7 in the 31-32 region with quite a few extra miles to fly, though descent means the period flying after Arc7 is much less fuel-efficient, but add some glide miles in there.
I am trying very hard to not bias a particular route based on conjecture about intent, but the prospect of the pilot intermittently cycling the packs to conserve fuel while maintaining cabin pressurization seems a bit fanciful, other than it allows modelers to meet fuel constraints, BTO/BFO constraints, and a glide after fuel exhaustion with a POI further from the 7th arc.
@George G,
You said: “If the possible fuel usage comparison during the FMT without and without air bleed was proportionate to that as described above for the straight south flight, then another 9 nautical miles might be added to the possible range achievable with bleed off compared to that with bleed on.”
It’s actually about 69 NM. The nominal FL390 LRC fuel flow with 1.5% PDA, +10C, and air packs ON is 5,802 kg/hr = 96.7 kg/minute at an average post-19:41 aircraft weight = 188 tonnes. TAS is 493 kts, and the fuel mileage is 85.0 NM/tonne.
The average FF with air packs OFF is 5,624 kg/hr and the fuel mileage is 87.7 NM/tonne. Thus, the relative fuel mileage is 87.7/85.0 = 1.031, so the same fuel can last 3.1% longer (or fly 3.1% farther) before MEFE. 3.1% of 4.5 hours is 8.4 minutes of additional powered flight time, or 69 NM at 493 TAS.
The amount of fuel saved over 4.5 hours by turning the air packs off (assuming everything else is identical, which is not the case for Trials 815 and 854) is roughly (5,802 – 5,624) X 4.5 = 800 kg.
@TBill,
You said: “In my view, part of the reason UGIB hits Arc7 at 34s is taking extra loiter before Arc2. The extra loiter (about 7 mins or so) is necessary to allow the LNAV flight path to hit Arc7 at the correct time.”
That is like putting the cart in front of the horse. The route fits we did in UGIB began at 19:41 and there was no constraint on them regarding how (or even if) they might be connected to the 18:22 position.
So, our FMT route was concocted after the route fits were done to demonstrate that a connecting route was feasible and provided sufficient fuel at 19:41. The correct way to view this is that it is necessary for a reduction in average effective speed between 18:22 and 19:41 in order to make a connection between those two locations. We found you either have to fly a holding pattern or fly at a reduced speed during that interval to make that connection.
You also said: “By the way, I don’t think I see too much difference in UGIB for packs on/off, both seem to end about the same point on Arc7.”
Of course. Air packs On versus OFF primarily just increases the required fuel at 19:41. There are very minor second-order effects because the slightly different weight very slightly changes the speed and fuel flow. Ignoring that very slight speed difference, the best-fit route is the same. The only significant difference is how much fuel you need to have on board at 19:41.
@DrB
Thank you for your feedback. It is work in progress and indeed only “mild” BTOR based path rejection has been applied for now.
You said:
“What you are doing is different because it is the probability that a given route runs out of fuel at the right time and is consistent with part of the SATCOM/GDAS data (all but the BFOs).
So, one should not interpret your current probability distributions as indicating routes which are fully compatible with SATCOM/GDAS, if indeed BFO is ignored in your plots. In that case, your distributions must be multiplied by the probability that the BFORs match the expected BFOR statistics, in order to assess which range of POI latitudes are possible MH370 crash locations.”
In principle I agree with this. The histograms I shared are not meant to represent probabilities for 00:19 latitudes; I shared those primarily to illustrate that my approach shows some impact of available fuel on the southern limit of possible 7th arc latitudes, and that first results indicate that the apparent “cut-off” by fuel limits could well be south of S36.0, at least through the 19:41 fuel estimates that I’m proposing. To properly combine all generated data and conclude in the form of meaningful probability distributions will take at least another one or two months.
I’m even not sure at this moment that I can define something like a “fuel probability”. There are many uncertainties for the 18:28 – 19:41 interval, so assumptions needed. I might as well only use the estimate for upper limit of available fuel at 19:41 to reject paths, and then apply proper (BTO/BFO) statistics to the set of remaining paths. For the BTORs that should be doable.
Defining “the probability that the BFORs match the expected BFOR statistics” is less straightforward. Besides the fundamental question if a stationary probability distribution can be defined (thinking about drift in the ref oscillator frequency), I’m careful to apply statistics derived from data collected under standard conditions to this special case, where for example there could be significant deviations in cabin temperature as compared to normal flights. In relation to BFOR statistics it would actually be helpful to have the data sheet for the OCXO present in 9M-MRO SATCOM/SDU.
Vietnam has called for the removal of misinformation from the Netflix movie on MH370.
It’s not surprising that Vietnam is upset considering the movie lent credibility to the crazy assertion that the aircraft was downed in the South China Sea.
@Dr B, ISA delta +10 at FL390? I don’t think so…
@DrB
You write:
“The amount of fuel saved over 4.5 hours by turning the air packs off …. = 800 kg.”
Repeated in full:
“The amount of fuel saved over 4.5 hours by turning the air packs off (assuming everything else is identical, which is not the case for Trials 815 and 854) is roughly (5,802 – 5,624) X 4.5 = 800 kg.”
Concerning the part which reads:
“assuming everything else is identical, which is not the case for Trials 815 and 854”
What other differences between the two Trials for which data is tabled in the UGIB Report. would significantly affect estimated fuel flow ?
Figure 35 of the report gives an updated estimate of Geometric Altitude for Trial 854, but the tabled Flight Level is unchanged at FL390. If at the same Flight Level then this means the same ambient pressure conditions.
Tabled SAT and deltaSAT are the same for Figure 35 as those for Figure 16 for Trial 851.
Tabled Mach and TAS values have minor differences, no more than 0.1 knot.
Wind speed and direction for all relevant 5 Arc crossings only have minor differences, as evidenced by the no more than 0.1 knot TAS difference.
(The only tabled wind data which differs significantly between the two Trials is for the estimated average over Leg 4 between Arc crossings 4 and 5, during which leg the wind direction changed from easterly to westerly in the region of 17 to 18 degrees South, and wind strength subsequently increased.)
Again, repeating, you wrote:
“The amount of fuel saved over 4.5 hours by turning the air packs off = 800 kg.”
Please see the attached (linked) Chart, Fd.
https://www.dropbox.com/s/d6ajyt8ln7bfh67/Fd.pdf?dl=0
If we were to use the UGIB Report data, as presented in the report, then the difference between the Two Trials 854 and 815 over the time period between crossing Arc Number 2 and fuel exhaustion is between 470 to 480 kg.
The actual “number” derivable as below is 474 but, of course, this is a number only.
The result obtained of 470 to 480 kg is significantly different to your estimate of 800 kg.
The number has been derived as follows:
Trial #815 Fuel On Board at 19:41:03 is tabled as: 201.654 tonnes;
Trial #854 Fuel On Board at 19:41:03 is tabled as: 201.080 tonnes;
The difference: 0.574 tonnes.
And a deliberate adjustment of 0.1 tonne has been made to ensure that both trials will reach Arc 6 and subsequent fuel exhaustion at approximately the same time. This adjustment was explained in my previous comment on April 7, 2023 at 2:40 am, and via Chart F3.
By looking at Chart Fd and /or the previous Chart F3 it can be seen that some adjustment to the tabled data was necessary to achieve the aim of reaching Arc 6 and subsequent fuel exhaustion at approximately the same time.
I chose a rounded value of 0.1 tonne.
Applying the adjustment results in 0.474 tonnes, being 474 kg.
So my result obtained of 470 to 480 kg is significantly different to your estimate of 800 kg.
I previously used this data and the slope of the lines in Chart F4 (previous comment) to compare (in fact eyeball) the times at which the lines crossed any particular given fuel remaining gridline, in the region of the start of the straight flight southwards. The region between the (nominal) “Start” Point and the symbols representing the crossing of Arc2, served admirably for this purpose, and for the following conclusion.
The difference between the two lines, representing two “flights” ending at the same time of fuel exhaustion, represents five (5) more minutes available for Trial #854 at any given usable fuel still remaining in the aircraft fuel tanks.
To be clearer, at (say) 28 tonnes fuel still remaining, Trial #854 can fly, burning fuel, for 5 minutes longer than can Trial #815.
In the region of the start of the straight flight southwards, and for both Trials, the Ground Speed modelled by the Authors UGIB, and tabled in the report, is/was approximately 480 knots.
The 5 minutes longer flying time available for Trial #854 at a ground speed of 480 knots equates to an extra 40 nautical miles.
Or, more distinctly, with (say) 28 tonnes usable fuel remaining, Trial #854 can cover 40 nautical miles than can Trial #815.
________________
Some qualifications:
To be clear: The five minutes represents the time difference using Trial #854, after making the 0.1 tonne adjustment. This is represented by a solid line on Chart F4 and by a faint dashed line on Chart Fd.
It is noted that the Geometric Altitude for Trial #854 is tabled at 41,207 feet throughout, excepting for an acknowledgement that the aircraft would have lost height by the time of reaching Arc7. A rounded, presumed nominal, estimate of 20,000 feet has been tabled for Arc7.
For the earlier Trial #815, the data tabled in Figure 16 ranges from 39251 to 39477 feet with no allowance for altitude loss by Arc7. If the pressure altitude had actually changed by (say) 2,000 feet then this would affect fuel consumption. Both Trials were supposedly at the same pressure altitude as represented by “Flight Level 390”.
The above calculation, and declaration, of 40 Nm, makes no allowance for the fact that a slight reduction in fuel consumption will occur as the flight progresses, but considering that the change in fuel aircraft mass from 28 tonnes to zero only represents 0.16% of the aircraft zero fuel weight of 174,369 tonnes the effect is relatively minor, and will similarly affect both sets of trial data anyway.
Note: Your estimate of 800 kg, was in conjunction with a range increase estimate of 69 NM.
Our range increase estimates per kg extra fuel available are considered reasonably consistent.
In comparison with the estimate of 474 kg made here, your 800 kg estimate would correspond to a proportionately larger range increase of 40*800/474=67.5 Nm.
_________________
CORRECTION:
The above calculation, and declaration, of 40 Nm, appears to make no allowance for the fact that a reduction in fuel consumption rate will occur as the flight progresses. The change in fuel mass from 28 tonnes to zero represents 16% of the aircraft zero fuel weight of 174.369 tonnes. The effect is measurable. It will affect both sets of trial data similarly. The 5 minute flight duration advantage for Trial #854 over that for Trial #815 should still apply.
@Paul Smithson,
At a more accurate average of +3C above ISAT for the best-fit MH370 southbound route, the additional range with air packs off is slightly increased to 71 NM.
@George G,
Your attempt to model the aircraft mass as a straight line over time is a rough approximation. That function will be a parabola, because (as you later realized), the weight changes as fuel is consumed, and this means the fuel flow needed (i.e., the slope of weight versus time) is continually reducing. A time-based model with small time increments is needed to accurately predict the fuel required to fly a given route. In UGIB we used a 1-mnute increment in the fuel model. When fitting routes, the initial weight is adjusted until the correct MEFE time is predicted. However, because of the integer minutes used in the fuel model, there is an uncertainty of +/- 1 minute of time or roughly +/- 100 kg of initial fuel. When you take the difference between two estimates of initial fuel, the error is bounded by + / – 200 kg. The difference in estimated initial fuel for Trials 815 and 854 is therefore 574 +/- 200 kg. My back-of-the-envelope estimate of about 800 kg difference is based on using the fuel flow difference at an average (straight line) weight of 188 tonnes, not on the more accurate time increment method. The average weight will actually be less than 188 tonnes, because that weight is reached sooner than the mid-way point in time. At a lower average weight, the fuel savings are slightly less than my rough estimate of 800 kg, and this appears to be reasonably compatible with the 574 +/- 200 kg estimate from the (more accurate but less precise) time-based model difference.
Turning the air packs off has two fuel/range benefits: (1) at the same weight the fuel flow is reduced, and (2) the weight is reduced because less fuel is required on board, and this further reduces the fuel flow. This second effect is small, but it is included in the UGIB fuel model. The weight dependence of the fuel flow for these conditions has a slope near 29 kg / hr / tonne for 2 engines. The average weight difference is about half of the roughly 800 kg, or 0.4 tonnes. Therefore, the reduced weight saves extra fuel in the amount of roughly 29 X 0.4 tonnes = 11.5 kg / hr for 4.5 hours, which is 52 kg. So, this secondary effect adds roughly 30 seconds of powered flight, or about 4 NM in range with air packs OFF.
To obtain a very precise estimate of the total additional range available with air packs OFF requires building a fuel model with a time increment of 10 seconds or less. We did not do that in UGIB because uncertainties in the fuel flows and in each of the fuel gage readings are about 100 kg or larger, so a more precise fuel model does not improve the accuracy of MEFE time prediction in a route fit. You can’t do better than about 3-4 minutes of error in an absolute MEFE time prediction for 9M-MRO, and you can’t do better than about 1-2 minutes in a differential comparison of two route fits. One could make a more precise prediction of the additional range possible with air packs OFF by using a complete fuel model (like the one in UGIB) with a shorter time increment.
@Victor
I like the fact that Vietnam is pushing back.
@all,
If anyone has the know-how and interest to create an EXCEL macro for the MH370 fuel model, please email me.
I think doing that would allow a specially defined function call (like a subroutine call) which would make it very straightforward for anyone to create a time-based fuel model in EXCEL. Currently, I have the fuel model in an EXCEL worksheet that has embedded bicubic interpolation functions addressing about a dozen other worksheets to retrieve fuel flow and other parameter values. However, I don’t have a macro so that one can use a special function to retrieve the fuel flow, Mach, TAS, KIAS, etc. when providing FL, weight, delta SAT, speed mode, Mach value, PDA, and air packs on/off. For UGIB I had a huge spreadsheet with the entire fuel model pasted into every row. It is slow to run and hard to customize, so I am looking for a better way to do this in EXCEL.
@DrB,
Please relook at the previously sent Charts F3 and F4.
On each you will see the statement:
“Dotted Trendlines are Second Order Polynomials fitted by Excel.”
If you look at the overall chart in the upper right corner of each you will be able to use a ruler or other straight line device to see that no straight line model was attempted.
My later realisation and thus correction was due to my concern that I MUST have made some error, whatever. So I came back some time later, found the error, and made/wrote the correction.
For any measurement there is some uncertainty.
For example a data acquisition system will have only a certain number of bits, and that alone will introduce limitations.
You have described such or similar limitations in your:
“However, because of the integer minutes used in the fuel model, there is an uncertainty of +/- 1 minute of time or roughly +/- 100 kg of initial fuel. When you take the difference between two estimates of initial fuel, the error is bounded by + / – 200 kg.”
One method of resolving such limitations is to fit a smooth curve to sets of data.
I used the fitted curves to data to smooth out the comparisons I was making. It was by comparing the curves towards fuel exhaustion, i.e. Arc6 and subsequent, that I made the 0.1 tonne (100 kg) adjustment. This is akin to your “When fitting routes, the initial weight is adjusted until the correct MEFE time is predicted.”
I made the first comment, under the heading “Fuel – Another Perspective”, because I was surprised about the relatively “small” 40 NM estimate, and thought it noteworthy in context of some of the discussion around how far south fuel would have lasted.
I have started another approach which might overall be simpler and when the presentation is finalised I will post it.
In the meantime I stand by my initial estimate of 40 Nautical Miles.
https://www.dropbox.com/s/jeg15qiuchmvlc0/YvsX.pdf?dl=0
@George G: FYI…I ignore graphs unless all the axis are labelled with the variable names and units.
@DrB
I appreciate all of the calcs/Excel tools you and others have made available for MH370. Thank you.
@George G,
Here is a summary of a direct comparison of the fuel flows and air ranges with air packs ON and OFF after 19:41.
https://docs.google.com/document/d/16mC69CNuvzZwavCT_bflEX2yUq7wlb9g/edit?usp=sharing&ouid=118002676424453150092&rtpof=true&sd=true
I built a new 1-minute time-based fuel model, and I interpolated the MEFE time to better than 1 second and the air range to within 0.1 NM.
The 19:41 fuel needed to achieve MEFE with air packs ON agrees very closely with Trial 815 in UGIB. The total weight is 201.654 tonnes to achieve MEFE at 00:17:30.
Using that same 19:41 fuel load with air packs OFF, MEFE occurs 8:37 later at 00:26:07. The air miles increase from 2234 to 2304 NM, which is 70 NM additional air range.
@DrB
I prepared a chart, which is my easiest and or best means of making comparisons.
As part of the chart, accompanying text is promised. I had intended to leave it to later. But I checked Victor’s website before I left.
Your summary of the direct comparison raises even more of a question as to why do we differ in estimates.
So, I then proceeded with the text page.
The Chart name is “FDvF” an abbreviation for “Flight Distance versus Fuel consumed”. The Text Sheet is correspondingly “TextFDvF”.
The file combining both is “FDvF_TnC” and is linked below.
I did take a short break,
and attempted to proofread the text, but that hardly ever works well.
https://www.dropbox.com/s/n0yywrysgyfv8i7/FDvF_TnC.pdf?dl=0
@VictorI. Your, “….the prospect of the pilot intermittently cycling the packs to conserve fuel while maintaining cabin pressurization seems a bit fanciful…..”
First, Bayes. In posts in February and March 2020 @DennisW introduced us to some Bayes equations for calculating the effect of unsuccessful searches on the likelihood of success in subsequent searches of the same area. Those simple equations also calculate the consequent probability increases in other candidate areas.
Since then I have introduced some amendment to the method of application. This follows the introduction of a cross-check that the adjusted probabilities, now calculated for all areas post-search, add to 100%. Exactly that is required since obviously the wreckage must be somewhere yet not in more than one place. Surprisingly that has corrected an error in the way the equations are applied and, substantially, outcomes.
Now to your UGIB A1 area, in the above posts DennisW also included his analytical estimate that, pre-search, the probability that the wreckage was in the UGIB A1 area was 60%.
Using that, my estimate of the post search possibilities now follows, based on the commonly supposed likelihood that the searches conducted would have had a 95% prospect of a wreckage find.
The A1 area searched has been 80% of it. The unsearched 20% includes the steep part of which you are well aware.
The pre-search probability of it being in that 80% was Dennis’s 60% multiplied by 0.8, or 48%. The like prior probability that it was in the remaining 20% of A1 was 60% by 0.2, or 12%. The chance that it was elsewhere obviously was 100% less that 60%, ie 40%.
Post the searches, the probability that it was in the 80% but not found I calculate as 4.4%. The new probability that it is in the 20% unsearched A1 has risen from its 12% to, now, 22%, while the 40% of the ‘elsewhere’ has risen to 73.6%, all calculated independently. Note the balance again is 100%.
Thus were there now a search of the 20%, it would have a success probability of between 1 in 4 and 1 in 5; not high. Were that in turn unsuccessful, the probability of a subsequent repeat search of that being successful would be just 1.4%, while that of the 80% would rise from its 4.4% but to just 5.6%.
So a search ‘elsewhere’ instead might well be warranted, the probability of it being there now having risen to from its 73.6% to 93% (again independently calculated but the total checking at that 1.4% and plus 5.6%, ie 100%.)
While OI was in the A1 area a search of adjacent ‘elsewhere’ areas might be warranted but it is hard to estimate probabilities if an active pilot is to be assumed, since doing so would open up many other competing possibilities.
However a search based on the possibility that aircraft phugoids carried the aircraft wider than could be expected from the simulations might well be that preferred as UGIB will be well aware, noting the simulator limitations (would not be based on in-flight trials, numbers). Also wind possibilities during the descent, final descent starting altitude and other possible contributors could be added. (I confess I have not refreshed my memory of the UGIB paper recently).
The choice of continuing with unpiloted supposition, rather than focussing on local manned glide areas would be supported by continuing confidence in the UGIB conclusion that there was no active pilot. Many would agree with that likelihood, including me, so far.
Also relevant I think, as to any speculation that an active pilot might aim for the steep area, thereby lifting the A1 20%’s likelihood, it is unlikely he would be aware of it. Added to that, the simulations, such as they were, mainly ended to the east of the steep unsearched area, with none passing close over or ending near it. Therefore there is no reason apparent why it should be supposed that the 20% is a hot spot.
While there might be others as to why it should carry a higher probability, at the expense of the 80% (the aggregate 60% for the two still applying), I do not know of any.
The point I would like to make is that I for one am supposing that the first OI choice would be the unsearched 20% of A1 yet, based on DennisW’s 60% probability above, that well might fail. So we could confirm the what-next if that has not been done, to assist OI with settling follow-on priorities, bearing in mind too that it might have others already in mind, including the latest WSPR possibility.
Observing all that I have been looking into alternative feasibilities such as a pilot not shutting off bleed air in an initial decompression, or after shutting it off later, maintaining pressurisation by an occasional top-up (as per your comment), or a piloted initiated final log-on. Also, whether the final ‘plunge’ really is just a phugoid is a related issue, together with its implications for there being a pilot etc etc.
Putting that approach aside though (which I have done), it might be worth UGIB reviewing and confirming now what area should be included in a follow-on search while the OI Armada is in the area, plus the priority of any subsequent search of the local piloted glide area, amongst other candidates. I note though that if such is to be proposed on the basis that the UGIB fuel model might have undiscovered errors, the same might apply to any others also constrained by the model.
@George G,
You are making several assumptions in your analysis which are not warranted:
(1) You are assuming the Trial 815 route is identical to the route for Trial 854. It is very close, but not identical.
(2) The UGIB tables list “ground miles at altitude”, including the effects of headwinds/tailwinds. My time-based results are air miles and do not consider wind.
(3) You are not comparing two cases with the same starting weight. The whole point of this exercise is to start with the same amount of fuel and see how far each can fly. The UGIB tables, and your latest plot, start at different weights, so your comparison is not strictly valid.
(4) As I said before, the MEFE times in UGIB have a significant uncertainty of +/- 1 minute. So, the prediction of the fuel required has un uncertainty of +/- 1 minute of cruise fuel flow (about 100 kg/min at the start) in each trial. You are ignoring the error bars on each fuel quantity (+/- 100 kg), and the even larger error bar on the difference (+/- 200 kg).
For what it is worth, the difference of the two UGIB fuel estimates at 19:41 is highly uncertain (574 +/- 200 kg). Using my new time-based fuel model with 1 s precision in the MEFE time, the fuel on board required at 19:41 to achieve MEFE at 00:17:30 with air packs OFF is 26,407 kg. With air packs ON, it is 27,285. Thus, the fuel savings for MEFE at 00:17:30 with air packs turned off is 27,285 – 26,407 = 878 kg, which is slightly above the 574 + 200 = 774 kg estimate from the two UGIB tables. I suspect this remaining difference is due to the minor route differences in the UGIB tables and to a small change in my current fuel model (which now applies the same “delta T ISAT” fuel flow correction to the air packs and electrical loads).
My conclusions are that turning the air packs OFF at 19:41: (1) allows the aircraft to fly close to 70 NM farther with the same fuel load at 19:41, and (2) reduces the fuel needed at 19:41 by about 878 kg for the same MEFE at 00:17:30.
@DrB
I will first post what I have just written, starting with “In your summary”:
In your summary of a direct comparison of the fuel flows and air ranges as tabled in your “2023.04.09 DrB – Additional range with air packs off” You have tabled the following two values:
Start_FF, Air_Packs ON: 6304 kg/hr (total for two engines); and
Start_FF, Air_Packs ON: 6125 kg/hr (total for two engines).
6125 is 97.16% of 6304.
That is 100% less 2.84%.
In the UGIB Report, Refer to Appendix A, Fuel Model, and specifically please refer to Paragraph 13 at the top pf Page 81, being part of Section “A.11 Fuel Flow Reduction with Air Packs Off”.
Quote in part: “so the total FF reduction with two engines operating is 1.16% + 0.4% = 1.56% at 39,000 feet”.
Have you revised this ?
_______________________
Now, having seen your message above:
You write:
“(2) The UGIB tables list “ground miles at altitude”, including the effects of headwinds/tailwinds. My time-based results are air miles and do not consider wind.”
I specifically used TAS as tabled in Figure 16, below GDAS deltaSAT and above
Wind Speed, particularly for the reasons you indicate. The tabled entry for “Leg 2 Average” being 484.5 as an example. (Leg 2 Average being the leg between Arcs 2 and 3.)
@David,
Prioritizing which zones are to be searched first is enabled by considering, for each zone, the ratio of its detection probability to its physical area to be scanned. The “search efficiency factor” (SEF) tells one how much bang you get for a buck (assuming the cost to search a square NM are roughly equal everywhere). The very small portion of the 80% of A1 that has not been adequately searched is not more than 2% of the physical area. The detection probability is now 4.4% (and almost all of this is in the 2% of the area that needs new coverage), and the area to be searched to achieve that is 0.02 X 0.80 X 6,719 SQNM = 108 SQNM. Its SEF is 4.4% / 108 SQNM = 41 %/1000 SQNM. Next consider the completely unsearched 20% of A1 that now has a 22% detection probability. Its SEF is 22% divided by 20% X 6,719 = 1,344 SQNM, which is 16 %/1000 SQNM. So, per square NM, one gains less than half the cumulative detection probability by looking at the totally unsearched (20%) portion of A1 compared to searching the 108 SQNM that has not been adequately searched within the prior swath. Finally, consider the area outside A1, which now has 73.6% of the detection probability. Covering from 32.9S to 36.4S out to +/- 47 NM from Arc 7 is roughly another 15,000 SQNM outside A1 and previously searched areas. Thus, its SEF is roughly 73.6% / 15,000 SQNM = 5 %/1000 SQNM.
You get the most return per dollar invested if you first cover the 2% portion of the 80% of A1 that needs new coverage, with a SEF = 41 %/1000 SQNM. Second priority is the completely unsearched portion of A1, with SEF = 16 %/1000 SQNM. Coming in last is the third (outer) area with 5 %/1000 SQNM.
@George G,
My current fuel model allows 200 kg/hr per engine at ISAT for non-thrust-producing loads including engine losses, electrical loads, and air packs. Of this, I estimate about 88 kg/hr is the impact of the air packs and the rest is electrical loads and engine losses. The total of 200 kg/hr/engine is fairly well understood and is built into the Boeing tables. So, I obtain the Boeing tabular fuel flow by interpolation and then subtract 200 to get the thrust-producing fuel flow. I also have a model for predicting this quantity for the flight modes which don’t have Boeing tables. Then I add the electrical load and engine loss fuel flow (nominally 112) while correcting for non-standard temperature, and then I do the same for the air packs (nominally 88) if they are ON. This is slightly different from UGIB, and I don’t know for certain which method is more accurate. So, in my current fuel model, the air packs OFF FF savings is not a fixed percentage of the nominal fuel flow (even at a constant flight level). The percentage varies with air speed/weight and flight level, but it is now generally predicted to be a bit higher (by about 1.3 %) than what was used in UGIB. This is a very esoteric topic, and there is little, and sometime conflicting, documentation. In summary, I think either method of estimating the FF savings with air packs OFF could be used. They differ by about 1.3 % in fuel (or roughly 350 kg) and in air miles (about 29 NM). So, the differences in the UGIB tables and my current fuel model predictions are mostly due to a change since 2020 in the way I predict the air packs fuel flow.
@DrB,
Ta.
@DrB. Thanks. Yes. Agree.
Presumably cost/sqnm would include the transits and setting-ups for different sites. Also, search rate, ie how many AUVs can be deployed, could affect that it in the more difficult terrain?
However on your “how much bang you get for a buck”, I expect that that would not be measured in cost/sqnm but that divided by success probability/sqnm , yielding cost/success probability gained.
But I am unsure to what extent OI would be direct-cost optimising. Opportunity costs might be high and searching to the time available, while related, could be an issue too (transits, search rates).
All that aside, what to do next if that spot searching and that of the 20% of A1 fails is a real issue I think.
Observing SEF aspects, @370Location will have a view I suspect.
@David,
You said: “However on your “how much bang you get for a buck”, I expect that that would not be measured in cost/sqnm but that divided by success probability/sqnm , yielding cost/success probability gained.”
I did not use cost/SQNM specifically in my proposed SEF (because I assumed it was the same everywhere), but it can be added if it is not a constant. The cost/success probability gained that you suggest is low when the probability is high and the area/cost is low. That’s why I suggested a SEF which is its inverse (probability per cost unit).That FOM is in the proper direction, so a higher value has a higher priority.
Victor and I are developing some prioritized search recommendations in our next paper. I found that a fairly wide range of latitudes must be covered to get to a very high cumulative detection probability (close to 100%). While the drift probability indeed has a peak at 34S, it is considerably broader than the PDFs shown in in most prior drift studies. The reason for this bias is now understood and avoided in a new method of predicting drift probability. So, the good news is that I believe we have a more accurate method of predicting the drift probability, but the bad news is that the acceptable range of crash latitudes is wider than many people predicted.
@DrB. My thanks.
Re “Victor and I are developing some prioritized search recommendations in our next paper.” Great to hear that, despite the difficulties.
@Dr B. Interested in your 200kg number above for non-thrust-producing fuel. You say above that you add 112kg/hr/engine back for electrical load + engine losses. Would there not be significant savings from lower than usual electrical loads? Of the 112, how much do you think is engine, how much electrical?
@PaulS
Sounds like if you cut off one engine/IDG (which is conceivable for me) you save 200 kg/hr for the whole trip. If Right IDG was cut at 1825 perhaps that could explain SATCOM reboot. Interesting question if the PDA reduction is due to the engine itself or the associated generators etc.
@Paul Smithson,
The non-thrust-producing fuel flow of 200 kg/hr/engine at ISAT is estimated by calculating the thrust for entries in the Boeing FF tables, and then extrapolating the FF to zero thrust. The intercept value of FF comprises three elements: (a) it compresses bleed air, (b) it drives the integrated electrical generators, hydraulic pump and fuel pump, and (c) it includes parasitic engine losses. The IDG portion is estimated by the FF needed for the APU for electrical generation only, which is 60 kg/hr (see page 77 in UGIB). Thus, one would expect the total electrical loads (including pumps) to demand 30 kg/hr in each of the two main engines in cruise. Therefore, about 170 kg/hr/engine is needed for bleed air and engine parasitic losses. Section A.11 in UGIB is a detailed discussion of the FF savings with air packs off. My best guess today for the bleed air savings is 55 kg/hr/engine, which is consistent with UGIB. At one point in time since UGIB, I came up with a figure of 88 kg/hr/engine, but, after reviewing this again, that value seems too high. Using 55 kg/hr/engine for compressing bleed air, the engine parasitic losses are roughly 115 kg/hr/engine.
It is unclear to me whether or not the electrical loads were significantly reduced after diversion. For about an hour the radios and transponders and the SDU were OFF. After 18:25 much of this equipment was re-powered. I would guess the cabin lighting was always ON since it cannot be turned OFF in the flight deck. I don’t know about galley ovens, etc. Would they remain ON or would they be reset to OFF after being depowered? The total FF reduction due to reduced electrical loads would be a fraction of the 60 kg/hr. After 19:41 a potential savings of roughly 20 kg/hr would amount to 90 kg, so that could add about a minute of powered flight.
@TBill,
You said: “Sounds like if you cut off one engine/IDG (which is conceivable for me) you save 200 kg/hr for the whole trip.”
The net savings are small or non-existent. Otherwise, an airline could save money by cruising on one engine.
First, when shutting down an engine, or just its IDG, the entire electrical load must be serviced by the remaining engine, so its FF goes up to do that. Second, with one engine shut down, the required thrust must be produced by one engine, not by two engines. That leads to extremely high fuel flow to produce slightly more than twice the thrust (because of the additional rudder drag to compensate for the thrust asymmetry). More or less, at cruise altitude the remaining engine goes to MAX CLIMB thrust. This aircraft cannot maintain level flight on one engine above about 25,000 feet.
Thanks, Dr B. That all sounds reasonable, though I would be interested to hear from others who have familiarity with the major electrical load contributors and which ones “might” have been off after the diversion.
I had also been using the APU 60L/hr fuel figure as a rough guide to fuel required for electrical load. As I understand, there’s essentially triple redundancy and the APU or either IDG is able to power full normal electrical load without shedding. Is that right?
@Paul Smithson,
Yes, my understanding is that either IDG or the APU can supply all electrical loads.
Table D-1 on page 117 in UGIB shows that all scenarios for the best-fit route have predicted MEFE times PRIOR to 00:17:30. The closest scenario to match MEFE is Case #9 which has a predicted MEFE at 00:15:58 UTC, which is about 1.5 minutes early. None of the scenarios in UGIB included any fuel savings for reduced electrical loads. Including roughly 90 kg of fuel savings due to reduced electrical loads after 19:41 allows Case #9 to have a predicted MEFE circa 00:17:00, just 30 seconds before the apparent MEFE based on the SATCOM data. Thus, I would say that this effect could explain most of the residual fuel shortfall for the BEDAX 180 degree route for Case #9.
The entire 1.5 minute shortfall in Case #9 can be explained by either, or a combination, of the following:
(a) The bleed air was NEVER turned back on after diversion. Compared to Case #9, this adds about 132 kg for the 1.2 hour period from 18:29 to 19:41, resulting in a MEFE 1.3 minutes later.
(b) The electrical loads were reduced after 17:26, saving about 20 kg/hr for 6.85 hours, or 137 kg, This adds up to 1.8 minutes of powered flight.
@DrB, @Paul Smithson: My speculation is the aircraft was descending at 18:40z with no bleed air and open outlet valves, which was the same air valve configuration after the turnback. The plane re-pressurized at low altitude and the pilot became incapacitated during the climb back to cruise altitude with no further pilot inputs.
@all,
Here is a new table (based on UGIB Table D-1) comparing 19:41:03 fuel availability and requirements:
https://drive.google.com/file/d/1PCqA20wF29pu9bvi3YAOqcr5bs-lNTEU/view?usp=share_link
These notes match the line item numbers in the table.
1. The fuel needed at 19:41 for MEFE at 00:17:30 (with the wing tank cross-feed valves always closed) is 27,111 kg.
2. The 19:41 fuel needed to match the MEFE time is reduced by about 450 kg to 26,660 kg if the air packs are OFF after 19:41.
3. Using the FMT Route from UGIB, the available fuel at 19:41 is nominally 26,045 kg, for a shortfall of at least 615 kg.
4. Turning the air packs OFF from 17:26 to 19:41 saves 248 kg of fuel, but the shortfall is still 367 kg.
5. Turning the right engine OFF when at FL100 saves another 347 kg of fuel. Now the shortfall is only 20 kg, which is within the prediction noise to match MEFE.
6. A small 5% reduction in electrical load after 17:26 would save another 20 kg of fuel to produce an exact MEFE match. Larger electrical load reductions may be possible.
Conclusions:
If the BEDAX 180 degree route is correct, and if a descent occurred in the FMT route, then it is probable that both the air packs were OFF after 17:26 and the right engine was shut down for about an hour when at FL100.
Alternatively, if there was no descent in the FMT route, it is still necessary for the air packs to be OFF after 17:26.
Even if the electrical loads were cut in half, that would save only about 200 kg of fuel, and that is insufficient to exclude the air packs being OFF after 17:26.
@DrB
Sorry to be unclear, I was suggesting turning off IDG (disengaging generator) only at 1825. Two engines of course needed for high alt cruise. I am suggesting max fuel savings potentially important for a deliberate flight-to-end case.
@Victor
If the plane was descending at 18.40 it is likely the descent was at constant speed. Would this have caused fluctuations in the BFO due to changes in rate of descent to maintain speed?
@Amble: From memory…the 18:40 BFO values indicate that the plane was either (a) in the process of completing a turn to ~186 degrees, or (b) continuing WNW and in the process of descending ~2500 ft/min. Victor will have more precise numbers.
@Amble: To be clear, the relevant observed BFO values preceded the 18:40 time by ~12 minutes, but could be indicative of a descent starting around 18:27 and continuing for several minutes thereafter. Note the BFO values changed ~30 Hz between 18:27 and 18:28. Or, the change could indicate a turn to the south circa 18:28 at a constant altitude.
ARC UTC BTO(sec) BFO(Hz)
1-a 18:25:27 0.012520 142
1-b 18:27:03 0.012560 176
1-c 18:27:04 0.012520 175
1-d 18:27:08 0.012520 172
1-e 18:28:06 0.012500 144
1-f 18:28:10 0.012520 148
1 18:28:15 0.012480 143
@Amble: It may be that the plane descended using the Vertical Speed (VS) autopilot mode. While it is more common to use Flight Level Change (FLC) mode, the VS mode might have been selected because it is easier to set the vertical speed to a value that the pilot’s ears could tolerate, assuming the cabin was essentially at ambient pressure. As such, the VS mode would also result in more steady values of BFO.
Apologies for all the addendum…Of course, there were also BFO values (but no BTO values) circa 18:40 from the telephone call attempt. The BFO was down to ~87 Hz then. An analysis from Dec 2014: http://bit.ly/41qEurf
@DrB
Following up on our exchange last week I tried to include the BFO data in a first basic statistical analysis. We are all aware that the phenomenological distribution function for especially the BFO residuals should be applied with some care. The “model” that is fitted against the measured data is that of single setting (thrust, FL, initial bearing) flight paths. Please see link for more details and some results.
An important point for discussion:
The path probabilities can only be related to the original flight path if the measured BTOs and Ds used to calculate the residuals would have a sufficient small error, which we only know through probabilities. Interestingly, the procedure described above produces a probability weighted mean for the BTOs and Ds, and the question is if these can be employed as best estimate for the measured values. This is a point I’m currently addressing, and a possible clue is in the number of degrees of freedom present in the initial conditions (n_i), vs. the number of restricting measurement points (n_m). Here we have n_i = 5 (FL, thrust, bearing, lat_i, lon_i) and n¬_m = 10 (5 BTOs and 5 Ds). To rephrase the question: if the set of random test paths is not biased and the (path) probability weighted mean residuals are non-zero at an individual level, does that imply that there was a probable bias/error in the original individual measured values, for which you then would have an indicative value? I would happy to hear how others look at this. All of this of course under the assumption that the single setting paths represent the right “model”.
A follow up question is: can these “best estimates” then be applied in a similar second statistical evaluation run to improve the estimates of the mean of different variables such as the 00:19 latitude? If so, which standard deviations should then be used?
Another important point for discussion may be the independence of (especially BFOR) probabilities. I’m quite sure the very basic statistical analysis can be improved.
I intend to repeat this analysis for GC with ac packs on, and CTT (packs on and off).
https://www.dropbox.com/s/q5ltaxfh36l3rj9/BTOBFOstatistics_v4.pdf?dl=0
@Niels,
Is your basic premise correct?
I don’t believe a probability-weighted mean of a set of “randomly predicted” values of a parameter like the 00:19 latitude is an unbiased estimator of the value for the true route. That is because the residuals for each random route are the sum of random reading errors and an unknown “route error” function which is not random and which is generally correlated over time for incorrect routes. In UGIB I reduced the probability of routes which have correlated residuals by using the correlation coefficients in the probability calculation. If you do not penalize a route probability by reducing it when the residuals have correlation coefficients which are inconsistent with expectations, you overestimate that route probability.
In addition, we already know that the BTORs and BFORs of an optimized route fit vary systematically (and not randomly) as a function of initial bearing (and therefore as a function of 00:19 latitude). That’s why in our earliest probability assessments we did not use randomly generated paths, but instead used a set of equally spaced bearings (or other single parameter like speed or flight level), fitting the maximum-likelihood parameters for the rest of the variables. Then we compared the probabilities of that small set of optimized routes which accessed the whole 7th Arc. In UGIB we repeated that process to obtain a route PDF, and we also found the most likely route. So, our method is based on maximum likelihood estimation, and it adjusts the fitted parameters to lie on or close to the peaks of their PDFs (the shapes of which we don’t assume, nor do we attempt to predict). Our method makes no assumptions regarding the lack of skewness of any PDF. I think your method will be unbiased only if all PDFs are symmetrical about the true route values, but you can’t know that when you assume the PDFs because you don’t know the true values.
Using a set of randomly chosen route parameters, and then evaluating its probability, has never appealed to me because none of the true route parameters were chosen randomly. Nor do we have an ensemble of randomly chosen routes available to be analyzed. The only random variables in this problem are the read noises of the BTOs and BFOs. So, why should I treat bearing, or flight level, or 19:41 latitude as a random variable? Sure, I have to solve for their values, but doing that does not require they be treated as random variables. As soon as I make that assumption, I have to assume or predict a PDF for each one. That’s when bias is created in the prediction process, no matter what you choose for a PDF (uniform, gaussian, etc.). Even with a uniform PDF, there are limits imposed on minimum and maximum values. When you do that, the mean becomes the average of the maximum and minimum. Is that mean the most likely estimator of the true value? No.
I have never been a fan of randomly generated routes for a problem as nonlinear as this one. To me, the whole premise is flawed. While we do know the limits on route parameters like flight level, speed, bearing, etc., we certainly don’t know their PDFs because they are not random variables. I don’t see how it is possible to avoid prediction bias when one assumes each route parameter is a random variable and arbitrarily assumes a PDF for each one.
@DrB
Many thanks for your feedback. As it is work in progress I will not react on all details now (like how to deal with possible unexpected correlations in residuals). I expect in time, and perhaps with some helpful comments I will manage 😊, and address it when it will come to a more formal, extensive paper. I’ll focus here on the more principle points regarding the “Monte Carlo” approach.
First of all, while the point of discussion that I brought forward in my previous posting might have suggested differently, I think the estimate of the mean of for example 00:19 latitude in the end is not the main result, as I’m not try to a find a specific latitude. The range (as fig. 1 could give a first indication for) is much more important.
I agree with you that the assumed PDF for the initial conditions (lat_i, lon_i, bearing, thrust setting and FL) will impact the final, cumulative distribution. I try to choose the lat_i, lon_i and bearing range wide enough such that for example fig. 1 will not change as I make the initial ranges wider (and indeed they are uniform). I’m actually currently explicitly checking this with additional sets of 5 million GC paths where I vary the range, especially for the bearing. Also I’m still checking the impact of the 19:14 lat range ([-2, 6] deg) which is related to the limits of the fuel model.
In all detail it is a bit more complex, as I define the mean of the (limited) uniform distributions for lon_i and bearing as a function of lat_i. This is done to increase the efficiency of the method. The functions used for this were based on my previous paper, where the results show that both the 19:41 longitude as well as 19:41 bearing correlate with the 19:41 latitude (for the lon this is expected: 2nd arc).
In practice, still the majority of calculated paths will not contribute to the cumulative probability functions in any significant way and that’s why I need so many path trials. In my opinion it does not matter where I put the limits exactly, as long as they are outside of the statistical relevant window.
The thrust settings (ECON, LRC, MRC, M078, M080, M082, M084) were randomly chosen as well with equal probability; the flight level with a uniform distribution between 310 and 410. Sure, all these uniform distributions are assumptions and this will impact for example the shape of fig. 1.
Are these unreasonable choices given all the unknowns that we have? Personally I don’t think so, but I would be happy to hear the opinion of others, so please feel free to chime in.
The uniform distributions over a relative wide range will lead to a relative wide range of 00:19 latitudes, as can be seen in figure 1, as compared for example to your method. But isn’t that a more sensible way when aiming to help define a search area than virtually trying to define one main candidate path / hot spot?
@Niels,
In your note you said: “The evaluation run indicates a weighted mean 00:19 latitude of S35.9 and an estimated mean FL 374.”
Then today you said: “First of all, while the point of discussion that I brought forward in my previous posting might have suggested differently, I think the estimate of the mean of for example 00:19 latitude in the end is not the main result, as I’m not try to a find a specific latitude. The range (as fig. 1 could give a first indication for) is much more important.”
Your note only gave numbers for the weighted mean values for each parameter and not for their ranges. For the reasons I gave previously, I don’t think either a weighted mean or a peak in the cumulative probability is an unbiased estimator of any of the route parameters.
I agree the ranges are “interesting”, but you will then need to specify some threshold of probability in order to define a range.
You also said: “The uniform distributions over a relative wide range will lead to a relative wide range of 00:19 latitudes, as can be seen in figure 1, as compared for example to your method. But isn’t that a more sensible way when aiming to help define a search area than virtually trying to define one main candidate path / hot spot?”
You may be confusing Victor’s post of 02/11/2023 with our joint UGIB result. Victor’s post uses our last estimated position to prioritize a nearby missed area within A1.
In UGIB we calculated an overall search latitude PDF using the SATCOM/GDAS route PDF, the fuel PDF, the aerial search PDF, and the debris drift PDF. That is what the UGIB search area recommendations were based on – that joint PDF (not one route LEP).
Our upcoming paper uses the same method as UGIB, which does not weight the BEDAX 180 degree route any more than other routes. The multiple search areas we will recommend are based on the revised overall joint PDF and on the areas already searched, and not on one preferred route. They extend more than 3 degrees in Arc 7 latitude. Within a given search zone, prioritizing the order in which the coverage is planned does make sense to us, and there is sufficient analytical justification for the BEDAX 180 degree route to use it for prioritizing a number of revisits and holiday coverages needed in the vicinity of 34.2S.
@DrB
Ok, the main purpose of posting the progress note was to discuss methodology and actually you did address mainly the methodology by question the whole premise 😊, which is fine and useful.
In the original note that I prepared I ended with a figure 2 showing an updated cumulative distribution function based on the means of the BTOs and Ds listed in table 1, but I decided to remove it as I wanted to first discuss the principle of using (updated) cumulative probability function to estimate variables / parameters.
Not sure, however, if an update on cumulative probability functions based on possible improved estimates for the BTOs and Ds has much practical value, if you compare it to the more significant impact of the assumptions behind the calculations. You brought this correctly up for discussion, and actually @sk999 addressed this impact as well, in his paper posted March 21st.
A question regarding your approach: I’m actually wondering how you avoid bias in your route PDF. Even if you have a superior method to find the peak of the PDFs, I don’t see how you can estimate a route PDF based on “maximum likelihood estimation”, and without making assumptions that will somehow “bias” this PDF.
@Niels,
You said: “A question regarding your approach: I’m actually wondering how you avoid bias in your route PDF. Even if you have a superior method to find the peak of the PDFs, I don’t see how you can estimate a route PDF based on “maximum likelihood estimation”, and without making assumptions that will somehow “bias” this PDF.”
The assumption in maximum likelihood estimation (MLE) theory is that the solution which has the highest probability of matching the expected statistical behavior of the observables is the most probable solution. So, MLE finds the peak probability (the best match) by fitting parameters values to a model of the process and comparing the observables with expectations. In this MH370 case, a lot of work was done by Inmarsat and DSTG to characterize the statistical behavior of the BTOs and BFOs. This involved analyzing data collected during prior flights of 9M-MRO. Without these additional data, we would have a more difficult time predicting the true route.
If one fits all the route parameters using MLE, while maximizing probability, one obtains a single solution. That solution is the BEDAX 180 degree route ending at the LEP.
In order to obtain a “route PDF”, one needs to vary all the parameters but one. The single independent flight control parameter which allows solutions all along Arc 7 is the initial bearing. Note that nothing prevents two different bearings from crossing Arc 7 at the same point. Alternatively, one could use a secondary (dependent) parameter such as the Arc 7 latitude as the assumed variable in MLE. In UGIB we used the bearing at 19:41:03. Now, if one assumes this bearing value and solves for the remaining route parameters, one obtains a Fisher probability estimate after combining all the statistical comparisons. So, one repeats this many times to obtain a list of probabilities versus Arc 7 latitude. That is the “route PDF”. It tells you the relative probability that the plane’s route crossed Arc 7 at a given latitude. It’s unbiased as far as I know if your route model is accurate. That includes winds and temperature along the route. So, GDAS error will affect the prediction, as one would expect. That’s why I generally refer to the route PDF as the probability of matching SATCOM/GDAS data. So, the “assumptions” in this method are that we has an accurate model of how the aircraft flies a specified route, and we know the weather along that route. Prediction error (i.e., “bias”) occurs whenever one of those assumptions is violated. I believe the Boeing flight control modes are well understood and modeled. The GDAS data also appear to be reliable. I have not seen any evidence that errors outside the expected accuracies are implied by our route fitting results. Figure G-4 in UGIB implies the air temperature data have small and smooth differential errors along the route.
@DrB
Thank you, Bobby, for explaining. It may take me a few days to go through the details including rereading parts of the UGIB paper.
@sk999
Regarding your paper posted March 21st, I have a question regarding the choice of BFO bias freq. You write (p.31):
“The BFO bias offset was given a prior value of 149.7 hz – the value derived from
BFOs while the plane was at the gate. A standard deviation of 100 hz was used in the
initial least squares fits (which meant that the offset was essentially unconstrained)
but tighter constraints were imposed when determining the dependence on initial
bearing.”
Could you perhaps explain how the BFO bias is optimized? Is it part of the figure of merit and optimized for each path separately?
It seems to me that the assumption for BFOR standard deviation and (optimized?) BFO bias would strongly impact the 00:19 latitude PDF.
Allowing for a (virtually unlimited) step-change in BFO bias at SatCom re-logon imo is an impactful assumption.
Neils & SK999:
Here’s a stash of early (and some later) BFO Bias calibration and related papers.
https://bit.ly/43DLBhU
Neils,
The BFO bias offset was included as an additional parameter in the BFO model as part of the initial least squares fits (i.e. specifying a fixed bearing, lateral navigation mode, and speed mode and solving for the initial longitude, latitude, Mach, flight level, etc.) For all parameters in the model, I additionally included a “prior”, which was implemented as if I had made an addtional “observation” of each parameter directly, with a particular value and standard deviation, and included that observation in the figure of merit. Normally the standard deviation was set to some huge value such that the contribution to the figure of merit was negligible. This was done largely to keep solutions from totally blowing up in cases where there were there were big degeneracies amongst parameters. So yes, the BFO bias offset was optimized for each path.
You stated, “Allowing for a (virtually unlimited) step-change in BFO bias at SatCom re-logon imo is an impactful assumption.”
Indeed yes. That is why, in the second step, where I combined the probabilities of all the various routes that had been generated in the first step, I allowed for extra contributions to the figure of merit, including the BFO bias offset, but now with more restrictive constraint given by a smaller standard deviation. As is discussed on p. 31-32, I suggested a value of 2.3 Hz, but recognized that the “error in the error” could be substantial.
@airlandseaman
Thank you for sharing!
@sk999
Thanks a lot for the explanation. I guess in the end the bias offset is not extreme in the relevant collection of paths considered, so the initial unconstrained jump not problematic.
I’m not sure though about optimization of the offset per path: the bias offset impacts the measurement points (the values for compensated Doppler) to which the “model” (the flight paths based on specific fixed settings) is fitted. Shouldn’t the same bias offset (perhaps including some drift) be applied to the whole set of paths being tested? And then the bias offset optimized for the whole set?
The BFO Bias should be treated as a constant over any calibrated flight segment. For the MH370 flight to IGARI, the ground based calibration constant was slightly different depending on the SDU and channel type (all near 150 Hz). The best summary can be found in this document: https://bit.ly/41jEOZn. Use the calibrated BFO Offset value for the channel type and SDU where possible.
It is possible that that, following the reboot at 18:25 UTC, the BFO bias values came to a slightly different settled value by 18:28 or so, but we have no proof that happened. It is only a theoretical possibility. Not much aging happens in 1 hr! Even if it did settle at a slightly different value, it would have remained constant for the rest of the flight, and probably within 1-2 Hz of the pre 17:21 values. The statistics in the tables sited above provide a good calibration on the variability…which is tiny.
@ALSM
FWIW I tend to favor about 4-unit BFO change in the direction of -4 BFO, such that about 248 (measured at Arc7) normalizes to 252 at start of flight. This means the flight is slightly more East on Arc7, and it argues in favor of a nominal 180s flight vs. 188s. Arc2 BFO is a bit off probably due to maneuvers in progress. If I thought (which I do not) that BFO did not change or changes the other direction, then 188s is a better fit thru Arc5.
@TBill: What evidence are you basing that 4-unit BFO change on? Any estimate of the BFO Bias should be independent of how well a route fits.
@alsm
You posted some interesting information about the SDU start-up effects. For example good to re-read the Ian Holland paper (2018).
Is it possible to find out which exact OCXO was used in the 9M-MRO SDU?
Neils:
We do not have the specific model and serial number for the 9M-MRO OCXO, but I do have some relevant papers, data, including test data for the Honeywell OCXO certification.
http://bit.ly/2ENebDE
@ALSM
“@TBill: What evidence are you basing that 4-unit BFO change on?”
Briefly, if we look at UGIB path, or more generally, any nominal 180s path, we see the Arc5 calc BFO is 200ish vs 204 measured.
On the other hand, if we look at an 188s path to 38s-40s, there is much better “apparent” fit to all Arc3/4/5 BFO’s.
Question, therefore, do I believe path was nominal 180s and BFO drifted, or do I believe the true flight path was to 38s-40s? I struggled with that question for a while, and I believe BFO drifted a bit. Uncorrected for BFO drift, I can see why the first MH370 search (Bayesian hot spot) was probably too far west.
My old essay: “On the Straightness of the MH370 BFO Trend”
https://docs.google.com/document/d/1d5_ZM6lfcgjVelP6k6RjPIvsZeOgDYtJXELYHDewg3k/edit?usp=sharing
@alsm
Many thanks for sharing the docs on OCXOs
I was particularly looking at the pdf “Honeywell reference oscillator used…”
It focusses on the SD-720; was that the one typically inside MCS-6000?
(I also see mention of a HS-720)
Then it also mentions:
“An oven controlled high stability reference oscillator (Racal part number 81771-MBE located in the Satellite Data Unit)…
That seems rather specific. Can that be linked somehow to the MCS-6000 system that was on board?
More in general: Some of the datasheets suggest that around 1 ppb stability over a day and similarly across a wide temperature range is indeed possible for a high quality OCXO.
Bill Tracy:
I think you can be 100% confident that there was no 4 Hz “drift” at ARC 5, or at any other time after a stable warm up period following the 18:25 reboot (call it 18:40 to be conservative). There is simply no evidence or data to suggest such drift occurs in the OCXO once at equilibrium. Again, throwing in a BFO drift assumption (for which there is no evidence) to make the data look more consistent with ANY path is turning the science on its head. Instead, we should rely on the wealth of experimental data available on OCXOs to conclude the drift, if any, between 18:40 and 00:10 was ~1 Hz max.
Niels:
Don and I both tried to find the original data sheet on the Racal part number 81771-MBE. We tried tracking down the people at Racal that were there at the time the OCXO was developed, but ultimately, we did not succeed. Basically, what we know is in the folder I linked above. Which is quite a bit actually. I think we can, as you note, assume drift over 6-24 hrs is <1ppb.
ALL: I would note that little has been said about the potential for a little turbulence or up/dn atmospheric motion to cause a short term anomaly in the BFO value due to the vertical speed sensitivity. A Vspd change of 250 ft/min for a few seconds (before the A/P adjusts) could cause a 4 Hz error.
@All: I apologize for any issues with the website loading in your browser, but Network Solutions sucks.
@DrB,
It may be weeks before I can get back to this. So two comments:
There was a time, say 3 decades ago, when I could have told you the fuel flow at 100% idle for a range of TPE331 engines and the expected increase of fuel flow for any load increase. I took time to look on the internet for similar information but fell short.
But, by just simply comparing the almost 40:1 overall compression ratio for the RB211 to (say) 11:1 for the appropriate TPE (and the APU in the B777) the fuel consumed for any given power output will be different. For example where a number of 60 kg/hr has been quoted in previous comments above as being a fuel flow for an APU load, it would be expected that the RB211 increase in flow would only need to be 50 kg/hr for the same shaft power.
Of course, this is only a “trim” in calculations, but it should apply to all auxiliary power offtakes from the main engine, when compared to the APU. (In case you conduct any re-evaluations.)
I previously mentioned perhaps duplication of parameters when considering your numbers of degrees of freedom in your statistical analysis.
My concern specifically related to EBTOR and SBTOR, (and the similar EBFOR and SBFOR), where EBTOR is the End BTOR value for any given leg, and SBTOR is at the start of the leg.
The EBTOR and SBTOR points and values have already been utilised in the BTOR analysis. Is there a potential when also using the EBTOR and SBTOR to provide another “independent” set of statistics, that all you are doing is producing unintended positive feedback and inadvertently introducing another degree of freedom, which may not in fact exist ?
@George C
Am I reading your comment, above, correctly: that there should be an empirical method to estimate power take-off loads, and impact on fluel flow, related to bleed air, the IDG and hydraulic pumps?
This is a great and comprehensive analysis of the data and if searched I hope for the families the wreckage is found.
I have followed HH370 for many years and it seems that information in the 17:07 ACARS report has been overlooked by many investigators.
The 17:07 ACARS report clearly indicates that the FMS cost index was set to zero very early in the flight and possibly even before takeoff from Kuala Lumpur.
The climb speeds that should be in the 310 knot range are closer to 303 knots and the cruise speed at top of climb is not mach.83as it should have been but rather mach.82 which is maintained until the transponder information is lost at 17:21. These are all indications of an maximum range flight plan and a cost index of zero.
The imputing of the zero cost index could have been an error by the flight crew since the recommended cost index was 52 which should have been set in the preflight check or the zero cost index was set deliberately. Either way if the cost index was set to 52 as it was supposed to be, we would have seen higher climb and cruise speeds in the ACARS report.
If the cost index was intentionally set to zero to extract maximum range from the aircraft, it suggests the diversion was planned well in advance. This means that activity like turning off the transponder and primary electrical systems as well as avoiding radar, flying along FIR boundaries and hiding in plain sight by flying along known airways with other traffic would be key strategies of a planned event.
With this in mind, we now have a very smart seasoned professional at the controls of the aircraft trying to make it disappear who probably flew the aircraft to the end. It would surprise me that someone making an effort to avoiding timely detection would even consider flying into the Australian Jorn radar detection and would avoid the area when the flight was preplanned. It really does not matter if Jorn was operational or not why take the risk.
Avoiding the Jorn radar area leaves only a small number of routes that can be flown at MRC cruise speeds and still meet all of the BTO timing and BFO error limits. In fact there is really only that, stands out, which has the major turn south at approximately 18:36 near waypoint ANOKO and flies along the fir boundary southward for 5 plus hours crossing the 7th ARC near 38S and 88.4E.
The 38S and 88.4E location on the 7th arc is well known and was identified by the investigation team early in the analysis of the MH370 diversion.
The aircraft range analysis done by Boeing sets the minimum range at 3494.3 NM at MRC cruise speeds and high altitude, which puts the aircraft at least 20 miles south of the 7th arc before fuel exhaustion on the ANOKO route.
The Boeing range analysis does not include the benefit in fuel savings from inoperative electric or pneumatic systems and the use of step climbs during the flight. The Boeing analysis also made an error in using ISA conditions rather than ISA+10.5 in the analysis which resulted in the aircraft needing to descent from 35000ft to 30000ft and fly at MMO speeds which resulted in significant additional fuel burn early in the diversion prior to the turn west at Penang.
Putting all this together the point of fuel exhaustion is probably closer to 100 NM south of the 7th arc on an extension of the route from ANOKO to the 7th arc crossover point at 38S 88.4E in the area near 40S and 88E
I hope the aircraft is found and appreciate the efforts of every one investigating the disappearance of MH370.
If nothing is found at the location you have identified in this paper a location closer to 40S and 88E should be seriously considered.
There is more detailed information on my Youtube channel at https://www.youtube.com/playlist?list=PLvJB8SSquiZAg6MIFIVjSe40rvN5jxVRS
@George G,
It makes sense that the fuel flow needed for a small additional load on the main engines would require slightly less fuel than consumed by the APU to drive the same load. Your estimate of 50 versus 60 kg/hr may be a reasonable guess. My fuel model has errors which amount to about 40 kg/hr at one sigma, so I won’t quibble over 10 kg/hr.
You said: “. Is there a potential when also using the EBTOR and SBTOR to provide another “independent” set of statistics, that all you are doing is producing unintended positive feedback and inadvertently introducing another degree of freedom, which may not in fact exist ?”
The correlation coefficients of the leg start and leg end values of the BTORs and the BFORs are statistics which certainly exist and which are independent statistical properties compared to the means and standard deviations. Sure, if you change a value of one BTOR you affect all three statistics (generally not in the same way), but that does not mean they are not independent statistics. It just means they all depend, in different ways, on all the values in the data set.
Troy: Welcome to the blog.
I am interested to see how your proposed route at MRC will satisfy the BTO criteria, as paths crossing the arc that far south require higher speeds. Do you have a table of Mach number, position, groundspeed, altitude, and BTO error at each ping?
@Don,
Both engine manufacturers should have data on incremental changes to loading, and the effect on other parameters such as fuel flow.
If the OEM was asked for specific examples, then this may be of value.
I’m not sure if that answers your question, but a short answer is all I can offer now.
Troy Smith wrote: “It would surprise me that someone making an effort to avoiding timely detection would even consider flying into the Australian Jorn radar detection …”
Curiously, the flight path drawn in Diagram 4 of “SKMM ANALYSIS” (Folder 4, by the RMP), depicting the data from Zahari Shah’s flight simulator of a route to the SIO, passes squarely through the coverage zone of JORN Radar 2 centered on Laverton, AU. Doubt it means anything.
@Troy @All
I recently discovered a nice summary of JORN on TikTok. Short answer: not much potential to see MH370.
I agree with Troy about active pilot to end and fuel savings mode but I see that ending curved path to 31-33s area. CI=52 is not too much different than CI=0, whereas LRC is approx CI=200. Sim cases CI=0 apparently.
See TikTok for nice JORN summary:
https://www.tiktok.com/@hypohystericalhistory/video/7211639000853908737
Whatever the details on JORN, the unknown would be alleged perpetrators perception of JORN.
@Troy Smith: If you’re still with us…I’m also curious how you calculate the ECON speed as a function of CI, weight, altitude, and wind, and in particular, the MRC speed (CI=0).
@Troy,
Re Cost Index.
I disagree with your assumption that the CI was reduced to zero.
On a RB211 powered 777, the flight planned CI52 would produce a climb speed of 303kts and a cruise speed at FL350 of about .82. Exactly as we see in the ACARS reports.
Perhaps you’ve looked at GE powered 777s which have a slightly higher speed for a given CI.
Thanks for all the comments
For those interested I have added the details of one of the flight possibilities from ANOKO to 38S 88.4 to the description in the 6th video in my Series. ref https://www.youtube.com/playlist?list=PLvJB8SSquiZAg6MIFIVjSe40rvN5jxVRS
Troy Smith: I’ll try one more time to get answers:
1. How did you determine that the Cost Index (CI) was set to 0 during the climb out of Kuala Lumpur? How do you calculate ECON speed as a function of weight, altitude, CI, and wind?
2. Please show the BTO residuals at each ping time that allows you to conclude it was possible to reach your endpoint at MRC (CI=0) speed.
Note that a range calculation alone is not sufficient to ensure that the BTO error criteria is met.
1) Cost index
The B777-200ER Cost index has a value 0 at MRC and 180 at LRC and effectively mach.87 at a cost index over 1000 . Optimum altitude mach numbers are around .82 and .84 respectively and .87 at MMO. By fitting a curve to these three points the result at a cost index of 52 the mach is .827. I saw a fuel model a while ago on another MH370 Search website which confirmed this value.
When MH370 reached top of climb the initial Mach number was .819 at 17:01 and when adjusted for wind speed stabilized at Mach .821 by 17:07.
At the initial top of climb MH370 the aircraft weighed 481880 pounds and 35000 ft where a zero wind mach number of .819 would be expected. If the cost index was set to 52 we would have seen an initial cruise of around .827 and stabilize at around .829 with wind.
Using a similar analysis a cost index of 0 provides a climb speed of around 303 knots, at 52 has a climb speed around 305 knots and LRC has a climb speed of 310.
2) MRC Flight Path
I added the details of the flight leg from ANOKO to 38S 88.4E to the description of the 6th video in MH370 series on my Youtube channel mentioned in a previous email I found an error so I revised the description this morning and included the data here as well.
This flight leg is flown at mach.82 with the expectation that optimum altitude would be used efficiently throughout the flight leg. The BTO and BFO residuals are included in the last 2 columns. The residuals have not been modified by adding any vertical speeds. MH370 Flight Path Model V13.1 was used.
Location Time Interval Latitude Longitude Interval Total
Time Distance Nm Distance Nm
ANOKO 18:36:12.000 0.00 7.14 94.42 0 0
Com1 18:38:55.663 0.05 6.63 94.37 22 22
ARC2 19:41:02.906 1.02 -1.45 93.57 492 514
ARC3 20:41:04.904 1.00 -9.45 92.49 484 998
ARC4 21:41:26.905 1.01 -17.47 91.53 481 1479
ARC5 22:41:21.906 1.00 -25.45 90.42 481 1960
ARC6 00:10:59.928 1.49 -36.96 88.58 696 2656
ARC7 00:19:29.416 0.14 -37.97 88.40 62 2717
Wind Wind Altitude SAT TAS Ground BTO BFO
Direction Speed Ft C Knots Speed Knots Residual Km Residual
Kmh Km Hz
265 12 35000 -43.56 484.16 484 N/A N/A
173 3 35000 -43.56 484.16 484 N/A 2.86
84 48 36000 -44.56 483.11 484 13.78 7.00
90 27 36000 -44.56 483.11 484 1.57 -1.11
70 11 37000 -45.45 482.28 481 1.75 -2.29
275 68 37000 -45.96 481.76 481 2.12 -1.98
235 73 40000 -55.14 471.8 466 .85 -4.67
240 94 40000 -55.54 471.4 440 .28 -78.4
I have tested other very similar flight legs at slightly lower cruise speeds which improve the BTO residual a 19:41. One example is the route from ANOKO to Davis Station on Antarctica. I did a sensitivity analysis of the BFO residual 19:41 and found that only a change in ground speed and climb rate significantly affect the residual. Since the aircraft is flying at a constant mach number as is accomplishing step climbs, to optimize altitude, a 300 ft per minute climb rate at 19:41 reduces the BFO residual to almost zero.
Note: the flight path has not been modified from the great circle route and is flown as a single leg without waypoints that allow minor turns at the arcs to optimize the BTO residuals.
I hope this answers your questions
When I drafted the email everything looked OK but I see the columns and headings are no longer lined up after posting.
Pleased refer to my 6th video for any clarifications
@Tim @Troy @Victor
Re: Cost Index, can we compare to MH371 ACARS to see if any difference?
Also I believe DSTG report refers to MH370 prior day ACARS data (which I’d love to see – but that is probably yet more undisclosed crucial evidence).
Somewhat related nagging history question for me, do I recall correctly for MH370, the ACARS gave us some curious bleed air/ventilation settings? I am wondering how that compares to MH371, but I do not recall similar data for MH371.
@Troy,
Re Cost Index
Thanks for your answers.
I agree that a cost index of 52 will produce a speed of close to .83 at optimum altitude. However, MH370 at FL350 was a little lower than optimum, so a CI of 52 will be closer to .82
In the recent thread above, it appears that flight level and geometric altitude are sometimes used interchangeably, making it hard to tell if there is a math mistake, or just sloppy style. For example, GDAS winds are generally specified at a geo altitude, so winds at 35,000 feet are not the same as winds at Flight Level 350 (which, from memory, was about 37,200 feet at KB). Let’s be precise so we can all be sure to understand what is intended.
@Troy Smith: Thank you for your response.
As @Tim says, the ECON speed with vary with altitude (and weight and wind), so your values are only approximate.
There is something wrong with your path reconstruction. Back in 2017, I investigated great circle paths at FL350, and concluded that anything south of 34S requires speeds greater than LRC, which is significantly greater than MRC. Perhaps you are not properly accounting for wind or temperature, or your MRC speeds are wrong.
https://mh370.radiantphysics.com/2017/10/22/possible-mh370-paths-along-great-circles/
ALSM –
GDAS is tabulated at pressure levels, as documented here:
https://www.ready.noaa.gov/gdas1.php
Geometric altitudes were greater (thus, 37,000 feet for FL350).
All –
The Mach number reported in the ACARS position report has a fair amount of jitter. The DSTG book, Chapter 9, provides numerous examples of how Mach values behave with time (in graphical form, unfortunately, so you have to digitize them to get quantitative information.) During quiet periods the jitter has an rms scatter of .005, but during noisy periods can be twice as large. Thus, trying to infer what cost index is being used based on only two samples is going to be quite unreliable.
Because the Troy Smith flight path allows “… minor turns at the arcs to optimize the BTO residuals”, it is not a great circle path, and the BTO residuals cannot be used to assess the correctness of the route.
@Troy
Using DrB’s fuel model:
FL350
dSAT=9 deg C
Aircraft wt= 200 tonnes (~Arc2)
Results:
LRC=485kts
MRC=467kts
So the speeds you are showing seem more consistent with LRC. Your path is fairly typical: mostly straight to nominal 38s and nobody in the past has suggested that is an MRC path. Whereas I actually agree with you that MRC may have been an active pilot’s priority, I would tentatively consider it one weakness of the 38s argument that it requires more speed/uses more fuel.
sk999:
Yes, GDAS winds are “…tabulated at pressure levels…”, but the height is also provided for each pressure level. For example (from a GDAS data set):
hPa HEIGHT m
1000 110.4
975 322.7
950 540.1
925 761.3
900 988.6
850 1457.3
800 1949.3
750 2466.9
700 3013.5
650 3592.2
600 4208.4
550 4868.3
500 5578.9
My request to all remains. Please don’t leave me wondering if you meant FL or altitude. Sorry to be picky.
ALL
Thanks for all of the comments on the flight leg from ANOKO to 38S 88.4E.
I will try to clarify what I am doing.
In my analysis, the altitudes are not Flight Level but altitude in feet above sea level as is expressed in the MH370 17:07 ACARS report and in the International Standard Atmosphere information.
I verify my calculations related to MACH number and TAS using an online tool called AEROToolBox (ATB) at the following link; https://aerotoolbox.com/airspeed-conversions/
At 17:06:43 UTC according to the ACARS report the aircraft is at 35,004 feet above sea level and flying at MACH .821 and the SAT is -43.8 C which is a delta of 10.542C from the ISA temperature of -54.342C.
With these parameters input into the ATB tool the calculated TAS is 484.5 Knots.
Flightdata24 recorded the portion of the MH370 flight up until the transponder was turned off and showed a ground speed of 468 knots.
According to the 17:07 ACARS report the windspeed was 17.13 knots at 70 degrees true and the aircraft heading was 26.7 degree which is a 43.3 degree delta. The result is a head wind is calculated at 12.38 knots with gusts.
This data confirms the true airspeed of NH370 at MACH .821 was at least 480.4 knots.
The SAT temperatures are even warmer on the northern part of the leg from ANOKO to 38S 88.4 with negligible wind. The resulting true air speeds and for the most part the grounds speed are very close to the 484 knot used in the flight leg analysis provided.
The winds in the model are taken at 250 HPA (34000 ft)
I want to clear up one comment about small turns at the arcs. I don’t support the concept of allowing turns at the arcs to make specific routes work. The information I provided does not have any turns at the arcs it is a great circle path.
for your information
Troy: This is a good example of the confusion I am pointing to. You state:
“At 17:06:43 UTC according to the ACARS report the aircraft is at 35,004 feet above sea level”.
The complete quote from the final report is as follows:
“The last position report transmitted via ACARS at 1707:29 UTC, 07 March
2014 [0107:29 MYT, 08 March 2014] recorded remaining fuel of 43,800 kg
at 35,004 ft altitude.”
In either case, the ACARS altitude (35,004 feet) is Pressure Altitude, not geo altitude. That is FL350, not 35,000 feet above sea level. Geo altitude was about 37,200 feet given the barometric pressure at that time and place.
Troy Smith: “The information I provided does not have any turns at the arcs it is a great circle path.”
The path from Com1 to ARC2 arrives at ARC2 on a ground track of 185.673 degrees. It departs from ARC2 for ARC3 on a ground track of 187.659 degrees. That’s a turn of about 2 degrees.
This result holds regardless of whether I use a spherical earth model (which is where the term “great circle” strictly applies) or for a WGS84 spheroidal earth model (where the more proper term is “geodesic”).
Thanks sk999
There was a typo in the longitude at 19:41 is should read 93.389678 or 93.39.
The BTO residual value of 13.78 is correct.
The track should be from ANOKO to 38S 88.4E should be 186.67 all the way according to Google Earth Pro.
@troy, That would be initial bearing. Being a great circle, the track angle will change as you proceed south.
Anybody know what happened to aqqa.org ?
http://www.aqqa.org/cgi-sys/suspendedpage.cgi
@Ventus45
Looks like Barry didn’t pay the bill.
Try the Wayback Machine if you haven’t already…
https://web.archive.org/web/20210509162615/http://www.aqqa.org/
Thanks George.
Downloading all of it this time in case it “vanishes” !
@Victor
I went though the information in the route analysis paper done in 2017 as you suggested, and in that paper, it does state that LCR speeds are too slow after 34S. The paper then goes on to use constant Mach numbers for locations south of 34S. The most southern location identified in the paper is 40S with a Mach number of .842.
What I found very interesting is that the paper identifies that a route to 38S south is possible with a constant Mach number.
The only real difference between the route I proposed and the route to 38S identified in the paper is that the use of step climbs to maintain a constant Mach number rather than setting a constant Mach number on the FMC and flying at 35000 ft.
It seems there are a number of analysts who agree that a route to location at 38S, identified by the ATSB and in the book Bayesian Methods, which meets all of the BTO, BFO and fuel requirements is reasonable.
The question is why has it not been pursued further?
In my opinion the results of the many debris drift studies have turned the focus away from this area rightly or wrongly but when I discovered that a Drifter Buoy, number 9422068, traveled from 41S and 79E, passed through the search area south of the 7th arc and then all the way to reunion island in less than 500 days I became skeptical of the drift studies that limited the location to north of 34S.
The route of this drifter buoy is included in the 6th video of my YouTube series at time stamp 5:20.
As I mentioned before if nothing is found at the other proposed search areas the area near 40S and 88E south of the 38S 88.4E location should be seriously considered.
I agree that the optimum altitude for a cost index of 52 is above a pressure altitude of 35000 ft and in my previous response the Mach number was adjusted accordingly. Below is a summary of a more detailed analysis.
The optimum pressure altitude at zero wind in ISA conditions for the different Mach numbers at a gross weight of 481880 pounds is shown below;
Cost Index 180 Mach .84 36000 ft
Cost index 52 Mach .83 35350 ft
Cost index 0 Mach .82 34700 ft
The expected Mach numbers adjusted to a pressure altitude of 35000 ft are as follows;
Cost index 180, Mach .832
Cost index 52, Mach .827
Cost index 0, Mach .820
This information is derived from a B777-200 fuel mileage chart which can be found on page 34 of a very informative Boeing presentation. The link is; http://aviation.itu.edu.tr/%5Cimg%5Caviation%5Cdatafiles/Lecture%20Notes/FundamentalsofAirlineManagement20152016/Lecture%20Notes/10.1-ITU_Airplane_Performance.pdf
The fuel mileage chart shows that at an optimum pressure altitude of 35000 ft the and at an LRC cruise at Mach number of .84 the aircraft gross weight is 500,000 pounds. Although the fuel mileage in the chart represents GE90 engines and would not be correct for the Trent engines on MH370, the aircraft performance with regards to altitude, aircraft weight and Mach number would be the same.
Even with small data errors in the 17:07 ACARS report, which indicates a Mach number of .821, there is enough difference between the Mach numbers shown above to clearly identify that the cost index was set to 0 and not 52.
@Troy,
Re Cost Index
I’ve checked on the FMC for a RR Trent powered 777.
Cost index 52 gives climb speed 303kts and a cruise speed of around .82 at FL350.
Cost index 0 gives climb speed 293kts and a cruise speed of .815 at FL350.
So the ACARS speeds are entirely consistent with CI52. Even If the CI was changed, that is still normal in aircraft operations. Not a sign of anything unusual.
If I may say, the other 2 reasons you mention in your video as being an indication, all is not normal, leading up to IGARI, namely…..
The 2 ‘maintaining FL350’ and the lack of frequency read back in the final call, are to me perfectly normal.
The ‘maintaining’ calls are usually a hint to ATC to give further clearance. In this case, 9 out of 10 times on this route FL370(370 also the call sign) would have been the initial level, the FMC would have indicated it as being the optimal level. Perhaps the Captain who does this route many times had forgot that on this occasion the FO had earlier requested FL350. The flight plan had on this occasion worked out an initial level lower than FL370 was marginally more efficient.
Not always including the onward frequency is completely routine.
So I see absolutely nothing unusual until something happens at 17:21
@Troy Smith said: Although the fuel mileage in the chart represents GE90 engines and would not be correct for the Trent engines on MH370, the aircraft performance with regards to altitude, aircraft weight and Mach number would be the same.
Why?
@All
Flight Safety Detectives – Episode 164
https://www.youtube.com/watch?v=mnQTeuQFQKQ
Re MH370
Todd Curtis – at 18min46sec
“There will be a day when the wreckage will be found, and I can almost guarantee, that anyone listening to this broadcast in the year 2023 will not be alive when that happens.
Greg Feith – at 19min00sec
“And if you watch the Netflix special about it, uhm, it’s probably 5 minutes of fact, and hour and a half worth of fiction, but it, that’s a story for another day”.
@Ventus45
Well I guess it’s safe to bet a steak dinner that I know where MH370 lies since I won’t be be around to pay up when I loose 😉
@All
I drop in from time to time to see what the current trend is like. This is the first time in years that the discussion has been returned to the path being defined by the flight parameters and I am glad to see this.
Also, there has been more serious discussion of the possibility of a glide phase. There were always two end-of-flight scenarios: piloted or un-piloted, but the former was given short shrift, usually based in the impossibility of a pilot surviving till the end. I recall that the pilot’s oxygen is sourced from a rather large oxygen tank, yet it never seems to factor into the discussion. Why?
As for the glide scenario, I have two separate comments:
If there is a piloted descent, the distance is likely to be weighted towards the longer glide, since otherwise there would be no reason for a controlled descent and; the presumption that the azimuth of flight remains consistent with the previous track may not be easy to support. A turn to the left (probably by less than 90 degrees at any time after the 6th arc would be difficult to discern in the data set. (These comments are made from memory.)
Finally, as for the search area….
I believe that I understand rudiments of the Bayesian approach. There have been, I believe some relatively qualitative discussions of how to delay with the area previously searched and might suggest that, apart from searching those areas previously searched where there are known gaps in coverage or very difficult terrain, isn’t it more productive to search the area further beyond the 7th arc than has already been searched?
@DrB Thank you for revisiting the more southerly arc intersections by confirming that they can be reached with plausible fuel consumption models and flight paths.
Sid: Re: “There were always two end-of-flight scenarios…”. Actually, there are 3 basic EOF possibilities: 2 piloted and 1 un-piloted. If the PF was in control to the end, he could have tried to glide some distance past MEFE, as you and others have suggested. But I believe that, if the PF was in control at the end, it is more likely he pushed the nose over into a steep descent and crashed close to the 7th arc. This is the only way to explain the 00:19 BFO data, and it is also more likely given the missing IFE logon. So, in 2 out of the 3 possibilities, the plane is likely near the 7th arc (within 25nm).
@airlandseaman:
……it is more likely he pushed the nose over into a steep descent and crashed…..
I think not.
A high speed entry shreds the aircraft producing millions of pieces of debris (SwissAir-111).
If Z had gone all the way to the end, it is reasonable to assume that minimising debris would have been his logical priority.
Therefore, he needed a “plan A” and a “plan B”.
Plan A would be to do a controlled ditch, but given the know sea states and winds, a ditching is not likely to be very successful from a debris minimisation viewpoint.
Plan B would be to do a very low level wind up turn just above the waves, leading into a sharp sudden stall break / autorotating departure, going straight in, at very low forward speed, and very low vertical speed, just like CZAR-52.
(https://de.wikipedia.org/wiki/B-52-Absturz_auf_der_Fairchild_Air_Force_Base#/media/Datei:FairchildB52Crash.jpg).
The turn radius is minimal about a precise center (https://upload.wikimedia.org/wikipedia/commons/thumb/7/75/Fairchild_B-52_crash_overview.png/800px-Fairchild_B-52_crash_overview.png).
From commencing the turn to impact was only 27 seconds.
(https://www.youtube.com/watch?v=7-S_NM–evM).
The resulatant “debris patch” is also quite small and compact.
(https://www.baaa-acro.com/sites/default/files/crash/images/61-0026-2.jpg).
I think that in the known environmental circumstances, Z might have emulated CZAR-52.
Ventus45: You are ignoring the evidence indicating a very high rate of descent.
Ventus45: I would add…I see no reason or evidence to support the statement ” it is reasonable to assume that minimising (sic) debris would have been his logical priority.”
@Ventus45
Re: Flight Safety Detectives
Thank you for finding that brief segment, but if MH370 is those experts “favorite topic over the last 9 years”…have they ever said more than 1 sentence about it? All we have is the former Boeing guy thinks the search will be fruitless in our lifetimes, which I tend to agree.
@Sid Bennett
RE: “There were always two end-of-flight scenarios: piloted or un-piloted, but the former was given short shrift, usually based in the impossibility of a pilot surviving till the end. I recall that the pilot’s oxygen is sourced from a rather large oxygen tank, yet it never seems to factor into the discussion. Why?”
Assuming the aircraft was depressurised, there was sufficient oxygen for the duration of the flight; however, hypoxia is not the only consideration. There are two reasons the pilot likely became incapacitated before the end-of-flight:
1. Breathing 100% oxygen at ambient pressure only provides protection against hypoxia up to an altitude of about 40,000 ft. Above that altitude, oxygen must be used at positive pressure to ensure there is sufficient oxygen saturation of the blood as it passes through the lungs.
Positive pressure breathing (PPB) is difficult, especially for those who are not trained in the technique. It can lead to hyperventilation and other harmful effects, including respiratory collapse. PPB training is normally done by military fast-jet pilots, but not by airline pilots. The oxygen masks typically used by airline pilots (including those onboard MH370) provide positive pressure above a cabin altitude of about 30,000 ft, so the deleterious effects of PPB might well have become apparent even if the aircraft did not climb above 40,000 ft.
2. Unpressurised flight at high altitude has a significant risk of decompression sickness (DCS). DCS can become apparent at cabin altitudes as low as 18,000 ft and is increasingly common above 25,000 ft. The effects of DCS include joint and limb pain (the “bends”), and respiratory disturbances (the “chokes”) that can cause cardiovascular collapse. Those effects are exacerbated by high altitude; the duration of exposure (as little as five minutes at high altitude); coexisting hypoxia; and the age, body build and general health of the individual.
The aircraft captain was 53 years old and, according to his leaked health records, was overweight and a smoker. Those factors, combined with prolonged exposure to a high cabin altitude, would have placed him at significant risk of severe DCS that could very likely have caused incapacitation.
@TBill
Re: [“favorite topic over the last 9 years”…have they ever said more than 1 sentence about it ?]
Yes they have, in a couple of previous episodes, but off-hand I forget which ones.
All episodes are listed here:
https://flightsafetydetectives.com/category/episodes/
@TBill
MH370 – Flight Safety Detectives – Episode 87.
https://www.youtube.com/watch?v=skCl-EyXRRE
From 35 minutes in.
@Ventus45
That was very good link to Flight Safety Detectives Ep. 87, thank you.
My thoughts almost exactly.
@TBill said: My thoughts almost exactly.
I don’t think you realize they were referring to the Byron Bailey / Simon Hardy / Mike Keene area around 38S. That’s a long way from your preferred spot.
I do think the ATSB gets a bad rap from this group. It was not unreasonable to consider an area close to the 7th arc with a short glide before searching any areas further from the arc, especially since the forensic analysis of the flap suggested the flaps were up when the plane hit the water, and the final BFO values show a downward acceleration of 0.7g. Although the ATSB has been diplomatic about not publicly blaming the pilot, that doesn’t mean they are not willing to consider this scenario when defining search areas.
@Victor
I suspected those 38s guys, who believe was a deliberate flight (which I agree with philosophically). They need to realize that there could be other end point explanations for deliberate flight. That much I would advise Flight Safety Detectives, if I could.
@TBill: Good luck. My observation is that group doesn’t listen to others, as they are quite certain about their work.
George Tilton wrote: “Well I guess it’s safe to bet a STEAK DINNER that I know where MH370 lies since I won’t be be around to pay up when I loose.”
You are clearly not much of a risk-taker. Byron Bailey is much more aggressive. Regarding the location of MH370, he was quoted as saying:
“I’m so sure. I’d bet MY HOUSE on it. As far as I’m concerned it’s game over, we know where it is, we’ve always known where it is.”
https://www.todayonline.com/world/id-bet-my-house-it-australian-pilot-claims-he-knows-exactly-where-mh370-wreckage
Of course, he, too, won’t be around either when required to sign over the deed.
OK but I agree with almost everything that the Flight Safety Detective said in Episode 87 above.
Bailey is a different story, but I probably agree some of his scenario. I could use a nice house in OZ.
@Tim
Tim wrote
“I’ve checked on the FMC for a RR Trent powered 777.
Cost index 52 gives climb speed 303kts and a cruise speed of around .82 at FL350.
Cost index 0 gives climb speed 293kts and a cruise speed of .815 at FL350.”
This data really helps my investigation
A couple of things always bothered me about the data in the 17:07 ACARS report.
In the 17:07 UTC ACARS report the calibrated airspeeds for the last 2 data points at 17:01:43 and 17:06:43 are 278 and 278.4 knots respectively and when these are converted to mach numbers the result is .816 and .817.
The transponder GPS data shows ground speeds of 467 and 468 knots for the same data points.
When these ground speed, are adjusted for the head winds identified in ACARS report the resulting mach numbers are just slightly less than at mach .812 and .814 respectively.
Knowing that the winds tend to be somewhat variable the true mach number could be closer to .816.
These mach number are far below the mach numbers of .819 and .821 listed in the 17:07 ACARS report.
A previous commenter indicated that there could be significant error in the ACARS reported mach numbers.
Using the data that a 303 knot climb speed represents a cost index of 52 and a mach number of .815 indicates a cost index of zero and rejecting the 17:07 ACARs report mach numbers, of .819 and .821.
It would seem that the cost index was set to 52 during the preflight and then changed to a cost index near 0 just prior to top of climb with the resulting wind adjusted cruise mach number of .816.
Thoughs?
@Victor
Victor wrote
“@Troy Smith said: Although the fuel mileage in the chart represents GE90 engines and would not be correct for the Trent engines on MH370, the aircraft performance with regards to altitude, aircraft weight and Mach number would be the same.
Why?”
These type of fuel mileage charts use engine net thrust, aircraft gross weight at an optimum CofG for the loading of fuel and cargo resulting in a minimum of trim drag.
These baseline assumption essentially zero out and size of weight differences between engines especially on the small speed variation between MRC and LRC.
Since the chart is for a GE engine and TSFC is different between engine types the fuel mileage values would not be accurate for the Trent
@Troy
Have you looked at MH371 data to see if that supports your premise of CI=0?
Also, I am thinking MH370 ACARS data (for the day before flight) 7-March is available to ATSB/DSTG, if so, I would like to ask if that data could be made available at least under agreement to IG or other experts.
@Troy Smith said: Knowing that the winds tend to be somewhat variable the true mach number could be closer to .816.
These mach number are far below the mach numbers of .819 and .821 listed in the 17:07 ACARS report.
When you convert TAS to GS, you have to include the effect of flight path angle (FPA) in addition to wind. Even with no wind, the TAS would be higher than the GS in a climb or descent, i.e., the GS is TAS x cos (FPA) with no wind.
@Tim: What are you using to determine the ECON speeds?
@Victor,
To check to CI speeds in the FMC I used a takeoff weight of 224T and a headwind at TOC of 20kts.
@Troy
Why don’t you believe the Mach nos from the ACARS report(.821 and .819) ?.
Trying to calculate backwards from temperature and the wind vector is bound to introduce inaccuracies.
@Tim: My question is what reference do you use to determine the speed as a function of those input parameters.
@Andrew. My understanding is that cost indices can be recalculated daily. Maybe this is mostly for route change and expected conditions and perhaps includes estimations of such as APU ground run time and taxying – and even the drag from the fuel load intended for diversion.
Presumably fuel price estimations (proportions of fuels loads in storage, bought at different prices) would be recalculated at the time of a change in delivery price and that would be infrequent? I gather there can be an airline fuel price committee specially for this so perhaps the review can be continuous.
In any event it seems likely that there would have been a difference between the cost indices’ calculations for the intended Beijing destination and those that would apply to the actual route.
If so, are there any possible implications in calculating what would have been Econ51, LRC etc speeds and altitudes of the actual flight, such as UGIB’s, vis-a-vis those supposed in the flight plan?
Also, is it likely that a pilot would intervene to make adjustments in this case? I gather that interventions are not uncommon in normal operations.
airlandseaman says: “… minimising (sic) …”
is correct British English
@David
Theoretically, a different cost index (CI) could be calculated for every aircraft, route and day, but that’s a complicated process. In practice, airlines use several different CI strategies, according to their needs and resources. Some use a variable CI that’s route specific and can change from day-to-day, normally in response to the fuel price. Others use a fixed CI that’s applied to every route operated by a particular aircraft type, while others use a fixed CI that’s route specific. In both the fixed CI cases, the CI might only be updated every 3-6 months.
In normal operations, pilots are expected to use the CI that’s annotated on either the computer flight plan or the company route manual. However, they sometimes vary the CI for operational reasons. For example, in the case of a delay, they might use a higher CI to meet a curfew, or to ensure the crew flight time limitations are not exceeded.
In the MH370 case, the flight was planned at ECON speed with CI=52. I don’t know if that CI was specific to the Beijing route, or if it was a fixed value that Malaysian applied to all the routes the airline flew during that period. In any case, the use of ECON speed with a specified CI is intended to minimise the cost of a flight. It’s irrelevant for the diversion route flown by MH370. Given the circumstances, it seems more likely he would have used a range of speeds according to his needs at the time.
@Victor
@Troy
Benchmarking Troy vs. UGIB (and assuming no math errors)
Troy-Arc2 to Arc7=2203nm
UGIB-Arc2 to Arc7=2220nm
Additionally, I tentatively agree with Troy that the Arc1 to Arc2 distance from 18:25 to 19:41 is probably feasible at approx LRC speed as Troy shows it.
However, in making this last comment, I have to consider that the apparent “OFFSET” in progress at 1825 to 1828 is possibly to the left to B466 (and not to the right). A disadvantage of the “standard” OFFSET assumption of a right/north offset is that it adds about 45-nm of distance and time after 1825, which I also have started to question.
In summary, without the OFFSET, Troy is able to start out with Arc2 at -1.45 South, which allows slightly less miles Arc2 to Arc7 compared to UGIB.
@Victor
@Troy
Final comment for Troy’s path (which presumably may also apply to UGIB) is that I estimate the following:
Troy’s path after 1825: 2821nm
Boeing furthest distance after 1825 MRC/FL400: 2806
Adjusting Boeing for LRC = 0.99 x 2806 = 2778-nm
Assuming Troy’s path is approx LRC the distance to Arc7 exceeds my expectations by about 43-nm (based on the Boeing number). Of course herein I am not accounting for maneuvers or FE before Arc7.
@Andrew. Appreciate that thanks. A 747 simulator instructor I have spoken with remarked in passing that once away from pursuit he might have chosen a constant Mach.
“Some use a variable CI that’s route specific and can change from day-to-day, normally in response to the fuel price.” My interest in part was from wondering whether comparisons with other 9M-MRO and MH370/71 flights might be affected by different ‘datums’ but I infer that that does not an issue.
@David, for what it’s worth my path solution works out at M0.870 Khota Bharu to Penang and M0.840 thereafter. No further decimels required!
@Victor
@Troy
Correction to my last post (courtesy Troy on his YouTube page):
Boeing’s 2806-nm max range @FL400/MRC assumes Arc1 is 18:28 (not 18:25).
Therefore Troy’s path to 38s appears good to me on fuel: it is in approximate agreement with the Boeing max range, adjusting for LRC vs. MRC.
Relative to UGIB to 34s, seems to me Troy’s path to 38s is similar fuel requirement, with the following provisos:
Reaching 38s requires:
(1) no right OFFSET from N571
(2) no effort to circumnavigate nor descent to avoid Indonesian FIR/radar
To me this means critiques of 38s need to be other than fuel. For starters, do I think an active pilot’s plan was to imitate a ghost flight starting at ANOKO and challenge Indonesian FIR/Radar? No I do not think so.
Here’s an interesting calculation. On flight MH371, roughly half of all SATCOM transmissions were sent via the POR satellite, 3-F3. At 6:23:50 UT, the satellite was exactly over the equator, meaning that the Doppler compensation calculation was exactly correct (aside from a small inaccuracy due to using the wrong altitude.) What that means is that the BFO is now insensitive to the aircraft speed and direction of travel. What remains is sensitivity to the Doppler due to the motion of the satellite, and that depends almost entirely on the latitude of MH371. Thus, with a bit of reverse engineering, one can derive the latitude of MH371 at that time from the BFO alone.
As luck would have it, there was a set of bursts via 3-F3 at 6:17 and another at 6:29. Interpolating between the two, I get a measured BFO at 6:23:50 of 165.4 Hz.
What latitude would be needed to account for this value for the BFO? Based on previous work that I did on this set of data (and accounting for the inaccuracy due to the wrong altitude), I predict a latitude of 9.0 degrees. What was the actual latitude from the ACARS data? It was 8.1 degrees. Pretty good, eh?
Admittedly, the accuracy of the method is not all that great – a change of 1 degree in latitude changes the BFO by only 0.8 Hz. The sensitivity would be is 1.6 times greater for 3-F1 due to its higher inclination. For 3-F1, the next equator crossing would have happened around 01:35 UT, just over an hour after the last transmission and 19 minutes after the last log-on interrogation.
@Tim
I believe the mach number values in the ACARS report are valid.
When I suggested to reject these values, what I meant, was to reject the hypothesis that these Mach number values are one of the primary speed inputs with regards to Cost Index in Econ Mode.
The primary data source in for all of the aircraft performance and control functions as well as Cost Index in Econ Mode is the airspeed.
When the FMC is in Econ mode the Mach number is an output of the calculations and does not control the speed of the aircraft.
The question then becomes, what is the cost index that corresponds to an airspeed of 278.4 knots?
The following conditions should be present, a gross weight of 481600 pounds, cruise pressure altitude 35000 feet, zero rate of climb, atmospheric conditions ISA + 10.542C, winds 17.13 knots at 70 degrees, an aircraft track of 25 degrees, an aircraft true heading of 26.7 degrees, a true airspeed of 480 knots and a ground speed of 468 knots.
Is that something your able to answer?
Re: above
Assuming I am doing the math correctly, DrB’s fuel model gives:
488 TAS for CI52 (282.1 KCAS)
481 TAS for MRC (277.6 KCAS)
(wind field/heading not included above calcs)
@Troy
I don’t think we are able to micro-analyse the speed data to the extent that you are trying to do. We only have 2 ACARS cruise data snapshots. Under normal circumstances the speed will fluctuate typically +-5kts due to mainly wind changes. Although I think the any wind changes were fairly benign that night.
So I think it is unrealistic to say, anything other, than the set cruise speed was, just under M.82.
https://reports.aviation-safety.net/2014/20140308-0_B772_9M-MRO.pdf
In ACARS report table 1.9A (page113) says Longitude 102.713 at 17:0643 then Figure 1.9H says Longitude 102.813 at 17:0643 (page 114) which one is correct. A difference of 11.07km.
@Joseph Coleman
102.813 is correct. Whoever typed the data into table 1.9A mistyped it.
@sk999: your comment is interesting. In case I understand you correctly, you are talking about MH371 throughout your entire comment, right? What do your findings mean for MH370 ?
@sk999
I previously noted that the 2nd Arc was near tangent to the satellite, with both 2nd and 3rd order curve fits to BFO, and might be used as a null point. If the SDU was calculating only equatorial orbit, does the known 3F1 velocity at 19:41 give us a BFO baseline correction factor?
@Tim
I mentioned before that I thought the Mach numbers of .819 and .821 were valid.
I also feel the the calibrated airspeeds of 278 and 278.4 are also valid.
We have the transponder speed and position data from the departure up until the time the transponder was turned off.
All of this data needs to reconcile when cross checked.
If the Mach number of .821 is accurate that would mean that TAT of -13.1 starting at a SAT of -43.8 should be correct.
What I found is that in order to achieve a TAT of -13.1 the ratio of specific heats, normally 1.4 for dry air, needs to be 1.397 indicating the air is not dry and some humidity is present.
If the 1.397 ratio of specific heats is used to calculate a true airspeed near to 480 knots, the universal gas constant also needs to be lower which also indicates some humidity was present in the atmosphere.
Considering where the aircraft is a 17:07 UTC and the wind direction, the moist air from the Gulf of Thailand would be moving over the land there.
When I looked at the True Airspeed of 480 knots with a calibrated airspeed of 278.4 knots I also found the air density needs to be slightly higher than that predicted in an ISA +10.542C atmosphere model.
By adjusting all of these parameters it provides a solution to validate all of the data in the ACARS report with the transponder data .
The data also supports the possibility that the Cost index was changed from 52 to 0 at top of climb.
I think that there will be no right answer to the question of where MH370 ended until it is actually found.
I think we owe it to the families of the lost souls to investigate and identify all of the possible locations and prioritize them so that when and if a new search starts a proper search plan can be made.
comments?
Peter Norton,
Yes, my comments, aside from the last paragraph, referred to MH371.
As far as relevance to MH370, the calculation cannot be applied directly since MH370 disapeared before 3-F1 had crossed the equator. However, it serves as a reminder that the Doppler compensation error contains two contributions, one that depends primarily on the N/S velocity of the aircraft, and the other that depends primarily on the position (i.e.,latitude) of the aircraft, and the relative contributions of the two changed during the flight south, with the first being dominant at the 2nd arc while the second was dominant at the 7th arc. We don’t really care how the plane flew, just where it ended up.
370Location – at the 2nd arc, the Doppler compensation error was dominated by the unknown N/S velocity of the aircraft, so by itself it does not give us the BFO bias offset.
@sk999
Long time ago I wrote the linked note:
https://www.dropbox.com/s/n2ifianuqtpa3bz/MH370_BFOonly_analysis_4June2015.pdf?dl=0
I did not recheck in depth, so it is mainly meant for inspiration and (numerical) results are probably not very useful; There are several issues I immediately see based on more current knowledge:
– The influence of BFO bias offset
– The nominal satellite position used was not accurate
– the low order of the vector expression taken from Henrik Rydberg’s paper. Henrik also derived a more accurate (higher order) expression.
The blue and the red curves in fig. 3 show the two contributions you mentioned.
@sk999,
My simplistic understanding of the BFO (outside of any Netflix conspiracy fiction) is that the plane knew its own position and the SDU correctly aimed the HGA and compensated its track doppler for 3F1 on the equator, ignoring vertical speed. Assuming MH370 was flying level on a heading due south near the equator at 19:41, the plane would apply zero doppler compensation, regardless of its velocity. That should leave only the known 3F1 position and velocity at the time over an hour after the SDU reboot for a stable oven temp. I recall that the null BFO changes after any reboot. If the baseline being used for fitting a path to BFO residuals is from the collection of readings at KL, a corrected baseline might improve any endpoint estimate that depends on BFO. (My acoustic candidate site does not.)
3F1 was 1.64 N of the equator at 19:41. My path estimate has the plane between waypoints BEDAX-ISBIX on heading 181.36 at about the same N latitude as the satellite, so the real doppler on that tangent path would be near zero. The small E-W component of 3F1 velocity and the SDU compensation for N latitude would then be the BFO baseline.
370Location:
If the aircraft was exactly on the equator at 19:41, the SDU would appy zero Doppler compensation, but because the satellite was 1.64 deg north of the equator, the actual Doppler was about 43 Hz. That completely swamps any expected shift in the BFO bias due to the reboot.
@sk999 et al. Is it the case that the automated frequency correction based on Burum pilot signal precisely strips out the doppler between satellite and Perth ground station?
@Paul S, sk999
The AES (its SDU) did not have sufficient information to pre-compensate for the doppler contribution on the L-band uplink, from aircraft to the satellite, as a consequence of the motion of the satellite.
At the time of 9M-MRO’s loss, the Inmarsat network System Table was broadcasting zero for the inclination and RAN parameters, therefore, the AES made no compensation for the satellite’s movement about its notional N0º E64º position.
Also, the pilot system was ‘borked’. A firmware bug existed in Perth’s receiver such that the negative sign of the teleport’s latitude was ignored, the ‘Perth-North’ problem.
Had the System Table been populated with the correct inclination and RAN parameters and the Perth pilot receiver firmware bug been patched, the doppler pre-compensation on the L-band uplink and correction on C-band downlink would’ve been close to ‘perfect’ and the logged BFO data would’ve been next to useless.
I think (believe) I understand what sk999 posits: that at equator crossing the BFO should be ‘true’, at that point the absence of pre-compensation by the AES is irrelevant. I haven’t yet grasped if that offers a new or substantial insight.
Paul Smithson –
Let’s see if I remember this correctly. The AFC based on the Burum pilot was SUPPOSED to strip out the satellite-Perth Doppler, but due to a bug in the software, it didn’t actually do so.
However, since the pilot signal went through the signal chain in the exact same way that the MH370 SATCOM signal did, you can subtract the frequency of the Burum pilot signal from that of the MH370 SATCOM signal, and the satellite-Perth Doppler is now completely stripped out, along with the eclipse effect and any other sources of frequency drift introduced by the satellite.
Thanks @Don and @sk999. This is what I’m nibbling at. the EAFC routine uses frequency shift of the Borum pilot signal as if ground station was situated at Perth North. Does the EAFC routine itself need to assume constant satellite altitude to do this? Because it can’t “know” what combination of N-S and up-down vectors contributed to the frequency shift on the pilot signal. And if the routine assumes constant altitude then its not just Perth North that is borked. I beg apologies in advance if I have butchered this.
@Paul Smithson: Conceptually, it doesn’t matter what the EAFC algorithm does. Since the frequency shift of the pilot signal from Burum as received by Perth after EAFC compensation is recorded, then if the Doppler shift between Burum and the satellite is subtracted out (based on the known satellite orbit), you are left with the same residual shift for the satellite-to-Perth link as for MH370. This shift includes not only the partial compensation of the EAFC, but also the frequency drift of the satellite’s local oscillator.
@Paul Smithson
Instead of speculating here is a link to my stash of MITEQ Tech Notes on how the EAFC works. Also a spec sheet for the INMARSET Pilot Receiver.
https://tinyurl.com/26tfa4rw
Thank you, George.
Re: Above discussion
The thing I noticed was satellite position at 1941 at 1.64N is about where MH370 may have been located in the 180s cases (range from 0-3N).
The Arc2 1941 BFO is somewhat “off” compared to Arcs 3,4 , which could be due to maneuvers in progress or normal data variation (though I currently favor the maneuver-in-progress theory).
The ATSB described the 19:41 data as exhibiting “a geographic inconsistency”.
@Ventus45
Based on what? BFO?
Document and page would be helpful…
The satellite N/S velocity is close to 0 m/s so BFO cannot be used to reliably determine latitude at 19:41
A digital compass requires a 10-bit A/D to measure to <0.5 degree RMS.
The BFO measurement appears to have only 7-8 binary bits so determining a track angle from the residual would be suspect.
MH370 appears to be accelerating and climbing at 19:41 which would throw off any BFO model.
[Comments here are closed. Please continue the discussion under the new post.]