Inmarsat’s Mark Dickinson holding the satellite data in an interview with CNN
Since we first learned of its existence, we’ve been asking for the complete record of the communications data between MH370 and Inmarsat’s satellite network. In May 2014, Malaysia released satellite data logs, but they were incomplete: fields of data were missing, and only a small number of data records from before the flight was made available. When pressed for the complete logs, Inmarsat and Malaysia both claimed the data had to be released by the other.
We now have what we believe is the complete record of communications between airframe 9M-MRO and the Inmarsat satellite network, from March 7, 2014, at 00:51 UTC, until March 8, 2014, at 01:16 UTC. This time period includes the previous flight from Beijing to Kuala Lumpur.
The satellite data was shared with me by a relative of a Chinese passenger on MH370. The data was given to him by Malaysia Airlines with the following email text:
Please find attached the Inmarsat data, for your info. Please note that these are raw data as you have requested. The authorities agree to release the data, on condition that:
We will not translate the data into any meaningful information as the data is proprietary to Inmarsat. The Malaysian Investigation team does not have any experts to translate these data into any meaningful information.
We will not translate the data into any other language, including Mandarin.
These data are complete and obtained from Inmarsat. Please do not manipulate the data.
I know, by having these data, you will have more questions, but I have to say that we are providing these data to satisfy your request, but we cannot answer any questions on the data because we too, cannot understand it. Only the experts from Inmarsat can.
Hope you understand.
Thank you
I suspect the data will confirm some assumptions, and will raise even more questions. I hope the data can help us learn more about the disappearance.
Boeing recently conducted end-of-flight simulations for MH370 with the assumption that there was no pilot input. The results were released in November 2016 by the ATSB as part of a report entitled MH370 – Search and Debris Examination Update. Boeing observed that in simulations where the aircraft experienced a descent rate consistent with the values and timing of the last two BFO data points, the aircraft impacted the water within 15 NM of the 7th arc. However, the details and the likelihood of the configuration that caused the high rates of descent were not discussed.
In order to better understand the conditions leading to the descent rates suggested by the final BFO values, and to estimate the distance MH370 might have traveled after crossing the 7th arc, simulations were conducted using the PMDG 777-200LR model add-on to Microsoft Flight Simulator X (FSX). After making adjustments for differences between the PMDG 777 model and MH370, the flight characteristics were recorded under various conditions.
Modeling the End-of-Flight Using FSX
9M-MRO was a B777-200ER and the PMDG 777 model is a B777-200LR. The main differences are:
Weight: The 777-200ER has a maximum take-off weight (MTOW) of 297.6 MT, while the 777-200LR has a MTOW of 347.5 MT, so the 777-200LR is in general a heavier aircraft. In the simulations, the zero-fuel weight (ZFW) was set to 174.4 MT to be consistent with MH370.
Engines: 9M-MRO’s version of the 777-200ER has Trent 892-17s with 41,768 kgf (90,000 lbf) of thrust, while the PMDG 777-200LR has GE90-110B1s with 50,285 kgf (110,760 lbf) of thrust. Since only the results from the simulation after fuel exhaustion are used, the difference in engine thrust is not important.
Wings: The 777-200LR version has a wing area about 2% greater area than the 777-200ER due to raked wingtips, which decrease the wing loading and reduce drag in cruise. The small difference in aerodynamic performance from the raked wingtips would produce little if any difference in the end-of-flight scenarios considered here, and are ignored.
In order to get realistic results from the FSX simulation, it is also important to recognize and compensate for other inaccuracies of the PMDG 777 model. In particular, it was found that the behavior of many systems when components have failed is not correct. Nonetheless, the basic aerodynamic model of the PMDG 777, when not at envelope limits such as stall conditions and transonic speeds, should be sufficiently accurate to model the flight characteristics of the B777. (Even a Level D simulator is not guaranteed to be accurate outside of the aircraft’s certified flight envelope.) The details of the flight dynamics model as incorporated into FSX are described by Yves Guillaume.
To model the flight behavior after fuel exhaustion, the simulation was conducted with the following initial conditions and programmed events:
Initial conditions are stable flight at 220 KIAS and FL350, which is representative of flying with one engine inoperative and decelerating from the dual engine cruise speed, but still holding altitude.
At t = 0, following events occur:
The fuel level is set to zero. In addition to shutting down the engines, this prevents the APU from starting.
The two fuel cut-off switches are set to OFF. Although it may not seem necessary to set the fuel level to zero AND employ the cut-off switches, in the PMDG model, the windmilling action of the engine shafts continues to supply electrical and hydraulic power if the cut-off switches are not employed.
The primary flight computers (PFC) are programmed to degrade to “secondary” control law. Although the loss of power to the left and right transfer busses removes heat to the pitot sensors, which should automatically degrade the control law from “normal” to “secondary”, in the PMDG 777 model, the control law remains in normal mode without programming this failure. In normal mode, yaw compensation and envelope protection would be available, while they are not available in secondary law.
Implications of the BFO Values on Flight Dynamics
The last two values of BFO were 182 Hz at 00:19:29 and -2 Hz at 00:19:37. Assuming a BFO bias of 150 Hz and a nominal position at (30S, 98E), a groundspeed of 385 kn, and a track of 172°T, the corresponding descent rates are 4,000 fpm and 14,400 fpm. This represents an increase of 10,400 fpm over 8 seconds. After conducting studies of the various flight conditions that might cause these descent rates, the following observations are offered:
If the aircraft has perfect lateral trim, i.e., the ailerons and rudder are positioned to perfectly remove any lateral (side-to-side) asymmetry of the aircraft about its longitudinal axis, the aircraft will fly relatively straight with no pilot input. The aircraft will also develop a phugoid flight pattern consisting of a damped-sinusoid vertical speed component superimposed on the quasi-steady vertical speed component. The quasi-steady vertical speed would correspond to a descent angle of about 3°, and a glide distance of greater than 110 NM is possible. However, the amplitude of the phugoid would be smaller and the period of the phugoid would be longer than the descent rates suggested by the BFO values. The case of a straight flight with a phugoid descent is therefore not studied here as it does not match the BFO values.
If the aircraft is flying straight with little or no bank, the descent rates can match or exceed the descent rates suggested by the BFO values if the pilot commands a single nose-down input. The aircraft would correspondingly impact the ocean close to the 7th arc. It is also possible that the steep descent could be arrested with a subsequent nose-up input, and the aircraft could be piloted to glide some distance (> 100 NM) from the 7th arc before the aircraft impacts the ocean. Other than noting that with pilot input, the impact point could vary greatly in distance and direction from the crossing point of the 7th arc and still match the BFO values, this scenario is not considered here.
If the aircraft has lateral (side-to-side) asymmetry about the longitudinal axis that is not removed by the appropriate positioning of the ailerons and/or rudder, the plane will enter a bank with a roll rate determined by the magnitude of the lateral asymmetry. As the bank angle increases, the descent rate also increases. With sufficient lateral asymmetry, the descent rates can match or exceed the descent rates suggested by the BFO values. This case is the case studied here.
Simulation of Banked Descent and No Pilot Input
After fuel exhaustion, the control wheel was turned about 4.5 units to the left in order to match the BFO values by introducing lateral asymmetry. (With the “no-pilot” assumption, the position of the control wheel in MH370 likely stayed in the neutral position. In the simulation, the control wheel was turned to reproduce lateral asymmetry resulting from other sources.) The control wheel input induced a roll rate of about 3.6 deg/s. As the bank angle increased, the descent rate correspondingly increased. In the simulation, the increase of descent rate from 4,000 fpm to 14,400 fpm required about 9 s, while the measured BFO corresponding to these descent rates are spaced at about 8 s. The lateral asymmetry caused by the rotation of the control wheel is therefore judged to be about equal to the lateral asymmetry of MH370 after fuel exhaustion.
A video showing the view from the cockpit during the simulated descent is included below. The aircraft rolls past 180° and impacts the water at a pitch angle that is almost vertical. During the descent, the speed reaches about Mach 1.1, and the descent rate approaches 60,000 fpm (593 kn). Although these speeds are outside of the performance envelopes that can be accurately modeled by the PMDG 777 model, it demonstrates that the BFO measurements are consistent with a very high speed impact.
Another video below is an outside view of the aircraft during the descent, showing how the increasing bank leads to increasing pitch down. At about 14 s, the deployment of the ram air turbine (RAT) can be seen and heard.
The figure below shows the trajectory of the aircraft. The position is adjusted so that the path crosses the 7th arc when the descent rate is about 4,000 fpm. There is only about 50 s between the time the descent rate reaches 4,000 fpm and the time of impact, and the impact is about 4.8 NM from the crossing of the 7th arc.
No wind is included in the simulation. However, considering that the aircraft impacts the water in about a minute and the winds were to the east, the effect of wind on the distance from the 7th arc should be small.
Possible Causes of the Lateral Asymmetry
The lateral asymmetry that induces the roll and the banked descent can be caused by a number of factors, including:
Geometrical asymmetries (“bend”) that would cause yaw and bank when the control surfaces are in their neutral position. Normally, this would be compensated by a pilot by adjusting rudder and aileron trim. However, the amount of trim might not exactly balance the asymmetry so there would be residual out-of-trim.
Asymmetric position of control surfaces caused by differences in hydraulic pressure that is supplied to the control surfaces on either side of the aircraft after fuel exhaustion.
After fuel exhaustion and without the APU operating, the main source of hydraulic pressure is from the RAT, which supplies pressure to the “center” hydraulic system. As can be seen below in the synoptic displays for the flight control surfaces and the hydraulic system, when the RAT is deployed, only the right flaperon has hydraulic pressure, and the left flaperon is “bypassed”, so that the flaperon moves freely. If the position of the right flaperon is positioned slightly down compared to the left flaperon, the result would be a roll to the left.
In fact, we have an indication that this would occur. In the Aircraft Maintenance Manual (AMM) for the B777, in the section on the Ram Air Turbine System, there is this note that was found by Don Thompson:
Training Information Point
When the RAT is extended and hydraulics off, the airplane rolls left. Two to three units of right control wheel rotation are necessary to hold the wings level.
In the simulation, 4.5 units of rotation were added to simulate the banked descent. Based on the note in the AMM, it appears that this level of wheel rotation causes asymmetric flaperon positions that are similar to what would be expected when the hydraulic pressure is supplied by the RAT.
The RAT would be deployed within seconds of the second engine flameout. However, the log-on request at 00:19:29 is believed to occur about two minutes after the second engine flameout. (One minute is required to start the APU and one minute is required for the SATCOM to request a log-on after power-up.) Therefore, there is a two-minute delay between deployment of the RAT and the roll. In fact, the pressure to the left and right hydraulic systems might decay over some period of time, as determined by the consumption of hydraulic fluid by various systems as well as the limited flow that is available as the engines windmill and the engine-driven pumps operate at reduced capacity. These factors might contribute to the two-minute delay before the aircraft entered into the banked descent.
Conclusions
The BFO values at 00:19:29 and 00:19:37 suggest that MH370 was descending at an increasingly high rate. With the assumption that there were no pilot inputs, the descent rates suggest the aircraft was in a roll as it was descending. According to Boeing documentation, when the hydraulic pressure is supplied by the ram air turbine (RAT), the aircraft banks to the left, which may have been the cause of the rolling during the descent. Using the PMDG 777 model add-on to FSX, simulations were performed for a banked descent that matched the descent rates suggested by the BFO values. In the simulation, the aircraft impacts the water at speeds around Mach 1 and with nearly vertical nose-down pitch. The distance of the impact point from the crossing of the 7th arc is less than 5 NM.
A fanciful depiction of a team of AUVs searching the sea floor as proposed by researchers at Virginia Tech
Despite an underwater search of the seabed in the Southern Indian Ocean (SIO) that covered 120,000 sq km, employed five search vessels, lasted 16 months, and cost Malaysia, Australia, and China a total of US$ 226 million, the MH370 wreckage remains elusive. The only debris from MH370 that has been found are parts that have drifted across the Indian Ocean and recovered from the shores of Eastern Africa.
Because of the need for specialized equipment capable of searching as deep as 6,000 m, operated by highly-trained crews in the exceptionally harsh conditions of the SIO, the underwater search is slow, expensive, and dangerous.
First, a bathymetric survey is undertaken to map the topography of the seabed. The bathymetric survey uses “multibeam sonar” transducers mounted on the hull of the survey vessel. By transmitting an acoustic pulse and measuring the time duration to receive an echo from the sea floor, the depth of the sea floor can be mapped with a resolution of about 100 m at a rate of 1200 sq km per day.
After the sea floor is mapped, the seabed is scanned for aircraft debris by pulling a “towfish” behind a search vessel. The towfish is lowered so that it “glides” just 100 – 150 m from the sea floor. The towfish is equipped with “side scan sonar” to search on either side of the towfish, and “multibeam sonar” to search below the towfish. This allows scanning the seabed out to a distance of 1 km to either side of the towfish at a resolution of about 70 cm and a rate of 133 sq km per day. If there is an object of interest, or the seabed is difficult to scan due to challenging topography, an autonomous underwater vehicle (referred to as an AUV or drone) can be deployed to get close to the sea floor and obtain high resolution images. For instance, the drones of the type used in the MH370 search have a resolution of about 10 cm and can scan the seabed at a rate of about 17 sq km per day.
Our estimates of the location of the crash site come mainly from two bodies of evidence: satellite data that was recorded for the brief intervals that MH370 transmitted signals to the Inmarsat communications network, and from drift models that estimate the crash site based on the timing and location of debris that has been recovered from the shores of Eastern Africa. Unfortunately, neither of these data sets is sufficiently precise to provide high confidence in the location of the wreckage.
Due to the expense of seabed searching, combined with the imprecision of using the existing data sets to estimate the location of the wreckage, some are suggesting that it is not economical to do further searching with our current technology. The argument is that further searching should be suspended until we gain additional information or insight that allows us to more precisely estimate the location, or until we develop new technology that allows us to more economically search large areas of the sea floor.
It is the promise of new technology that can more economically search large areas of the sea floor that led me to the work of Dr Dan Stilwell, a professor of electrical engineering at Virginia Tech. Dan’s team conducts research in the area of marine autonomy and robotics, and they have developed small, fast, high-performance, inexpensive AUVs for the US Navy. His research team is using their extensive inventory of technology to compete in the Ocean Discovery XPrize, which aims to accelerate innovations to improve the speed, scale, and image resolution of technologies used to explore the ocean floor.
Dan Stilwell (right) and his team with one of their AUVs
The XPrize contest will require mapping 500 sq km of ocean floor with a resolution of 5 m and at a depth of 4,000 m, and also to produce high resolution photographs of various objects on the seabed, all within 24 hours. That’s quite a challenge with existing technology. Nonetheless, the prospect of winning the US$ 7 million prize has attracted interest from 21 teams from around the world.
Dan’s approach is to use a “team” of small, low-cost AUVs to cooperatively survey and scan the ocean floor. Each AUV can travel at 4 knots for 24 hours on a single battery charge. Rather than using expensive inertial guidance systems to navigate, Dan and his team are using technology developed at the Woods Hole Oceanographic Institute, whereby all the AUVs acoustically communicate and navigate using a low-bandwidth, time-division multiple access (TDMA) network. In this approach, each AUV in the team is assigned a time slice and each AUV has a synchronized clock. Each AUV measures the time delay between transmission and receipt of pulses from each of the other AUVs, and from this and other information, the relative position of all the AUVs may be determined. One node remains at the surface, which provides an absolute GPS position reference. This approach to acoustic navigation has not previously achieved the accuracy that is required for the XPrize contest, but Dan’s team will implement a number of new tricks that they expect will provide a sufficient boost in navigational performance.
Can next generation AUV technology provide an economical way to search for MH370? Consider this: Dan estimates that it would take about four of his drones to match the scan rate of a single towfish. But there are compelling economic benefits to using a team of drones. For one, each drone is relatively inexpensive–Dan and his team can build one for about US$ 125,000. Secondly, a large team of AUVs can be deployed from a single surface vessel and crew, while a towfish requires a dedicated vessel. For instance, if a cooperative team of twelve AUVs is deployed from a single vessel, that vessel would be able to scan three times as much sea floor as a vessel deploying a towfish. As sonar sensors increase in performance and miniaturization, sea floor scanning with AUVs will become even faster and cheaper.
As we struggle to squeeze every last bit of information from the existing MH370 evidence, it may be that some of our resources are better directed to improving our ability to quickly and economically search large expanses of the sea floor. Research on autonomous vehicles like that performed at Virginia Tech by Dan and his team can help us.
Update on May 31, 2017.
I was recently in a discussion that included a well-known ocean explorer who happens to be a judge in the Ocean Discovery XPrize competition. We were having a general discussion about searching for MH370 and ways to scan the ocean floor at high resolution, and he told us about the capabilities of Ocean Infinity. Like the team at Virginia Tech, their approach is to employ a team of AUVs. From their website:
Six HUGIN autonomous underwater vehicles (AUVs) are capable of operating in 6,000 m water depth collecting high resolution data at record breaking speeds. Our AUV fleet is accompanied by six unmanned surface vehicles (USVs) to ensure precise position and constant communication.
With multiple autonomous vehicles working simultaneously utilizing innovative technology, we are able to survey huge swaths of the seabed, quickly and with outstanding accuracy. We can operate in shallow waters but excel in extreme depths, working in dynamic environments ranging from the tropics to the Arctic ice.
Because of the size and complexity of each AUV/USV pair, the capital cost of the technology from Ocean Infinity would greatly exceed the capital cost of Virginia Tech’s technology, which uses small AUVs with innovative navigation systems. On the other hand, both approaches benefit from having a single host vessel supporting multiple underwater vehicles, which offers significant operating cost and scan rate improvements compared to the conventional towfish technology.
Ocean Infinity’s seabed exploration system is commercially available today, including underwater and surface vehicles, on-board support equipment, and the host vessel. This is an exciting possibility for conducting the search for MH370 in the near future.
Drift model for a crash site at 35S latitude. Black lines are paths for debris and arrow heads are positions on December 31, 2015. (Click on image to enlarge.)
A recent report from Australia’s Commonwealth Scientific and Industrial Research Organisation (CSIRO) was greeted with much fanfare. A previous report published in December 2016 predicted that MH370 would be found along the 7th arc at 35S latitude. With new results in, the ATSB proclaimed that they were even more confident in their findings.
Using advanced computer models of how debris from the crash might drift across the Indian Ocean towards Africa, and comparing those results to the location and timing of debris discovered along the shores of Eastern Africa, it was possible to narrow the location to 25,000 sq km of unsearched sea bed. However, the results from this model, presented in December 2016, did not predict that one of MH370’s flaperon would arrive on the French island of La Reunion by the discovery date of July 2015. This perplexed the researchers at CSIRO, who were committed to better understand the discrepancy.
Researchers knew that because the recovered flaperon floated with a portion above the water, the drift path was more heavily influence by wind and waves than debris that floated flat on the surface. The computer model for the flaperon was therefore adjusted for the extra “leeway” by measuring the drift behavior of replica flaperons that were constructed and tested by CSIRO. However, even when the computer model for the flaperon was corrected for this extra leeway, the drift models still did not predict that the flaperon would arrive in La Reunion by July 2015. That was until the American National Transportation Safety Board (NTSB) was able to locate a spare flaperon, which was modified by Australian investigators to resemble the flaperon debris that was recovered. The drift behavior of the modified flaperon was then experimentally measured just as the behavior of the replicas was previously measured. The experimental results said that the computer model should include even more leeway, and the wind would also tend to push the flaperon about 20 degrees to the left. When these effects were included in the computer model for the flaperon, the drift models now predicted an arrival date in La Reunion that was consistent with the discovery date of July 2015, and this was released in a new report. CSIRO felt as though the last missing piece of the puzzle was found.
As reported recently in the media, these results gave CSIRO even higher confidence that its drift models are correct, and MH370 would be found along the 7th arc at 35S latitude. Surprisingly, nowhere in those stories was it reported that at this latitude, the seabed was already searched to a distance of about 20 NM from the arc without finding the plane.
Fellow IG member and co-collaborator Richard Godfrey viewed CSIRO’s drift model with skepticism. He had already performed his own drift study using a computer model he had independently developed, which I have previously discussed and published on this blog, and he came to a much different conclusion. He argued that the timing and location of the debris recovered along the shores of Africa were not consistent with a crash at 35S latitude. Rather, a crash at 30S latitude, well north of the seabed search, was much more likely.
Rather than post Richard’s short comments on this blog, I asked him to prepare a more in-depth critique of CSIRO’s work, as certainly his comments would raise many questions. Within 24 hours, a critique arrived in my inbox, which I publish in full here. In addition to the simulated trajectories of debris, Richard also includes the effect of temperature history on barnacle growth, and comments on the effect of storms in the region. He concludes: Despite the significant contribution in refining the accuracy of the drift model, the new data is interpreted as confirming the findings of the ATSB First Principles Review. The pre-conceived idea, that “other evidence” constrains the MH370 End Point to between 32°S and 36°S is a false assumption. A MH370 End Point at 35°S does not fit the fact that the underwater search has already discounted this location to a 97% level of certainty. An MH370 End Point at around 30°S does fit the available data.
While Richard was preparing his critique, I tried to independently reconcile the differing conclusions of CSIRO and Richard. Basically, CSIRO was predicting a crash site at 35S, and Richard maintained that a search at 30S had a much higher probability of success. Fortunately, the results of CSIRO’s drift studies were made available as KMZ files that could be imported into Google Earth. Using these files, as well as the recent report and the report from December 2016, I was able to piece together some information.
The arrival of debris on the shores of Eastern Africa is highly dependent on the latitude of the crash site. In general, crash sites further to the north along the 7th arc will produce debris that arrives earlier in Africa. After traveling west across the Indian Ocean towards Africa, the debris then tends to travel south. Therefore, debris reaching Eastern Africa would beach last on the shores of South Africa.
The figure at the top of the article shows the position of debris on December 31, 2015, as predicted by the CSIRO model for a crash site along the 7th arc at 35S latitude. The debris is assumed to have “low windage”, which is consistent with the shape of the engine cowling and flap fairing that were discovered in Mozambique and South Africa in December 2015. As can be seen in the figure, CSIRO’s model does not predict that a crash site at 35S latitude would produce debris that would beach as far south along the shores of Eastern Africa as the actual debris that was found. The results of CSIRO’s model are in this respect consistent with the findings of Richard Godfrey.
So why does CSIRO maintain that a crash site at 35S produces debris of the correct location and timing as what was found? The answer lies in a panel from Figure 3.2.1 of the report from December 2016, which is shown below. The vertical axis represents the latitude of potential crash sites along the 7th arc, and the horizontal axis represents the time of arrival along the shores of Eastern Africa, and the color represents the associated probability, with dark blue the lowest probability and red the highest. The red and white bar shown in the figure is aligned along December 2015, which is when the first debris in Eastern Africa was found. And indeed, the colors in the figure do show that for a crash site of 35S latitude, the debris will start to reach Eastern Africa around December 2015.
Probability of reaching Eastern Africa for various crash site latitudes. (From CSIRO, Dec 2016.)
What is not shown in the figure is the timing of when debris will reach various locations along the shores of Eastern Africa. Instead, as can be seen in the title above the figure, all locations along the shores of Eastern Africa from 35S latitude to the Equator are grouped together. But we know that debris will reach locations further south along the shores of Eastern Africa last. In fact, CSIRO’s own model predicts by the end of December 2015, the “non-flaperon” debris, i.e., debris with low windage that floats relatively flat on the water, will reach the shores of Eastern Africa only between 1S and 12S latitudes. On the other hand, the debris was found in Mozambique at 24S latitude and in South Africa at 34S latitude, which is well outside of the range of latitudes predicted by CSIRO’s model.
CSIRO might argue that although a crash site of 35S doesn’t allow debris to reach South Africa by December 2015, a crash site of 30S, as suggested by Richard Godfrey, would have produced debris along the northern shores of Eastern Africa well before Blaine Gibson found the portion of the horizontal stabilizer (nicknamed “No Step”) in March of 2016. In fact, debris might have arrived well before Mr Gibson’s discovery, and either was not found, was beached and later was again carried out to sea, was caught in offshore eddies, or was found and not reported. In these cases, a distinction should be made between the date of discovery and the date of arrival. Obviously, the arrival must always precede the discovery.
Based on the results of the drift models of both CSIRO and Richard Godfrey, recent claims about the most likely crash site of MH370 should be carefully reviewed by independent investigators.
Update 1 on April 24, 2017.
For those wishing to explore the drift model results in Google Earth, the KMZ files generated by CSIRO are available for the flaperon debris, for non-flaperon low windage debris, and non-flaperon high windage debris. The particular file I used to create the image at the top of the article is the file for low windage, non-flaperon items starting at 35S latitude. Once dragged into Google Earth, simply move the time slider and observe how the particles travel in time.
Update 2 on April 25, 2017.
The Guardian has published an article that discusses our interpretation of CSIRO’s results. “Both CSIRO and the ATSB have been contacted by Guardian Australia for their response.” No response has yet been received by reporter Elle Hunt.
Update 3 on April 26, 2017.
I received the following email from David Griffin of CSIRO:
Dear Victor,
I saw the Guardian article referring to your blog. A few comments:
You are correct that ‘Roy’ was found at an earlier date than the model predicted. But to be fair, the model error is ‘just’ 2 months. I consider Roy’s arrival time – before anything else upstream – to be something that is simply too hard for any present-day model to convincingly explain. You’ve seen the paths that things take. But those paths should not be interpreted too literally. Our Dec 2016 report mentions that we do not have confidence in the model’s ability to hindcast the arrival times of individual items along the African shore. That’s why we focussed on the more-robust things that the model tells us.
As you correctly pointed out, a 30S crash site would, according to our model, have resulted in debris washing up on Madagascan and Tanzanian shores a full year earlier than was observed. That is a discrepancy that is hard to set aside.
The other factor against 30S that we find very hard to discount is that 30S is right in the middle of the zone targeted most heavily by the surface search in 2014. This is the “other evidence” that Richard overlooked. Please see Section 4 of our Dec report, and Fig 4.2 of the April report.
MH370 Search Director Peter Foley (left) and ATSB Chief Commissioner Greg Hood (right)
In a new article from the Australian, we learn that Greg Hood, Chief Commissioner of the ATSB, has rejected a Freedom of Information (FOI) request from the families of Chinese passengers of MH370. (Commenter @David alerted us to the story.) According to the story, “The documents sought are the opinions of international experts, including from the US and British air crash agencies, Boeing, aerospace group Thales, and British satellite group Inmarsat, about satellite data that automatically tracked the course of MH370.” Also, we learn that the “ATSB general manager for strategic capability Colin McNamara in February refused The Australian’s original FOI request, claiming release of the information could ’cause damage to the international relations of the commonwealth’.”
So why would the information about MH370 requested by The Australian cause damage to international relations?
With the failure of the underwater search to locate the wreckage of MH370, it is essential that we reassess what assumptions went into the analysis that was used to define search area. This will help us to understand why the search failed, and could help us to define a new search area. A true reassessment would require independent eyes to review and analyze all the available data. While certain data sets have been publicly released, and other data sets have been leaked to the public, there are still important data sets held by the official investigators that are not available to the public. Unfortunately, the recent decision by Mr Hood reaffirms the prior decision to not make these data sets publicly available.
Included below is the complete article.
ATSB shuts down details on MH370 search
by Ean Higgins
The Australian Transport Safety Bureau has invoked draconian legislation in refusing to release material about its search for missing Malaysia Airlines Flight MH370, warning that any bureau employee who provides such information to the public or a court could face two years in jail.
ATSB chief commissioner Greg Hood has used the statute to reject a plea from the families of the Chinese passengers who died on MH370 that he grant a Freedom of Information request from The Australian, with the families claiming failure to do so makes Australia complicit with a cover-up by the Malaysian government.
Some ATSB officers are having second thoughts about the agency’s official line that MH370’s pilots were unconscious or dead at the end of the flight.
Mr Hood has declared the Transport Safety Investigation Act covers the FOI request for critical documents the ATSB claims support its “ghost flight” and “death dive” scenario, which holds the Boeing 777 went down in an unpiloted crash.
The theory has been rejected by many commercial pilots and international air crash investigators who believe captain Zaharie Ahmad Shah hijacked his own aircraft and flew it to the end.
The documents sought are the opinions of international experts, including from the US and British air crash agencies, Boeing, aerospace group Thales, and British satellite group Inmarsat, about satellite data that automatically tracked the course of MH370.
The ATSB says the satellite data shows MH370 was in a rapid unpiloted dive at the end, but experts such as former US captain and crash investigator John Cox have said the data is not good enough to reach that conclusion.
ATSB general manager for strategic capability Colin McNamara in February refused The Australian’s original FOI request, claiming release of the information could “cause damage to the international relations of the commonwealth”.
The association representing the families of the 153 Chinese victims who died when the plane went down on March 8, 2014, issued a statement after The Australian reported Mr McNamara’s decision, saying “we react with extreme displeasure and annoyance”.
“Is avoiding offending the Malaysian authorities more important than discovering the truth?” the families asked in the statement.
Mr Hood, in an internal review of Mr McNamara’s decision, also refused to release the documents. “The activities of the ATSB with respect to assisting the Malaysian investigation are covered by the TSI Act,” Mr Hood wrote in his decision.
He advised that the act holds that if a serving or former ATSB staffer or consultant “discloses information to any person or to a court; and the information is restricted” they have breached the act, which stipulates a penalty of two years in prison.
In response to an earlier inquiry, Mr Hood would not say whether he would allow any ATSB staff who no longer agree with the “ghost flight” and “death dive” theory to publicly express their views.
MH370 disappeared on a scheduled flight from Kuala Lumpur to Beijing with 239 people on board, with its radar transponder turned off and radio communication cut after about 40 minutes.
Military radar and the satellite tracking data shows the aircraft deviated back over Malaysia to the Andaman Sea, before a long track south to the southern Indian Ocean. A $200 million search directed by the ATSB based on its “unresponsive pilots” theory failed to find the aircraft’s wreckage and was suspended in January.
When last year it was revealed the FBI had discovered Zaharie had plotted a course quite close to that track on his home computer flight simulator, the ATSB joined the Malaysian government and Malaysia Airlines to hose down suggestions this pointed to the “rogue pilot” hijack theory.
Update 1 on April 18, 2017.
A group called “The MH370 China Families” is distributing a media release that reacts to the FOI denial by the ATSB and the claim by Malaysia authorities that nothing is being hidden. They state that “In the face of a failed search outcome, contradictory evidence and Malaysian authorities’ overall approach, China families reject the Malaysian transport minister’s denial.”
The group also continues to claim that the satellite data was altered to support the theory of a crash in the SIO, citing comments posted by Emil Enchev on a physics blog site. The comments have been removed, so we don’t know the basis for his claims. I have in the past asked the group to publicly release this evidence so that it could be properly reviewed. They refused my request, citing concerns about the safety of the crew and passengers of MH370, who they think could still be alive, and could harmed by their captors if Mr Enchev’s comments were released. I explained to them that their claims could not be taken seriously without supporting evidence.
Here is the media release:
Media Release: For immediate release: MH370 China families react to Malaysian minister’s denial authorities have something to hide
China family members react with displeasure at the claim by Malaysian transport minister, Liow Tiong Lai, that the authorities have nothing to hide. Instead we point to the following indicators that they are hiding.
The Australian Transport Safety Bureau, investigating MH370’s disappearance at the request of Malaysia, refused to release information under The Australian newspaper’s Freedom of Information request, claiming the release could “cause damage to the international relations of the commonwealth”.
The Southern Indian Ocean seabed search based on satellite data supplied by Inmarsat and the Malaysian government failed to find any evidence of MH370. The search was coordinated by the ATSB October 2015 to January 2017.
China families have access to a physicists’ blog site post 28 May 2014 claiming the satellite data was altered prior to its release 26 May 2014 to support the claim by Malaysian authorities, 24 March 2014, that MH370 crashed in the Southern Indian Ocean.
The internal French report on the Réunion flaperon found that the flaperon was entirely submerged * and yet French flotation tests showed much of the flaperon above the waterline, raising serious doubts about the genuineness of the debris.
Reverse drift analyses are incompatible with the primary search zones determined by expert analysis of the purported satellite data.
Malaysian authorities are unwilling to explore the area of 25,000 sq kms, after which, according the the “First Principles Review”, November 2016, “prospective areas for locating the aircraft wreckage, based on all the analysis to date, would be exhausted.”
In the face of a failed search outcome, contradictory evidence and Malaysian authorities’ overall approach, China families reject the Malaysian transport minister’s denial.
* The report, by Pierre Daniel, 8 February 2016, obtained by China families, states «La présence de crustacés, du genre Lepas, des deux cotés du flaperon suggèrent une ligne de flottaison différente abc une pièce qui serait totalement immergée.»
“The presence of crustaceans, gender Lepas, on both sides of the flaperon suggest a different abc waterline a piece that would be completely submerged.”
An article published in Free Malaysia Today reports that Peter Chong, a close friend and fellow political activist of Captain Zaharie Shah, is now missing. Just days before his disappearance, he complained on Facebook that he was accosted by a motorcyclist and told to be careful as “nowadays a lot of people have suddenly disappeared”.
Mr. Chong and the captain were both active in the opposition party PKR, which is how they first met. The captain would reportedly spend eight or nine hours a day helping the political campaign when not scheduled to fly.
I include the contents of the article below. I hope that Mr. Chong is found quickly and is not harmed.
Missing Peter Chong a close Friend of MH370 captain
PETALING JAYA: Peter Chong, the activist who went missing last week after he had narrated an apparent veiled threat against him, is a close friend of pilot Zaharie Ahmad Shah, captain of the Malaysia Airlines flight MH370 that mysteriously vanished three years ago.
Chong had vigorously defended Zaharie against speculations of possible responsibility over the incident in several interviews with international and local media, in the weeks after the plane disappeared en route from Kuala Lumpur to Beijing on March 8, 2014.
He had also attended vigils and other events dedicated to the 239 people who were aboard the missing plane.
In one photograph that had gone public, the two are shown together with Zaharie wearing a t-shirt which reads “democracy is dead”.
Chong’s family reported to the police on Saturday evening that they had not been able to contact him after he was seen leaving the house on the night of April 5.
In a Facebook posting on March 31, Chong, who likes to attend protests and candlelight vigils, had narrated how a motorcyclist accosted him earlier that morning, telling him to be careful as “nowadays a lot of people have suddenly disappeared”.
Chong, 54, had told FMT, in an interview published on March 17, 2014, that he first met Zaharie at a community event in Subang in 2012 and they soon became best of friends.
“He joined in as a volunteer and he was there cleaning and arranging the chairs,” Chong recalled.
“I realised that I had never met this guy before so I introduced myself. He told me that he worked with MAS and it was only later that I found out he was a captain.”
They were both also involved in political activism as Chong was then assistant to PKR’s Subang MP Sivarasa Rasiah, while Zaharie, a life member of PKR, campaigned for the party in the last general election in 2013.
In the interview, Chong also praised Zaharie, expressing his utmost trust in the pilot, describing him as a man who loves to share with his close friends the joy of flying.
“If I were to choose a pilot to fly me in the future I’d still choose Captain Zaharie because he is a responsible and honest guy,” he said.
The former Petaling Jaya City Council (MBPJ) councillor had reportedly told The Australian that Zaharie would spend eight or nine hours a day helping in the election campaign when not rostered to fly.
Chong added that Zaharie was “angry at corruption and how the courts were being abused” to allegedly push politically motivated charges against PKR de facto head Anwar Ibrahim who is now serving a five-year jail sentence for a sodomy conviction.
In another interview with the BBC first broadcasted on March 10, 2014, Chong had recalled speaking to Zaharie about a week before MH370 disappeared, saying he appeared to be in good spirits.
“The whole nation and the whole world are waiting for answers,” he had said in the interview.
“What I feel cannot compare to what his family and the families of all the other passengers and crew are feeling.”
The same can now be said of Chong’s own family who are waiting anxiously for word on his whereabouts.
His disappearance comes in the wake of the suspected abductions of Pastor Raymond Koh, Amri Che Mat, Pastor Joshua Hilmy and his wife Ruth since November last year.
Clips from CCTV recordings showing Koh being abducted in a professional manner by a group of masked men on a public road in Petaling Jaya in broad daylight on Feb 13 have been widely shared via social media.
Chong had reportedly attended a recent vigil for Pastor Koh.
Electoral watchdog Bersih 2.0 had yesterday requested for an “urgent meeting” with the Inspector-General of Police Khalid Abu Bakar over the mysterious disappearances of the activists.
Update 1 on April 11, 2017.
An article published on BH Online provides more details of the police investigation. I include the article below as translated from Malay to English by Google .
Police Investigating the Disappearance of Peter Chong
KUALA LUMPUR: Police looking into the disappearance activist Peter Chong, whether a foul or otherwise, after he was last seen at his residence in Bukit Ceylon here, 6 April.
This is because, the main focus of the Kuala Lumpur police contingent at the moment is to see whether the victim actually lost or disappeared for unknown reasons.
Chairman of the Kuala Lumpur Criminal Investigation Department, Senior Assistant Commissioner Rusdi Mohd Isa, said that at present it is still not able to confirm whether there is a criminal element in the case.
“Based on preliminary information we have received, the victim does not receive any element of criminal intimidation before she was reported missing, but there was no threat to him.
“However, the focus of our investigation and the investigating his disappearance done from various angles based on the information available,” he said when contacted BH, just now.
He said it was too early to say that Peter was abducted by certain parties but did not rule out the possibility he was hiding.
“We can not disclose any details for fear that can interfere with the investigation by a special team set up involving contingent Kuala Lumpur Dang Wangi police,” he said.
Rusdi said he is confident the loss of Peter does not have any connection with the disappearance of Father Raymond Koh, who was kidnapped by a group of men in Petaling Jaya on 13 February.
So, the Kuala Lumpur police have already stated that there was no criminal intimidation, despite Mr. Chong’s Facebook post in which he complained that a motorcyclist had warned him to be careful because others have disappeared. And the police are already confident that his disappearance has nothing to do with the disappearance of other political activists.
Hopefully the Malaysian police investigation is thorough and honest and not a whitewashing of the facts.
Update 2 on April 11, 2017
Peter Chong reportedly had recently attended a vigil for Pastor Raymond Koh, a socialist activist who was recently abducted. This chilling video shows the abduction of Pastor Koh, which involved seven vehicles and at least 15 individuals. The video shows just how well-orchestrated and professional the operation was.
In a related development, the Inspector General of Police (IGP), Tan Sri Khalid Abu Bakar, says the investigation into Pastor Koh’s disappearance is deadlocked because of the publicity surrounding the case, including the candle-light vigils. He angrily declares, “So once again I urge the media, individuals, and NGOs that want to get involved in kidnap cases, to shut your bloody mouths.”
Update 3 on April 12, 2017.
In a bizarre twist of events, in an article from the Malay Mail Online, the IGP is now claiming that Peter Chong was not abducted, and was photographed crossing the border into Thailand. The IGP threatened to take action against Mr. Chong if he staged his disappearance to appear as if he was abducted. The IGP also proposed that Mr. Chong might have fled the country to avoid debt. However, the IGP produced no evidence that Mr. Chong crossed the border, had staged his disappearance, or tried to avoid debt. Perhaps the evidence will eventually be released.
Here is the article in full:
IGP: ‘Missing’ activist Peter Chong in Thailand, not abducted
KUALA LUMPUR: Peter Chong, the former Petaling Jaya councillor, had crossed the Bukit Kayu Hitam border to Thailand on the day he was said to have gone missing.
Police today confirmed that immigration records and photos showed him crossing the border at 6.30am on Apr 7.
“We have immigration records and photos of him leaving the country. There is no record showing that he has returned to the country,” said Inspector-General of Police Tan Sri Khalid Abu Bakar.
He was speaking to reporters after attending the police monthly assembly hosted by the Criminal Investigation Department.
Khalid said police are working with its Thai counterparts to investigate Chong’s motive for leaving.
“We do not know what was his intention in showing as if he was abducted. But if his motive was to create panic in the country, police will take action against him.
“I hope he will contact his family to inform them of his condition.”
Khalid also clarified that police only investigated one out of five activists who were said to have been abducted, under Section 365 for kidnapping.
“Only the Raymond Koh case is being investigated under abduction. The other four, including Chong, were classified as missing person cases as there was no proof that they were abducted,” he said, adding there is no update on Koh’s disappearance.
Koh, 62, was abducted after a group of men stopped his silver Honda Accord along Jalan SS4B/10 in Petaling Jaya.
CCTV footage of Koh’s abduction went viral on social media, showing a professionally executed abduction involving more than 10 men in three black SUVs.
Before Khalid’s statement, questions had been raised on Chong’s disappearance as well. Chong had also posted a cryptic message on his Facebook page shortly before his disappearance.
Update 4 on April 16, 2017.
In article from the New Straits Times, we learn that Peter Chong claims that he traveled to Thailand to learn more about the abduction of Pastor Koh, was himself abducted, and later released. Thankfully, he is now safe and unharmed in Malaysia. It will be interesting to see how Mr Chong’s story squares with the scenario proposed by the IGP, in which Mr Chong staged his own disappearance and fled the country to avoid debt.
Here is the article:
KUALA LUMPUR: Peter Chong, the former Petaling Jaya councillor who re-emerged today after disappearing 11 days ago, has claimed that he was abducted while in Hat Yai, Thailand, where he had been all this time.
He told police that he had gone to Hat Yai to meet a source claiming to have information on the whereabouts of Pastor Raymond Koh Keng Joo, who was allegedly abducted in Petaling Jaya, on Feb 13.
However, upon reaching the southern Thai city, Chong claims he was abducted and taken north, to Pattaya.
He said he was abruptly released in Pattaya, where he contacted his son, Darryl, who arranged for him to fly home to Malaysia.
The identity of his abductor and the motive for his alleged kidnapping is unknown.
City police chief Datuk Amar Singh confirmed the details of Chong’s statement.
Earlier today, Inspector-General of Police, Tan Sri Khalid Abu Bakar, tweeted two pictures of the activist, believed to have been taken at the Kuala Lumpur International Airport (KLIA) at about 1pm.
“Congratulations @PDRMsia Kuala Lumpur. “Missing” Peter Chong is back from Pattaya, this afternoon,” the tweet read.
Khalid said police recorded Chong’s statement upon his arrival at the airport.
Chong went missing on April 6, in the wake of the alleged abduction of fellow activist, Koh. Chong’s family lodged a police report a day after his disappearance.
About a week before he disappeared, Chong left a cryptic post on his Facebook page which raised fears for his safety.
View of cockpit during descent. The Nicobar Islands are in the left windshield. (Click to enlarge.)
Introduction
As readers here know, we have considered the possibility that MH370 turned to the south later than 18:40 UTC and crashed along the 7th arc to the north of the seabed that was searched. What led investigators in the past to believe that MH370 turned at some point between 18:28 and 18:40 are the satellite data obtained at times that bookend this time interval. If we assume that MH370 was flying at nearly constant altitude, the BFO value at 18:28 is consistent with a plane flying at 500 knots and on a track of 296°T, which puts it parallel to airway N571 around waypoint NILAM. Similarly, the BFO value at 18:40 is consistent with a plane flying at on a track of 180°T at about 462 knots. That means a turn to the south must have occurred during this time interval if the plane was flying at constant altitude. However, the BFO values at 18:40 also match a plane descending and maintaining a northwest track, which would imply a later turn to the south. Here we consider this possibility. In particular, we consider whether:
The combinations of groundspeed and vertical speed required to match the BFO at 18:40 are typical of a B777 in a descent
The variation in the BFO values recorded at 18:40 are what we would expect if MH370 was descending
BFO Values at 18:40 UTC
A log-on sequence to Inmarsat’s satellite network occurred between 18:25 and 18:28. The BTO and BFO data obtained during the log-on suggests that MH370 was flying parallel but to the right of airway N571, near waypoint NILAM. Commenter @Andrew, a former B777 pilot, advised us that in the event that an aircraft does not have clearance to fly an assigned airway, a 15-NM offset from the airway is recommended to avoid other traffic. It is therefore possible that MH370’s pilot, knowing that the transponder was inoperative, chose to fly at 15 NM to the right of N571 to avoid other traffic.
At the time of the call at 18:40, if MH370 was flying offset from N571, it would have been just past waypoint IGOGU in the Andaman Sea and flying towards the Nicobar Islands on a track of 294°T. The call at 18:40 produced 49 BFO values that were recorded over a period of about one minute. The values ranged between 86 Hz and 90 Hz, and averaged 88 Hz. Using this average value of 88 Hz, we can determine the values of groundspeed and vertical speed that would produce a BFO value of 88 Hz for a plane flying along a track of 294°T. Knowing the groundspeed (GS) and vertical speed (VS), the BFO is calculated from the equation
BFO(Hz) = 128.8 + 0.0372 GS(kn) + 0.0228 VS(fpm)
A table of selected values of groundspeed and vertical speed that result in a BFO value of 88 Hz is shown below. Also shown in the table is the calculated flight path angle (FPA), which is the negative of the descent angle, and gives some indication as to whether drag or thrust is required to maintain a particular descent rate. In general, a descent angle greater than around 3.0° will require additional drag (by deploying the spoilers, for instance), and a descent angle less than around 3.0° will require thrust from the engines. A plane gliding with a descent angle of 3.0° has a lift-to-drag ratio (L/D) of around 19. We see in the table that for groundspeed between 450 and 500 kn, the descent angle is between 2.9° and 3.2°, and the vertical speed is between -2500 and -2600 fpm. This translates to typical descent angles.
Descent Conditions to Match the BFO Values at 18:40
Automated Descent of MH370
Because the BFO varies with groundspeed and vertical speed, any variation in either of these two parameters would be represented as a variation in the BFO values that were recorded. Using the BFO equation, we find that either a ±54-knot variation in ground speed or a ±88-fpm variation would produce a ±2-Hz variation in BFO. For an automated descent, once established, it would be rare to see a 54-knot change in groundspeed over the course of a minute. However, a 88-fpm change in vertical speed is very possible, especially for descent modes in which the elevator is used to control either Mach number (M) or indicated airspeed (IAS). For this reason, we consider that MH370 was descending in an automated mode that minimizes the variation in vertical speed. In particular, we consider a “V/S” descent in which the elevator is used to maintain the selected vertical speed and the autothrottle is used to maintain the selected airspeed, i.e., the selected value of M or IAS.
The figure below shows the calculated values of BFO for a descent in which VS=-2600 fpm is held constant and the airspeed was selected as M=0.8. The calculations assume a headwind of 3 kn, a temperature of ISA+10.8K, and a ratio of 1.06 between the geometric and pressure altitudes, which is all based on the appropriate GDAS meteorological data. The assumed descent is between FL340 to FL200, and lasts for about 5.3 min. The BFO values are calculated assuming a bias of 151 Hz, i.e., the oscillator in the SATCOM has drifted up by 1 Hz in frequency from the time it was at KLIA. This small drift allows the calculated BFO to match the measured values of BFO with a value of VS that is a multiple of 100 fpm, which is the resolution of VS that is selectable by the thumbwheel on the Mode Control Panel (MCP) of a B777. In fact, we don’t precisely know the true value of the BFO bias, but a 1-Hz drift is possible.
Calculated and measured BFO data during the descent at 18:40.
Also shown in the preceding figure are all 49 recorded values of BFO at 18:40. The best-fit line of the BFO data indicates a trend with a slope of 0.4 Hz/min, corresponding to a variation of ±0.2 Hz about the mean over that 1-minute interval, while the measured variation in BFO is ±2 Hz about the mean of 88 Hz. From this, we conclude that there is no discernable trend in the BFO data over this 1-minute interval, i.e., the BFO values do not appear to vary with time. The ±2 Hz variation in the BFO data is therefore treated as noise.
For the first two minutes of the calculated descent, the airspeed is held at a constant M=0.8, and the IAS increases during the descent from its initial value of 278 kn. As the outside air temperature increases during the descent, the true airspeed (TAS) increases, which causes the BFO to rise at a rate of 0.2 Hz/min. This corresponds to a variation of BFO of ±0.1 Hz over the 1-minute interval of the recorded BFO data. This variation is much smaller than the value of ±2 Hz due to BFO noise.
After about two minutes of descent at M0.8, the plane reaches a pressure altitude of 29,000 ft (FL290), and the airspeed has increased to 310 kn. At this speed, the autothrottle automatically changes modes and begins to maintain a constant airspeed of 310 KIAS during the descent. The Mach number also begins to fall. Increasing air density during the descent causes a reduction of true airspeed with a corresponding reduction in groundspeed, and the calculated BFO changes at a rate of -0.6 Hz/min. If the descent was timed so that BFO data was recorded during the descent at 310 KIAS, the variation in BFO due to the descent would be ±0.3 Hz. Although higher than the variation in BFO during a descent at M0.8, the variation is still much lower than the ±2 Hz due to BFO noise.
It should be noted that when 310 KIAS is displayed in the speed window of the MCP, this value represents the minimum airspeed during the descent at VS=-2600 fpm. If the airspeed falls below 310 KIAS, the autothrottle would increase the thrust to restore the airspeed to 310 KIAS. However, if the speed increases past 310 KIAS and the thrust is already at idle, the speed can only be maintained if the pilot adds drag by operating the speed brake lever. If the speed brake is not used, then the airspeed will increase past 310 KIAS. The net effect of this increase in airspeed will be to reduce the rate of BFO from falling at -0.6 Hz/min. Since we are concerned here with the variation of BFO during the descent, modeling the descent at a constant value of 310 KIAS provides a worst case estimate of this variation.
Conclusion
The timing of MH370’s final turn to the south has an important impact on the estimated end point along the 7th arc. The later the timing of the turn, the further north the end point is predicted to be. Although the BFO values at 18:40 UTC recorded during a 1-minute interval suggest the plane was flying at constant altitude and had already turned south, an alternative interpretation is the plane was still traveling northwest but was descending. Here, we find that the combination of groundspeed and vertical speed that is required to match the BFO at 18:40 also corresponds to a typical descent rate of around 3°. We also find that over the 1-minute interval, the change in BFO that is expected due to this descent is small compared to the noise in the BFO values that were recorded. An autopilot mode that minimizes the variation in BFO is V/S at -2600 fpm.
Debris map from MH370 produced by the School of Civil, Environmental and Mining Engineering & The UWA Oceans Institute
Families of MH370 passengers and crew gathered on March 4 for the Third Annual Remembrance Event of the disappearance. As part of the three-hour event, Dr Charitha Pattiaratchi, a Professor of Coastal Oceanography from the University of Western Australia, presented “The Utilisation of Ocean Drift Modeling Techniques to Locate MH370”. According to a story by aviation writer Geoffrey Thomas, Dr Pattiaratchi said that UWA’s reverse-drift modelling puts MH370 “at Longitude 96.5 E Latitude 32.5 S with a 40km radius”. This means his estimate is at the northern end of the new search zone recommended recently by the ATSB, which was between latitudes 32S and 36S, with a total area of 25,000 sq km, and with the highest probability at 35S latitude. Dr Pattiaratchi claims that UWA’s drift model is consistent with the recovery of 18 of the 22 pieces of debris found to date.
Also as part of the Remembrance Event was the announcement that Voice370, an advocate and support group for MH370 families, launched an effort to raise money to privately search for the aircraft. In a statement recently released, the group would like to search the “newly recommended 25,000 sq km”, which presumably is the same area recommended by the ATSB. The statement is careful to not cite the group’s fundraising goal, although in a previous Reuters story , Grace Nathan, daughter of MH370 passenger Anne Daisy, pegged the number at $15 million.
This blog is dedicated towards solving the mystery of the disappearance of MH370, and I fully support continued efforts to find the plane. However, I pose a simple question: “What level of confidence do we have today that the plane will be found in the 25,000 sq km of seabed now proposed?”
[Professor Pattiaratchi] claims the research gives authorities the “credible evidence” required to restart the search.
“That’s as good of information as you can get from an oceanography point of view.
“There is absolutely no doubt about the debris that has been found.”
The ATSB spent almost two years searching a 120,000sqkm area in the southern Indian Ocean for MH370, an area the UWA model predicted would prove fruitless.
“As soon as the flaperon (part of the aircraft’s wing) was found, we were saying it was unlikely that the plane went down in the search area at that time,” Professor Pattiaratchi said.
“The ATSB did not take into account the debris that was found. And despite the flaperon being found on [Reunion Island in] July 2015, it took them until November 2016 – almost 18 months – for them to acknowledge [MH370] is not [located] where they were searching.
It is true that the ATSB and DSTG did not incorporate drift modeling into their analyses until fairly late in the game, and Dr Pattiaratchi’s remarks are going to cause them some embarrassment. But we also have to ask ourselves: What part of the ATSB’s analysis was incorrect?
Radar data from MH370 and another possible aircraft. (Click to enlarge.)
As readers here know, we have been re-visiting previously held beliefs about MH370 to better understand why the underwater search failed to find the plane. The ATSB continues to believe the assumptions that it and the DSTG used to define the current search area were correct. But if these assumptions were correct, the probability of finding the plane where it was searched was very high. Either the search team was extremely unlucky, or some of the long-held assumptions are incorrect.
It is in the spirit of questioning assumptions that I present a new possibility regarding the military radar data of MH370 above the Malacca Strait: I consider that the captures recorded by the military radar installations might be from two aircraft rather than just from MH370, as I show in the figure above. The motivation for this inquiry is the following facts that taken together cause some concern:
The radar data shown in the Lido Hotel image shows an aircraft following airway N571 at a speed of around 500 kn. The last radar capture is at 18:22:12 just past waypoint MEKAR. (All times here are UTC.)
If MH370 continued following N571 after the last radar capture, at the time of the log-on at 18:25:27, it would be traveling on a track of 296T.
The BTO sequence during the SATCOM log-on suggests that MH370 was not following N571 at 18:25:27 through 18:28:15. However, the final BFO value suggests the plane was flying at around 296T and 500 kn, which would put it roughly parallel to N571.
It is possible that the pilot performed a lateral offset manoeuver of around 12 NM between the last radar capture at 18:22:12 and the log-on request at 18:25:27. However, the manoeuver would have to be fairly well-timed to fit in that period of about three minutes.
If we ignore the military radar data after around 18:02, we can find paths starting from this time that match the BTO and BFO data without the need to invoke the lateral offset manoeuver, as shown in the last post.
The ATSB reports that the military radar data supplied by Malaysia concludes with a position and time at 18:01:49, and then after a 20-minute gap, there is a single capture at 18:22:12. This contradicts the many captures shown in the Lido Hotel image during this 20-minute period. The DSTG also reports that the final radar capture at 18:22:12 was not used to reconstruct possible flight paths.
To investigate this further, I considered a version of the Lido Hotel image that was studied back in May 2014 by IG member Bill Holland, and shown below. Bill enlarged the high-resolution version of the photograph, and he noticed that there were timestamps printed to the right of the targets. (The timestamps refer to local Malaysian time, which is eight hours ahead of UTC.) Although the timestamps were blurred and overlapping, using a timescale that he superimposed as a guide, he could determine what the values were for some of the timestamps. From this, he deduced that the plane’s speed was around 500 kn.
Enlarged Lido Hotel radar image with timestamps added by Bill Holland. (Click to enlarge.)
But there are features in this slide that was never explained. For one, there is a capture at 18:07:06 whose position is about 7.5 NM off of MH370’s path, and also about 2.3 minutes later than the surrounding points. Because this capture doesn’t match the path suggested by the other captures, most of us have assumed it represent a false target, and we have ignored it. Another feature is that there is an explained “hole” in the radar coverage between around 18:07:06 and 18:12:30. The Malaysian officials thought this gap in coverage was important enough to draw a white circle emphasizing it.
We can see in the figure that the radar captures that are to the west of the “hole” lie along airway N571 between waypoints VAMPI and MEKAR. We also see that these captures align with the unexplained capture at 18:07:06, suggesting this may represent the path of a second aircraft.
We can also see that the paths of the two aircraft cross in the “hole”. Perhaps the gap in radar coverage is due to the radar’s inability to distinguish and positively identify each target due to proximity. The intersection of paths occurs near the center of this circle, although the aircraft would pass this intersection point at different times.
There are some other interesting aspects of this hypothesis about two aircraft captured by radar. The path of MH370 that is shown in the figure corresponds to a track of about 296T, which is roughly parallel to N571 after MEKAR, yet with an offset to the right from N571 that produces a good match with both the BTO and the BFO data at about 495 kn. So, this theory allows us to match the BFO and BTO data without invoking a precisely timed lateral offset manoeuver. MH370’s path is already spaced to the right of N571.
Another interesting aspect occurs when we extrapolate the path of the second aircraft backwards in time. Doing so, we find that the path crosses a point just to the south of Runway 18 of Butterworth Air Field near Penang. This raises the possibility that the second aircraft departed from from Butterworth and chased MH370. Richard Godfrey discovered that this point to the south of Butterworth falls very close to waypoint UPTOP.
We can estimate the speed of the second aircraft by considering the timing and positions of the radar captures that have timestamps of 18:07:06 and 18:13:30, which correspond to the unexplained radar point to the east of the “hole” and another capture after waypoint VAMPI to the west of the “hole”. The distance is about 77 NM, which would mean the second aircraft was flying with a groundspeed of about 722 kn. Assuming a temperature offset from standard conditions of about 14K, this corresponds to Mach 1.07 at sea-level, and Mach 1.21 at FL350. This tells us the second aircraft was not a civilian aircraft. The speeds, although fast, are certainly within the speed capability of modern military fighter jets, including one of the Boeing F/A-18D Hornets based at Butterworth Air Field.
We can also use the timestamps of the targets to the west of the “hole” to determine that the groundspeed of the second aircraft was around 500 kn after it caught MH370. This suggests that the two plane were flying roughly side-by-side, albeit with an estimated lateral separation of about 18 NM.
If this hypothesis considered here is true, it would answer some important questions about the radar data. But it would also raise even more questions about how Malaysia responded to MH370 after it disappeared from civilian radar screens and flew back across the Malay peninsula and above the Malacca Strait. If the theory is correct, it also would raise important questions about why Malaysia chose to keep this high-speed chase a secret.
Candidate MH370 paths starting from the same point at 18:02. (Click for a larger image.)
MH370’s SATCOM initiated a log-on to Inmarsat’s I3F1 satellite at 18:25:27, and after some exchange of data, completed that log-on at 18:28:15. (All times are UTC). The log-on process provides us with additional BTO and BFO data points which can help us to understand what the path and speed of the plane was at this time. Many of us have long assumed that the plane’s track just before the log-on was 296°T and the groundspeed was around 495 kn for two reasons:
These values are consistent with the position and timing data that we extracted from the often-discussed Lido Hotel radar slide, which was presented to the NOK in Beijing on March 21, 2014. The slide shows radar captures of an unknown target (suspected to be MH370) up until 18:22 along the N571 airway traveling at about 495 kn.
This combination of speed (495 kn) and track (296°T) matches the first and last BFO values (142-144 Hz) surprisingly well.
However, there are two problems with this theory:
Between the initial and final values of around 143 Hz, the BFO peaks at 273 Hz and decays to intermediate values of around 174 Hz before returning to 144 Hz.
If we assume the last recorded radar position at 18:22 is correct, then the BTO values during the log-on don’t match a plane traveling at a constant 495 kn along N571.
Back in July of 2015, some of us proposed an explanation that reconciled the radar, BTO, and BFO data: Soon after MH370’s SATCOM requested the 18:25 log-on to Inmarsat’s I3F1 satellite, the pilot initiated a 12-NM lateral offset manoeuver to the right of airway N571. (A pilot flying a leg of a route can program a lateral offset of a specified distance and the offset manoeuver will be automatically performed and the offset automatically maintained.) If the offset was timed just right, i.e., initiated just after 18:25:27 and completed just before 18:28:06, the BTO data matches, and all but the peak BFO value of 273 Hz can be explained. Most of us attributed this unexplained peak in frequency to a SATCOM anomaly that was not disclosed by its manufacturer (Honeywell Thales). With nothing better, we chose to ignore it.
We have gained more knowledge now that Ian Holland published his paper that discusses BFO behavior of a SATCOM as it logs-on to a satellite after it has been previously de-powered. Dr. Holland’s analysis suggests that the BFO sequence observed at 18:25 was not caused by a turn sequence taking place during the log-on. Rather, the BFO sequence is consistent with a SATCOM that has been de-powered for some time, warms-up, and logs-on to a satellite. As the oscillator crystal in the Satellite Data Unit (SDU) approaches it operating temperature, there is a peak in frequency followed by a decay to its final value. (Some like Mike Exner, Henrik Rydberg, and others have long suspected this.) So now the unexplained peak of 273 Hz is explained and verified as repeatable.
Although the warm-up transient adequately explains the BFO sequence at the 18:25 log-on, it still doesn’t explain the BTO sequence, which is not consistent with a path along N571 at 495 kn between 18:25:27 and 18:28:15 that includes the recorded radar position at 18:22.
We have some additional clues from the report on MH370 released in December 2015 by Australia’s Defense Science and Technology Group (DSTG). As part of the investigation of MH370’s disappearance, Malaysia supplied the ATSB with the raw radar data up until the last capture at 18:22:22 with a 10-second spacing. However, no radar data was supplied between 18:01:49 and 18:22:22, and no explanation was provided for the 20-minute gap. If we are to believe there were no radar captures in this period, we should also question the validity of the data shown in the Lido Hotel radar image. This in turn calls into question whether MH370 was following airway N571 at the time of and subsequent to the final radar capture.
If we remove the constraint that MH370 was following airway N571, we can consider other candidate paths using the following methodology:
The path of MH370 that was captured by radar can be approximated by starting at a known position before 17:21 and integrating the groundspeed and track data provided graphically in the DSTG report. (Despite numerous requests, Malaysia refuses to release the actual radar data.)
Starting at the radar-derived position at 18:02 and lasting through the 18:25 log-on, we assume that MH370 proceeded along a great circle path towards a selected waypoint at constant ground speed. The effect of variations in wind and temperature are ignored for now. (In fact, the temperature variation is small and the groundspeed differs from the true airspeed by at most several knots, which is within the margin of error of this analysis.) Several candidate waypoints are considered, each producing a different initial track at 18:02.
For each initial track, a speed is determined by minimizing the RMS error of the BTO values at times 18:27:04 through 18:28:15 where the expected standard deviation is 29 μs. For the BTO at 18:25:27, the expected standard deviation is higher at 62 μs and was not used.
For the BFO, only the BFO value at 18:28:15 is considered, as the prior values are distorted by the warm-up transient, as advised by Dr. Holland.
The candidate paths are shown in the figure above, and the results from the analysis are shown in table below. The paths fan outwards from the recorded radar position at 18:02. It can be seen in the figure that as the initial track rotates towards the north, the path length required to reach the 18:28 arc increases, which translates to higher speeds, and also higher BFOs. Therefore, not all of these paths satisfy speed and BFO criteria. A discussion of the candidate paths follows.
Case 1. Path towards the last radar point at 18:22 that minimizes BTO error
This is the baseline case considered in the DSTG report as the initial track of the path connecting the 18:02 and 18:22 radar positions is close to the observed radar track at 18:02 (around 289°T). The BTO error is minimized at a groundspeed of 459 kn, requiring a reduction in speed of about 59 kn, which is possible. (A pilot could choose to decelerate by climbing or using spoilers, which would drastically reduce the time to reach the new speed.) The BFO error at this speed is 6 Hz, which is acceptable by most measures. However, the distance and timing between the two radar points requires a minimum speed of around 499 kn, which would mean that the 18:22 radar point was in error by about 14 NM. So, considering this error and the absence of acknowledged radar data between 18:02 and 18:22, there is justification to completely ignore this last radar point, just as the DSTG chose to do in its analysis. Therefore, in the remaining cases analyzed, the last radar point at 18:22 is ignored, and we accept the 18:02 radar point as the last recorded position. Ignoring the last radar point doesn’t invalidate this path. It just makes it less special.
Of course, if we ignore the last radar capture, it once again begs the question that Malaysia refuses to answer: What data was actually shown to the NOK at the Lido Hotel in Beijing on March 21, 2014?
Cases 2,3,4,5. Paths towards airports that minimize BTO error
Recognizing that the radar data suggests that MH370 flew near (but not exactly over) Kota Bharu and later Penang Airports, we consider the possibility that after passing Penang, the plane was flown towards another airport in the region. We consider candidate paths towards Port Blair, Car Nicobar, Sabang, and Banda Aceh Airports, and for each path, find the speed that minimizes the BTO errors. As can be seen in the table, only the path towards Car Nicobar has an acceptable BFO error (3 Hz) and an acceptable speed (518 kn). This speed is consistent with what was observed by radar around 18:02. It’s also very fast compared to typical cruise conditions, corresponding to (no-wind conditions) of about Mach = 0.87 at FL350 at a temperature offset from standard conditions of around +10K. Although this Mach number is within the performance limitations of the plane, if MH370 flew along this path, it has important implications on the achievable endurance and range.
Case 6. Path that minimizes BTO error and exactly matches BFO
For this case, we allowed both the track angle and speed to vary as the BTO error was minimized and the BFO at 18:28:15 was constrained to match exactly. The calculated groundspeed is 499 kn, which is closer to a more typical speed that maximizes fuel efficiency. The path crosses the 18:28 arc about 33 NM to the north of the ATSB’s baseline path towards the 18:22 radar point.
Summary
The radar data presented to the NOK at the Lido Hotel in Beijing on March 21, 2014, has been used by independent investigators to justify a path along airway N571. Recognizing that the radar data has never been officially acknowledged by Malaysia, and also recognizing that the radar data from that image was never provided to the ATSB by Malaysia, we have to question its validity. Strangely, the final radar point at 18:22 from that image was provided to the ATSB, despite the 20-minute gap between it and the proceeding capture at 18:02. By choosing to ignore this final radar point, MH370 is much less likely to have followed N571, and other candidate paths along great circles can be found that satisfy the BFO and BTO data at the 18:25 log-on. The path that arguably best satisfies the satellite data crosses the 18:28 arc 33 NM to the north of the path that includes the 18:22 radar point. There is also an acceptable path that leads to Car Nicobar Airport, which requires a speed about the same as was observed before radar coverage was lost at 18:02.
Update on 2/22/2017: Incorporated some small edits based on private comments from Mike Exner.

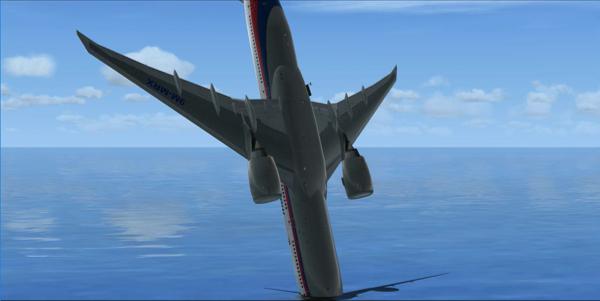
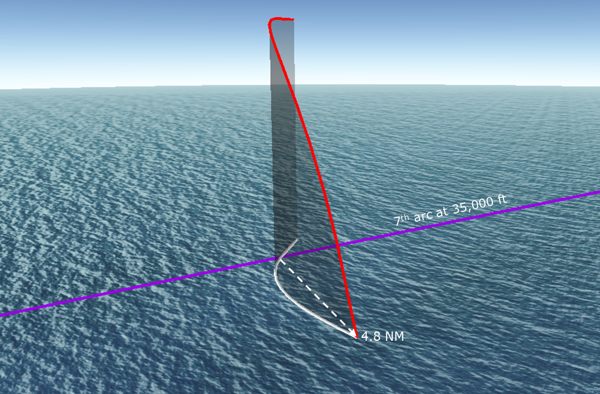
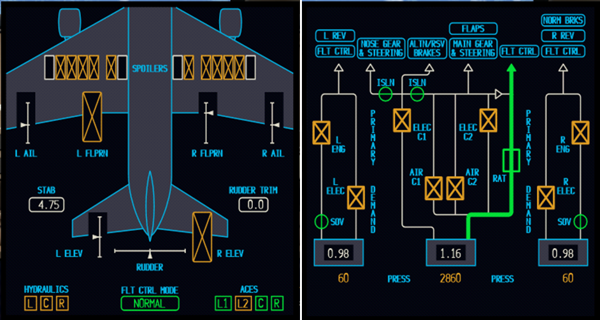

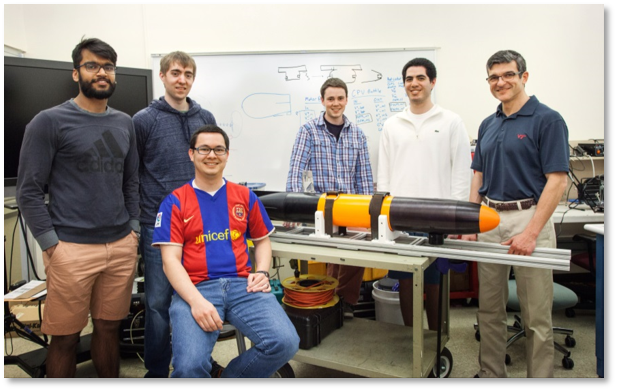

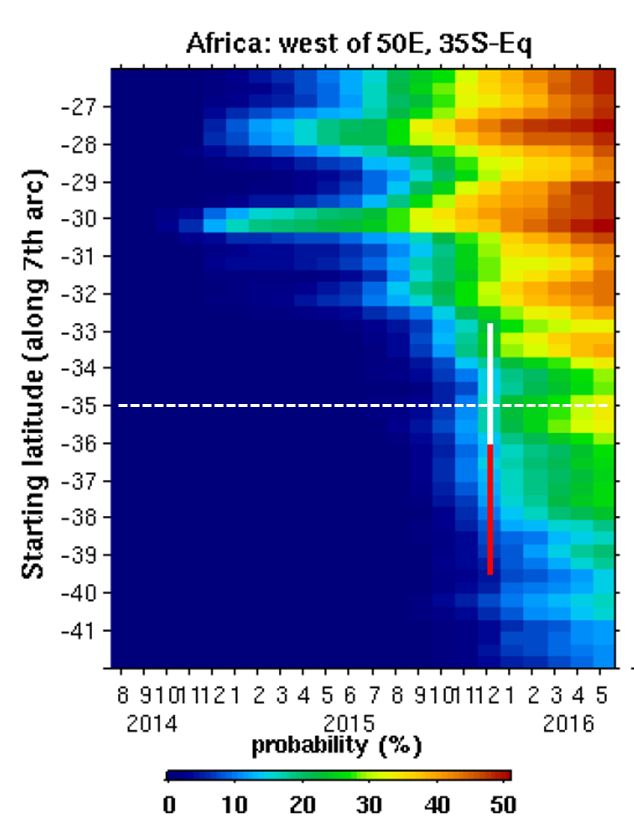


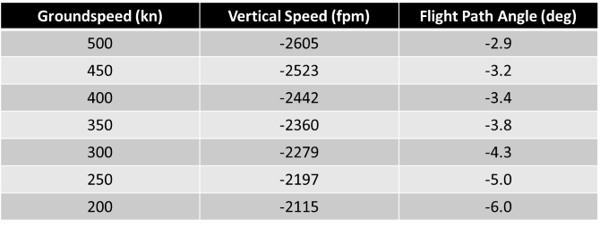
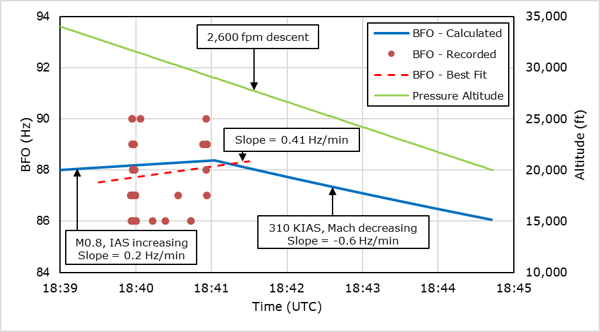


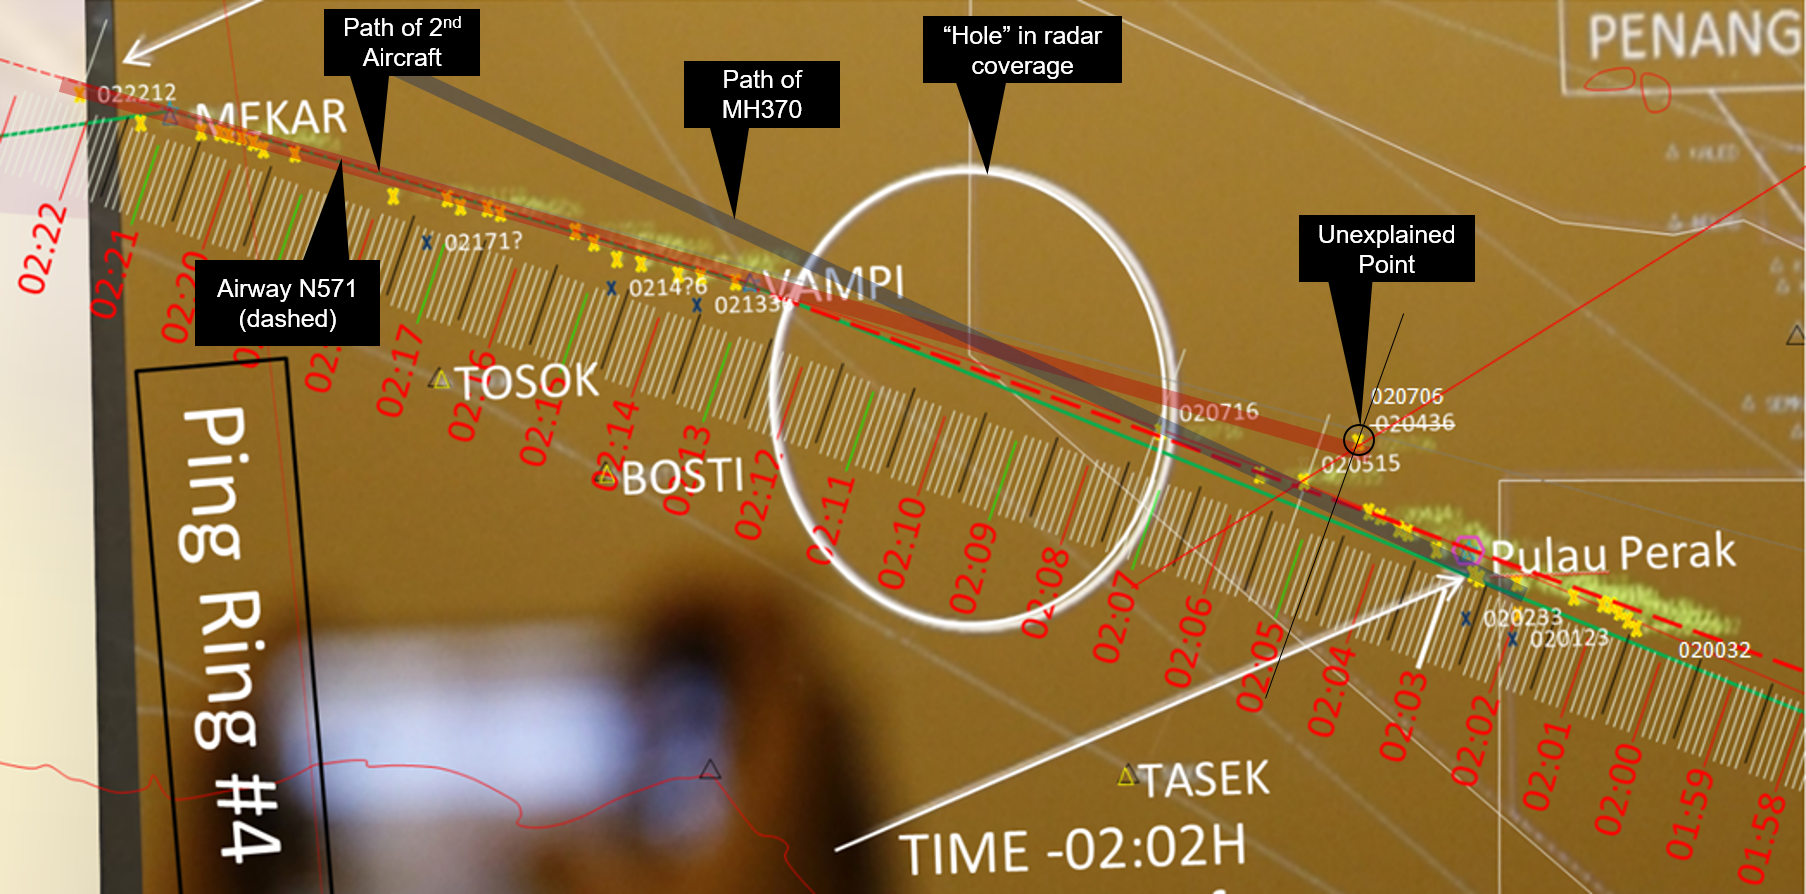

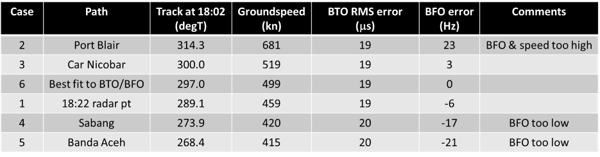